Grundläggande statistik
| Institutionella ägare | 191 total, 189 long only, 0 short only, 2 long/short - change of 1,60% MRQ |
| Genomsnittlig portföljallokering | 0.1172 % - change of −25,29% MRQ |
| Institutionella aktier (lång) | 24 022 937 (ex 13D/G) - change of −0,24MM shares −0,98% MRQ |
| Institutionellt värde (lång) | $ 266 882 USD ($1000) |
Institutionellt ägande och aktieägare
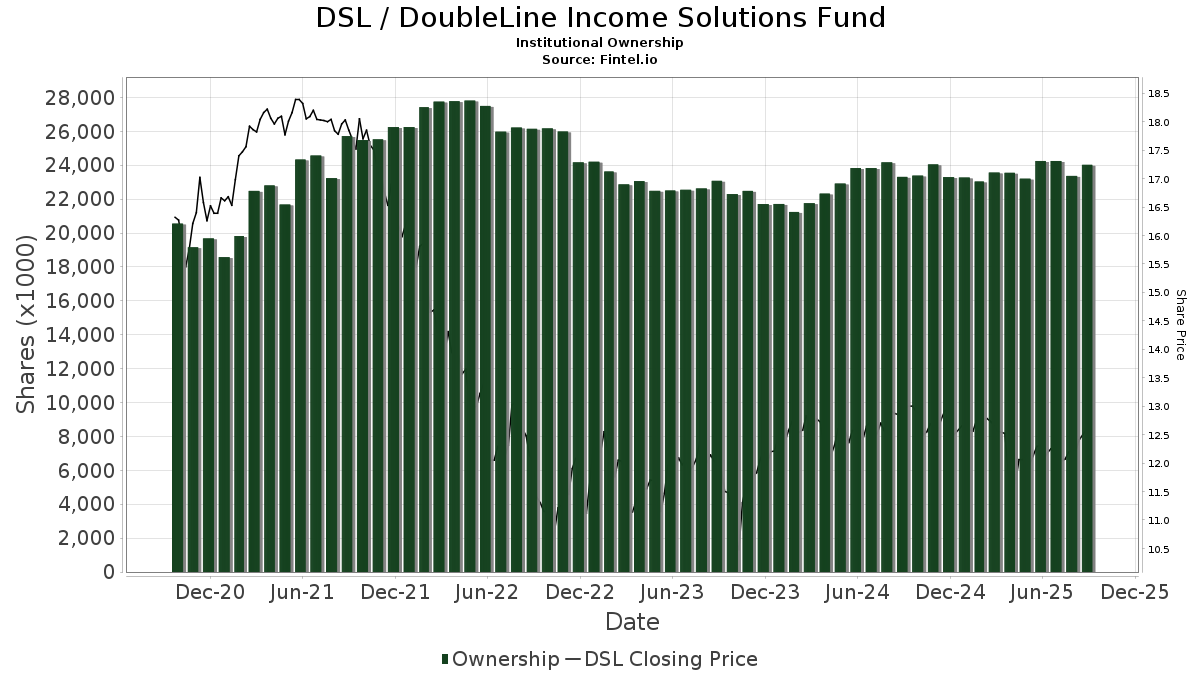
DoubleLine Income Solutions Fund (US:DSL) har 191 Institutionella ägare och aktieägare som har lämnat in 13D/G- eller 13F-formulär till Securities Exchange Commission (SEC). Dessa institut innehar totalt 24,022,937 aktier. Största aktieägare inkluderar McGowan Group Asset Management, Inc., Morgan Stanley, Wells Fargo & Company/mn, UBS Group AG, Invesco Ltd., PCEF - Invesco CEF Income Composite ETF, Stifel Financial Corp, Ameriprise Financial Inc, Raymond James Financial Inc, and Royal Bank Of Canada .
DoubleLine Income Solutions Fund (NYSE:DSL) Institutionell ägarstruktur visar institutioners och fonders nuvarande positioner i företaget, samt de senaste förändringarna i positionernas storlek. Större aktieägare kan vara enskilda investerare, fonder, hedgefonder eller institutioner. Bilaga 13D visar att investeraren äger (eller ägde) mer än 5% av företaget och avser (eller avsåg) att aktivt eftersträva en förändring av affärsstrategin. Schedule 13G indikerar en passiv investering på över 5%.
The share price as of September 8, 2025 is 12,65 / share. Previously, on September 9, 2024, the share price was 12,94 / share. This represents a decline of 2,24% over that period.
Fondsentimentets poäng
Fondsentimentet poängen(fka Ägarackumulation-poäng) visar vilka aktier som är mest köpta av fonder. Det är resultatet av en sofistikerad kvantitativ flerfaktormodell som identifierar företag med de högsta nivåerna av institutionell ackumulering. Poängsättningsmodellen använder en kombination av den totala ökningen av redovisade ägare, förändringarna i portföljallokeringarna för dessa ägare och andra mått. Siffran sträcker sig från 0 till 100, där högre siffror indikerar en högre nivå av ackumulering i förhållande till sina konkurrenter, och 50 är genomsnittet.
Uppdateringsfrekvens: Dagligen
Se Ownership Explorer, som innehåller en lista över de högst rankade företagen.
Institutionell sälj/köp-kvot
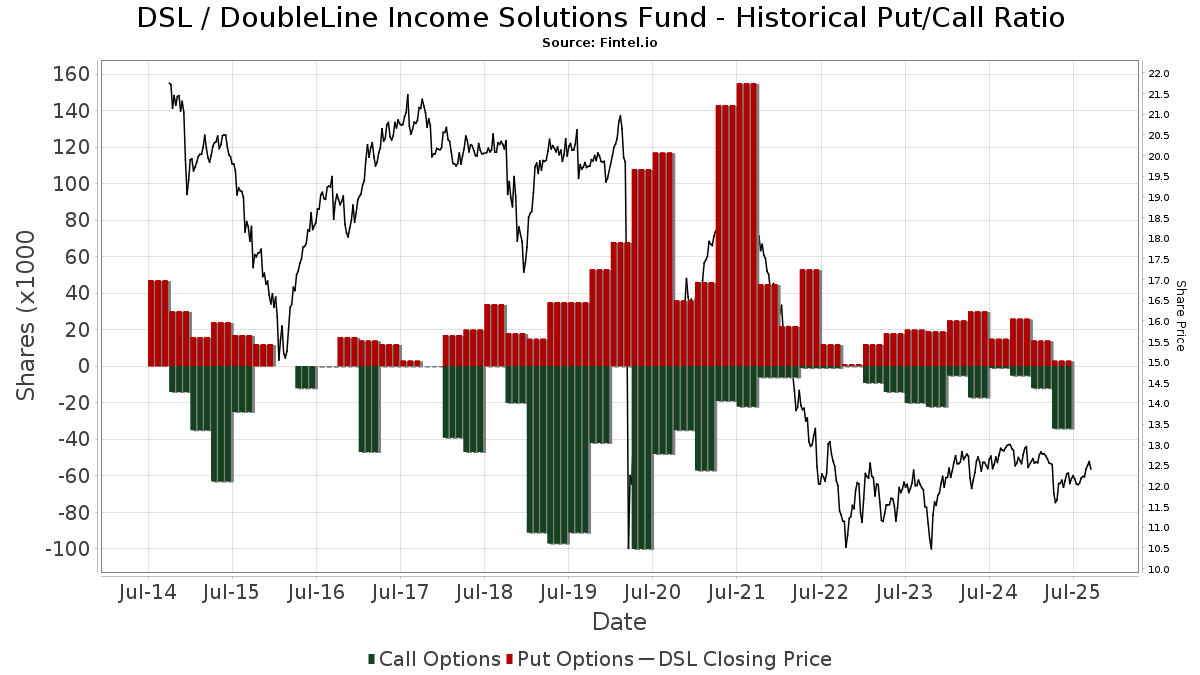
Förutom att rapportera vanliga eget kapital- och skuldemissioner måste institutioner med mer än 100MM tillgångar under förvaltning också avslöja sina innehav av sälj- och köpoptioner. Eftersom säljoptioner i allmänhet indikerar ett negativt sentiment och köpoptioner indikerar ett positivt sentiment, kan vi få en uppfattning om det övergripande institutionella sentimentet genom att plotta förhållandet mellan säljoptioner och köpoptioner. Diagrammet till höger visar det historiska förhållandet mellan sälj- och köpoptioner för detta instrument.
Genom att använda sälj/köp-kvoten som en indikator på aktieägarnas sentiment undviker man en av de största bristerna med att använda det totala institutionella ägandet, nämligen att en betydande del av de förvaltade tillgångarna investeras passivt för att följa index. Passivt förvaltade fonder köper vanligtvis inte optioner, så indikatorn för sälj/köp-kvoten ger en bättre bild av stämningen i aktivt förvaltade fonder.
13F- och NPORT-arkiveringar
Detaljer om 13F-arkiveringar är gratis. Detaljer om NP-arkiveringar kräver ett premiummedlemskap. Gröna rader indikerar nya positioner. Röda rader indikerar stängda positioner. Klicka på länk symbolen för att se hela transaktionshistoriken.
Uppgradera
för att låsa upp premiumdata och exportera till Excel ![]() .
.
| Fil Datum | Källa | Investerare | Typ | Genomsnittligt pris (beräknat) |
Aktier | Δ Aktier (%) |
Rapporterat värde (1000 USD) |
Δ Värde (%) |
Portföljallokering (%) |
|
|---|---|---|---|---|---|---|---|---|---|---|
| 2025-09-05 | 13F | Ghe, Llc | 47 476 | 24,28 | 581 | |||||
| 2025-08-14 | 13F | First Foundation Advisors | 20 553 | −14,13 | 252 | −16,61 | ||||
| 2025-08-13 | 13F | Granite Investment Partners, LLC | 33 193 | 2,38 | 406 | −0,49 | ||||
| 2025-08-12 | 13F | CIBC Private Wealth Group, LLC | 10 033 | 0,01 | 123 | 7,02 | ||||
| 2025-07-17 | 13F | Beacon Capital Management, LLC | 1 064 | 2,80 | 13 | 0,00 | ||||
| 2025-07-09 | 13F | Triumph Capital Management | 30 857 | −44,38 | 378 | −46,07 | ||||
| 2025-08-11 | 13F | Pin Oak Investment Advisors Inc | 42 065 | 0,00 | 1 | |||||
| 2025-08-11 | 13F | Strategic Wealth Partners, Ltd. | 197 357 | 69,03 | 2 416 | 61,32 | ||||
| 2025-08-18 | 13F | Hollencrest Capital Management | 36 938 | 2,06 | 452 | −0,88 | ||||
| 2025-08-12 | 13F | Insigneo Advisory Services, Llc | 17 454 | 0,00 | 214 | −3,18 | ||||
| 2025-07-14 | 13F | Sowell Financial Services LLC | 24 709 | −67,18 | 302 | −68,18 | ||||
| 2025-07-31 | 13F | Oppenheimer & Co Inc | 48 801 | −5,93 | 597 | −8,72 | ||||
| 2025-05-09 | 13F | Pathway Financial Advisers, LLC | 0 | −100,00 | 0 | |||||
| 2025-08-11 | 13F | United Advisor Group, LLC | 33 853 | −22,42 | 414 | −24,73 | ||||
| 2025-08-14 | 13F | Dauntless Investment Group, LLC | 326 | 4 | ||||||
| 2025-08-13 | 13F | Jones Financial Companies Lllp | 1 068 | 13 | ||||||
| 2025-08-07 | 13F | Montag A & Associates Inc | 0 | −100,00 | 0 | |||||
| 2025-08-13 | 13F | Botty Investors LLC | 15 000 | 0,00 | 184 | −3,17 | ||||
| 2025-07-25 | 13F | Apollon Wealth Management, LLC | 16 640 | −74,99 | 204 | −75,80 | ||||
| 2025-07-03 | 13F | Sage Capital Advisors,llc | 33 586 | −14,84 | 411 | −17,30 | ||||
| 2025-08-06 | 13F | Paragon Capital Management Inc | 88 344 | −0,25 | 1 081 | −3,14 | ||||
| 2025-08-14 | 13F | Cohen & Steers, Inc. | 348 993 | 0,00 | 4 | 0,00 | ||||
| 2025-08-15 | 13F | Morgan Stanley | 3 149 726 | 5,13 | 38 553 | 2,04 | ||||
| 2025-08-19 | 13F | Newbridge Financial Services Group, Inc. | 1 750 | 21 | ||||||
| 2025-08-14 | 13F | Williams Jones Wealth Management, LLC. | 12 822 | 0,00 | 157 | −3,11 | ||||
| 2025-07-11 | 13F | Farther Finance Advisors, LLC | 7 001 | 366,73 | 86 | 372,22 | ||||
| 2025-08-04 | 13F | Spire Wealth Management | 4 000 | 0,00 | 49 | −4,00 | ||||
| 2025-08-14 | 13F | UBS Group AG | 1 019 319 | 2,13 | 12 476 | −0,87 | ||||
| 2025-04-17 | 13F | Precedent Wealth Partners, Llc | 0 | −100,00 | 0 | |||||
| 2025-08-04 | 13F | ELCO Management Co., LLC | 15 000 | 2,04 | 184 | −1,08 | ||||
| 2025-07-30 | 13F | Whittier Trust Co | 16 831 | −1,95 | 206 | −4,63 | ||||
| 2025-08-14 | 13F | Stifel Financial Corp | 744 956 | 1,66 | 9 118 | −1,32 | ||||
| 2025-07-14 | 13F | Golden State Equity Partners | 152 774 | 1,89 | 1 870 | −1,11 | ||||
| 2025-07-30 | 13F | D.a. Davidson & Co. | 230 981 | 5,30 | 2 827 | 2,21 | ||||
| 2025-08-14 | 13F | Herold Advisors, Inc. | 114 950 | 1 407 | ||||||
| 2025-07-31 | 13F | Optimum Investment Advisors | 6 010 | 0,00 | 74 | −2,67 | ||||
| 2025-07-29 | 13F | Foster & Motley Inc | 58 052 | −1,18 | 1 | |||||
| 2025-07-30 | 13F | Whittier Trust Co Of Nevada Inc | 250 | −86,90 | 3 | −87,50 | ||||
| 2025-08-14 | 13F | Evergreen Capital Management Llc | 0 | −100,00 | 0 | |||||
| 2025-07-10 | 13F | Focus Financial Network, Inc. | 22 443 | 7,58 | 275 | 4,18 | ||||
| 2025-08-14 | 13F | Hrt Financial Lp | 45 065 | 1 | ||||||
| 2025-08-04 | 13F | Assetmark, Inc | 0 | −100,00 | 0 | |||||
| 2025-08-13 | 13F | Cerity Partners LLC | 51 400 | −3,60 | 629 | −6,40 | ||||
| 2025-08-14 | 13F | Wetherby Asset Management Inc | 20 000 | −21,83 | 245 | −23,99 | ||||
| 2025-08-14 | 13F | Citadel Advisors Llc | Put | 0 | −100,00 | 0 | ||||
| 2025-08-12 | 13F | Walled Lake Planning & Wealth Management, Llc | 39 332 | 0,41 | 481 | −2,43 | ||||
| 2025-08-14 | 13F | Apriem Advisors | 22 300 | 0,00 | 273 | −3,20 | ||||
| 2025-08-15 | 13F | Tower Research Capital LLC (TRC) | 0 | −100,00 | 0 | |||||
| 2025-05-08 | 13F | Gsa Capital Partners Llp | 0 | −100,00 | 0 | |||||
| 2025-07-08 | 13F | Nbc Securities, Inc. | 53 475 | −3,66 | 1 | |||||
| 2025-08-07 | 13F | Evoke Wealth, Llc | 197 436 | 0,00 | 2 417 | −2,93 | ||||
| 2025-07-29 | 13F | Stratos Wealth Advisors, LLC | 180 033 | 208,33 | 2 204 | 199,32 | ||||
| 2025-08-14 | 13F | Ancora Advisors, LLC | 500 | 0,00 | 6 | 0,00 | ||||
| 2025-07-28 | 13F | Harbour Investments, Inc. | 2 300 | −2,62 | 28 | −3,45 | ||||
| 2025-08-05 | 13F | GPS Wealth Strategies Group, LLC | 78 | 0,00 | 1 | |||||
| 2025-07-22 | 13F | Wealthcare Advisory Partners LLC | 122 001 | −0,92 | 1 493 | −3,80 | ||||
| 2025-08-14 | 13F | Mml Investors Services, Llc | 12 287 | −0,87 | 0 | |||||
| 2025-07-29 | 13F | Activest Wealth Management | 160 551 | −3,50 | 1 965 | −6,29 | ||||
| 2025-07-28 | 13F | BRYN MAWR TRUST Co | 1 800 | 0,00 | 22 | 0,00 | ||||
| 2025-07-29 | 13F | International Assets Investment Management, Llc | 17 290 | 0,00 | 212 | −3,21 | ||||
| 2025-08-05 | 13F | Peregrine Asset Advisers, Inc. | 31 832 | 0,04 | 390 | −2,99 | ||||
| 2025-05-14 | 13F | Landscape Capital Management, L.l.c. | 0 | −100,00 | 0 | |||||
| 2025-08-14 | 13F | Jane Street Group, Llc | 17 595 | −53,16 | 215 | −54,55 | ||||
| 2025-07-14 | 13F | AdvisorNet Financial, Inc | 400 | 0,00 | 5 | −20,00 | ||||
| 2025-08-06 | 13F | Golden State Wealth Management, LLC | 40 998 | −7,30 | 502 | −10,05 | ||||
| 2025-08-05 | 13F | Shaker Financial Services, LLC | 244 126 | 206,71 | 2 988 | 197,91 | ||||
| 2025-08-13 | 13F | M Holdings Securities, Inc. | 0 | −100,00 | 0 | |||||
| 2025-08-11 | 13F | Dorsey & Whitney Trust CO LLC | 13 350 | 4,71 | 163 | 1,88 | ||||
| 2025-08-15 | 13F | Kestra Advisory Services, LLC | 119 061 | 18,49 | 1 457 | 15,00 | ||||
| 2025-08-07 | 13F | Summit X, LLC | 102 730 | −12,35 | 1 257 | −14,90 | ||||
| 2025-08-11 | 13F | Elequin Capital Lp | 39 816 | 487 | ||||||
| 2025-05-02 | 13F | Signaturefd, Llc | 0 | −100,00 | 0 | |||||
| 2025-07-17 | 13F/A | Capital Investment Advisors, LLC | 18 700 | 0,00 | 229 | −2,98 | ||||
| 2025-08-12 | 13F | Global Retirement Partners, LLC | 1 356 | 143,88 | 17 | 166,67 | ||||
| 2025-08-13 | 13F | Invesco Ltd. | 935 733 | 2,60 | 11 453 | −0,42 | ||||
| 2025-07-14 | 13F | Gridiron Partners, LLC | 19 136 | 0,00 | 234 | −2,90 | ||||
| 2025-08-12 | 13F | LPL Financial LLC | 563 553 | 6,58 | 6 898 | 3,45 | ||||
| 2025-08-12 | 13F | Calton & Associates, Inc. | 28 165 | 35,81 | 345 | −10,18 | ||||
| 2025-04-29 | 13F | Lee Danner & Bass Inc | 0 | −100,00 | 0 | |||||
| 2025-08-04 | 13F | Bay Colony Advisory Group, Inc d/b/a Bay Colony Advisors | 48 691 | 0,83 | 596 | −1,65 | ||||
| 2025-08-14 | 13F | Ameriprise Financial Inc | 678 431 | 2,66 | 8 298 | −0,43 | ||||
| 2025-08-11 | 13F | HighTower Advisors, LLC | 423 017 | 1,21 | 5 178 | −1,76 | ||||
| 2025-08-01 | 13F | Envestnet Asset Management Inc | 47 595 | 27,02 | 583 | 23,31 | ||||
| 2025-07-29 | 13F | Woodard & Co Asset Management Group Inc /adv | 10 350 | 0,00 | 127 | −3,08 | ||||
| 2025-08-08 | 13F | Avantax Advisory Services, Inc. | 13 901 | −29,48 | 170 | −31,45 | ||||
| 2025-08-12 | 13F | MAI Capital Management | 1 650 | 0,00 | 20 | 0,00 | ||||
| 2025-08-12 | 13F | NWF Advisory Services Inc. | 14 616 | 26,94 | 184 | 27,78 | ||||
| 2025-08-14 | 13F | Federation des caisses Desjardins du Quebec | 1 135 | 0,00 | 14 | −7,14 | ||||
| 2025-07-16 | 13F | Maridea Wealth Management LLC | 44 265 | 1,37 | 542 | −1,64 | ||||
| 2025-05-05 | 13F | Lindbrook Capital, Llc | 5 500 | 0,00 | 69 | 0,00 | ||||
| 2025-08-13 | 13F | Northwestern Mutual Wealth Management Co | 416 | 5 | ||||||
| 2025-08-01 | 13F | Bessemer Group Inc | 0 | −100,00 | 0 | |||||
| 2025-08-11 | 13F | Private Advisor Group, LLC | 107 267 | 2,51 | 1 313 | −0,53 | ||||
| 2025-07-25 | 13F | Atria Wealth Solutions, Inc. | 70 692 | 10,08 | 865 | 6,92 | ||||
| 2025-07-08 | 13F | Parallel Advisors, LLC | 150 542 | 28,17 | 1 843 | 24,38 | ||||
| 2025-07-14 | 13F | E&G Advisors, LP | 55 500 | −1,77 | 679 | −4,63 | ||||
| 2025-08-14 | 13F | Mercer Global Advisors Inc /adv | 12 353 | 8,08 | 151 | 7,09 | ||||
| 2025-08-14 | 13F | TCG Advisory Services, LLC | 12 200 | 149 | ||||||
| 2025-07-29 | 13F | Arcus Capital Partners, LLC | 38 609 | −25,80 | 473 | −28,05 | ||||
| 2025-08-04 | 13F | Creekmur Asset Management LLC | 15 | 0 | ||||||
| 2025-08-12 | 13F | Journey Strategic Wealth Llc | 55 550 | −35,07 | 680 | −37,01 | ||||
| 2025-08-08 | 13F | Wall Street Access Asset Management, LLC | 14 642 | 179 | ||||||
| 2025-07-11 | 13F | Grove Bank & Trust | 0 | −100,00 | 0 | |||||
| 2025-07-25 | 13F | Cypress Capital Group | 49 895 | 611 | ||||||
| 2025-08-14 | 13F/A | Rockefeller Capital Management L.P. | 53 750 | −0,92 | 658 | −3,95 | ||||
| 2025-08-26 | 13F/A | Thrivent Financial For Lutherans | 177 762 | 0,96 | 2 | 0,00 | ||||
| 2025-07-18 | 13F | SOA Wealth Advisors, LLC. | 2 035 | 0,89 | 25 | −4,00 | ||||
| 2025-08-14 | 13F | Vivaldi Capital Management, LLC | 10 100 | 0,00 | 124 | −3,15 | ||||
| 2025-07-29 | 13F | Creekside Partners | 20 303 | 0,00 | 249 | −3,12 | ||||
| 2025-07-22 | 13F | Iron Horse Wealth Management, LLC | 207 | 3 | ||||||
| 2025-07-29 | 13F | Easterly Investment Partners Llc | 40 127 | 0,00 | 491 | −2,96 | ||||
| 2025-08-06 | 13F | Penserra Capital Management LLC | 444 190 | 3,04 | 5 | 0,00 | ||||
| 2025-08-06 | 13F | Commonwealth Equity Services, Llc | 56 936 | 7,81 | 1 | |||||
| 2025-07-28 | 13F | WealthPLAN Partners, LLC | 13 575 | 0,00 | 166 | −2,92 | ||||
| 2025-04-29 | 13F | Pensionmark Financial Group, Llc | 0 | −100,00 | 0 | |||||
| 2025-07-25 | 13F | Cwm, Llc | 5 491 | 7,04 | 0 | |||||
| 2025-07-21 | 13F | Future Financial Wealth Managment LLC | 16 850 | 0,00 | 206 | −2,83 | ||||
| 2025-08-12 | 13F | Jpmorgan Chase & Co | 2 426 | −93,03 | 30 | −93,38 | ||||
| 2025-08-14 | 13F | Sequent Planning LLC | 49 156 | 30,81 | 602 | 27,06 | ||||
| 2025-08-08 | 13F | Kingsview Wealth Management, LLC | 28 250 | 0,00 | 346 | −3,09 | ||||
| 2025-07-30 | 13F | Avidian Wealth Solutions, LLC | 16 000 | 0,00 | 196 | −2,99 | ||||
| 2025-08-07 | 13F | BOK Financial Private Wealth, Inc. | 6 056 | 0,00 | 74 | −2,63 | ||||
| 2025-08-12 | 13F | Horizon Kinetics Asset Management Llc | 56 052 | −2,88 | 686 | −5,64 | ||||
| 2025-05-14 | 13F | Susquehanna International Group, Llp | 0 | −100,00 | 0 | |||||
| 2025-08-06 | 13F | Mark Sheptoff Financial Planning, Llc | 500 | 6 | ||||||
| 2025-07-18 | 13F | Institute for Wealth Management, LLC. | 25 774 | 92,07 | 315 | 86,39 | ||||
| 2025-08-14 | 13F | Integrated Wealth Concepts LLC | 26 372 | −43,12 | 323 | −44,86 | ||||
| 2025-08-14 | 13F | NCM Capital Management, LLC | 12 300 | −3,91 | 151 | −6,83 | ||||
| 2025-07-16 | 13F | St Germain D J Co Inc | 850 | 0,00 | 10 | 0,00 | ||||
| 2025-07-15 | 13F | LeConte Wealth Management, LLC | 237 396 | −77,59 | 2 906 | −78,25 | ||||
| 2025-08-14 | 13F | Group One Trading, L.p. | Put | 1 100 | −78,00 | 13 | −79,37 | |||
| 2025-08-14 | 13F | Group One Trading, L.p. | Call | 1 600 | 220,00 | 20 | 216,67 | |||
| 2025-08-12 | 13F | J.w. Cole Advisors, Inc. | 35 083 | −30,76 | 429 | −32,76 | ||||
| 2025-08-07 | 13F | Parkside Financial Bank & Trust | 0 | −100,00 | 0 | |||||
| 2025-07-11 | 13F | Seacrest Wealth Management, Llc | 15 545 | −0,85 | 190 | −3,55 | ||||
| 2025-08-13 | 13F | Baird Financial Group, Inc. | 56 469 | 691 | ||||||
| 2025-08-14 | 13F | GWM Advisors LLC | 176 543 | 1,67 | 2 161 | −1,32 | ||||
| 2025-07-28 | NP | PCEF - Invesco CEF Income Composite ETF This fund is a listed as child fund of Invesco Ltd. and if that institution has disclosed ownership in this security, then these positions will not be double counted when calculating total shares and total value | 922 844 | 3,49 | 11 351 | −1,10 | ||||
| 2025-08-14 | 13F | Two Sigma Securities, Llc | 14 986 | 183 | ||||||
| 2025-07-10 | 13F | Wealth Enhancement Advisory Services, Llc | 46 094 | −8,67 | 565 | −11,16 | ||||
| 2025-07-22 | 13F/A | Kingstone Capital Partners Texas, LLC | 15 011 | 184 | ||||||
| 2025-08-13 | 13F | McGowan Group Asset Management, Inc. | 3 225 943 | 1,12 | 39 486 | −1,84 | ||||
| 2025-08-11 | 13F | FSA Wealth Management LLC | 0 | −100,00 | 0 | |||||
| 2025-08-14 | 13F | Wells Fargo & Company/mn | 1 380 492 | 8,47 | 16 897 | 5,29 | ||||
| 2025-08-13 | 13F | Guggenheim Capital Llc | 177 830 | 44,12 | 2 177 | 39,94 | ||||
| 2025-07-08 | 13F | Next Level Private LLC | 19 644 | 2,24 | 240 | −0,83 | ||||
| 2025-08-12 | 13F | Steward Partners Investment Advisory, Llc | 3 607 | 0,00 | 44 | −2,22 | ||||
| 2025-07-07 | 13F | Nova Wealth Management, Inc. | 3 350 | 0,00 | 41 | −2,38 | ||||
| 2025-08-07 | 13F | Allworth Financial LP | 7 652 | 361,52 | 94 | 389,47 | ||||
| 2025-08-13 | 13F | First Trust Advisors Lp | 94 730 | −0,96 | 1 159 | −3,90 | ||||
| 2025-08-14 | 13F | Cura Wealth Advisors, Llc | 21 910 | 0,00 | 268 | −2,90 | ||||
| 2025-07-30 | 13F | Journey Advisory Group, LLC | 227 512 | 0,27 | 2 785 | −2,69 | ||||
| 2025-08-08 | 13F | Pnc Financial Services Group, Inc. | 5 845 | 0,00 | 72 | −2,74 | ||||
| 2025-08-14 | 13F | Comerica Bank | 11 757 | −57,27 | 144 | −58,67 | ||||
| 2025-07-18 | 13F | Consolidated Portfolio Review Corp | 108 535 | −10,56 | 1 328 | −13,20 | ||||
| 2025-08-18 | 13F/A | National Bank Of Canada /fi/ | 107 657 | 11,66 | 1 314 | 8,15 | ||||
| 2025-08-15 | 13F | Equitable Holdings, Inc. | 37 273 | 0,02 | 456 | −2,77 | ||||
| 2025-08-14 | 13F | Matrix Private Capital Group Llc | 130 210 | 0,37 | 1 594 | −2,57 | ||||
| 2025-08-14 | 13F | Bank Of America Corp /de/ | 428 118 | 4,05 | 5 240 | 1,00 | ||||
| 2025-07-15 | 13F | World Equity Group, Inc. | 13 830 | 16,91 | 169 | 13,42 | ||||
| 2025-08-12 | 13F | Left Brain Wealth Management, LLC | 40 550 | 18,86 | 496 | 15,35 | ||||
| 2025-08-14 | 13F | Mariner, LLC | 44 146 | 2,23 | 540 | −0,74 | ||||
| 2025-08-12 | 13F | SRS Capital Advisors, Inc. | 1 800 | 22 | ||||||
| 2025-08-14 | 13F | Raymond James Financial Inc | 630 032 | 0,13 | 7 712 | −2,81 | ||||
| 2025-07-17 | 13F | Sound Income Strategies, LLC | 1 | 0,00 | 0 | |||||
| 2025-04-30 | 13F | Ramiah Investment Group | 57 906 | 54,10 | 730 | 59,04 | ||||
| 2025-07-25 | 13F | Concurrent Investment Advisors, LLC | 116 886 | 7,16 | 1 431 | 4,00 | ||||
| 2025-08-12 | 13F | Proequities, Inc. | Put | 0 | 0 | |||||
| 2025-08-12 | 13F | Proequities, Inc. | Call | 0 | 0 | |||||
| 2025-08-12 | 13F | Proequities, Inc. | 0 | 0 | ||||||
| 2025-04-22 | 13F | Synergy Financial Management, LLC | 0 | −100,00 | 0 | |||||
| 2025-08-07 | 13F | Hennion & Walsh Asset Management, Inc. | 0 | −100,00 | 0 | |||||
| 2025-08-12 | 13F | Financial Advocates Investment Management | 0 | −100,00 | 0 | |||||
| 2025-04-25 | 13F | Smallwood Wealth Investment Management, LLC | 333 | 4 | ||||||
| 2025-07-17 | 13F | Janney Montgomery Scott LLC | 282 852 | 6,21 | 3 | 0,00 | ||||
| 2025-04-29 | 13F | Raleigh Capital Management Inc. | 0 | −100,00 | 0 | −100,00 | ||||
| 2025-07-11 | 13F | SILVER OAK SECURITIES, Inc | 28 998 | 1,27 | 355 | −1,12 | ||||
| 2025-08-08 | 13F | Schwarz Dygos Wheeler Investment Advisors Llc | 108 346 | 6,04 | 1 326 | 2,95 | ||||
| 2025-08-11 | 13F | Alteri Wealth LLC | 19 121 | −1,19 | 234 | −4,10 | ||||
| 2025-07-28 | 13F | RFG Advisory, LLC | 12 200 | −7,58 | 149 | −10,24 | ||||
| 2025-07-21 | 13F | Trinity Legacy Partners, LLC | 296 789 | 1,50 | 3 576 | −0,39 | ||||
| 2025-07-31 | 13F/A | Avion Wealth | 501 | 0,00 | 0 | |||||
| 2025-07-21 | 13F | Ameritas Advisory Services, LLC | 5 700 | 70 | ||||||
| 2025-08-13 | 13F | Natixis | 3 381 | −33,16 | 41 | −34,92 | ||||
| 2025-08-28 | NP | YYY - Amplify High Income ETF | 439 670 | 1,99 | 5 382 | −0,99 | ||||
| 2025-05-15 | 13F | Talon Private Wealth, LLC | 0 | −100,00 | 0 | −100,00 | ||||
| 2025-08-13 | 13F | Fort Sheridan Advisors Llc | 97 442 | −29,09 | 1 193 | −31,18 | ||||
| 2025-07-14 | 13F | Armstrong Advisory Group, Inc | 0 | −100,00 | 0 | |||||
| 2025-08-08 | 13F | Larson Financial Group LLC | 1 984 | 0,00 | 24 | −4,00 | ||||
| 2025-08-28 | NP | FFBYX - First Foundation Fixed Income Fund Class Y | 9 193 | 0,00 | 113 | −2,61 | ||||
| 2025-08-15 | 13F | Captrust Financial Advisors | 39 056 | 478 | ||||||
| 2025-05-12 | 13F | Fmr Llc | 0 | −100,00 | 0 | |||||
| 2025-07-15 | 13F | Fifth Third Bancorp | 173 | 0,00 | 2 | 0,00 | ||||
| 2025-05-05 | 13F | Transce3nd, LLC | 0 | −100,00 | 0 | |||||
| 2025-07-21 | 13F | Ameriflex Group, Inc. | 1 437 | 1,84 | 18 | 0,00 | ||||
| 2025-08-14 | 13F | Balyasny Asset Management Llc | 21 016 | 257 | ||||||
| 2025-07-18 | 13F | Parkside Investments, LLC | 0 | −100,00 | 0 | |||||
| 2025-07-18 | 13F | PFG Investments, LLC | 13 874 | 18,21 | 170 | 14,19 | ||||
| 2025-07-15 | 13F | Financial Management Professionals, Inc. | 1 686 | 2,74 | 21 | 0,00 | ||||
| 2025-08-14 | 13F | Pinnacle Family Advisors, LLC | 10 334 | 126 | ||||||
| 2025-08-01 | 13F | Transcend Wealth Collective, Llc | 0 | −100,00 | 0 | |||||
| 2025-08-06 | 13F | North Capital, Inc. | 360 | 0,00 | 4 | 0,00 | ||||
| 2025-08-05 | 13F | Intellectus Partners, LLC | 442 278 | −1,27 | 5 413 | −4,16 | ||||
| 2025-08-04 | 13F | Kovack Advisors, Inc. | 15 700 | 16,64 | 192 | 13,61 | ||||
| 2025-08-14 | 13F | CoreCap Advisors, LLC | 2 950 | 68,57 | 36 | 63,64 | ||||
| 2025-04-16 | 13F | Fortitude Family Office, LLC | 0 | −100,00 | 0 | −100,00 | ||||
| 2025-08-19 | 13F | National Asset Management, Inc. | 0 | −100,00 | 0 | |||||
| 2025-08-14 | 13F | Warren Averett Asset Management, LLC | 0 | −100,00 | 0 | |||||
| 2025-07-25 | 13F | We Are One Seven, LLC | 59 817 | 732 | ||||||
| 2025-07-31 | 13F | Cambridge Investment Research Advisors, Inc. | 591 707 | −26,76 | 7 | −30,00 | ||||
| 2025-08-05 | 13F | Westside Investment Management, Inc. | 1 000 | 0,00 | 12 | 0,00 | ||||
| 2025-08-05 | 13F | Simplex Trading, Llc | Put | 2 200 | 450,00 | 0 | ||||
| 2025-08-05 | 13F | Simplex Trading, Llc | Call | 14 600 | 40,38 | 0 | ||||
| 2025-08-13 | 13F | Lido Advisors, LLC | 14 303 | 30,39 | 175 | 26,81 | ||||
| 2025-08-18 | 13F | Geneos Wealth Management Inc. | 2 670 | 0,00 | 33 | −3,03 | ||||
| 2025-08-06 | 13F | Wedbush Securities Inc | 72 385 | −2,66 | 1 | |||||
| 2025-05-15 | 13F | Prospera Financial Services Inc | 0 | −100,00 | 0 | |||||
| 2025-08-08 | 13F | Fiera Capital Corp | 83 264 | −0,93 | 1 019 | −3,78 | ||||
| 2025-07-10 | 13F | Sovran Advisors, LLC | 86 918 | −3,64 | 1 055 | 0,19 | ||||
| 2025-05-16 | 13F | Coppell Advisory Solutions LLC | 0 | −100,00 | 0 | |||||
| 2025-08-14 | 13F | Royal Bank Of Canada | 607 965 | 3,18 | 7 441 | 0,13 | ||||
| 2025-07-11 | 13F | Bell Bank | 13 656 | 0,00 | 167 | −2,91 | ||||
| 2025-09-04 | 13F/A | Advisor Group Holdings, Inc. | 144 406 | 1,30 | 1 768 | −1,67 | ||||
| 2025-07-24 | 13F | IFP Advisors, Inc | 499 | 110,55 | 6 | 200,00 | ||||
| 2025-08-14 | 13F | Citadel Advisors Llc | Call | 18 600 | 1 228,57 | 228 | 1 235,29 | |||
| 2025-08-14 | 13F | Citadel Advisors Llc | 15 839 | 303,75 | 194 | 293,88 | ||||
| 2025-06-12 | 13F/A | Deutsche Bank Ag\ | 0 | −100,00 | 0 | |||||
| 2025-08-08 | 13F | Cetera Investment Advisers | 223 740 | 4,72 | 2 739 | 1,63 | ||||
| 2025-05-09 | 13F | NewEdge Wealth, LLC | 0 | −100,00 | 0 | |||||
| 2025-08-14 | 13F | Arete Wealth Advisors, LLC | 17 814 | −23,21 | 0 | |||||
| 2025-05-14 | 13F | Van Hulzen Asset Management, LLC | 0 | −100,00 | 0 | |||||
| 2025-05-15 | 13F | Concorde Asset Management, LLC | 26 600 | 3,91 | 314 | −2,18 | ||||
| 2025-08-07 | 13F | Readystate Asset Management Lp | 81 169 | 304,17 | 994 | 292,49 |