Grundläggande statistik
| Institutionella ägare | 164 total, 164 long only, 0 short only, 0 long/short - change of −4,07% MRQ |
| Genomsnittlig portföljallokering | 0.1232 % - change of −8,22% MRQ |
| Institutionella aktier (lång) | 32 658 930 (ex 13D/G) - change of −0,30MM shares −0,91% MRQ |
| Institutionellt värde (lång) | $ 433 203 USD ($1000) |
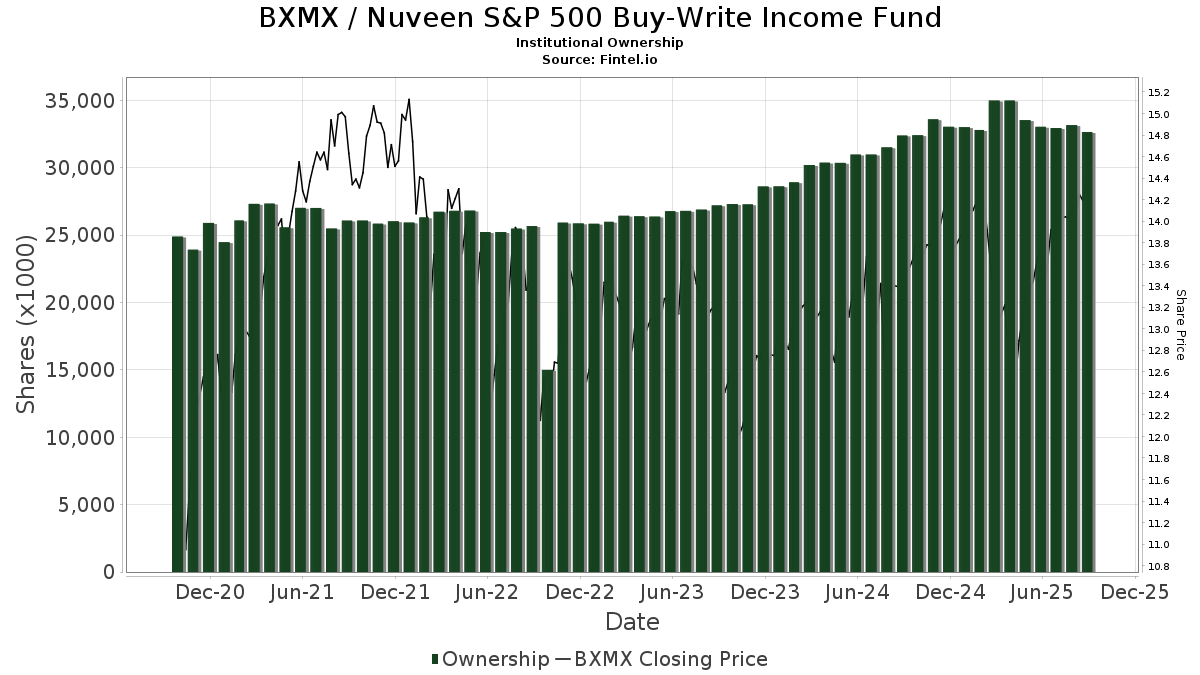
Institutionellt ägande och aktieägare
Nuveen S&P 500 Buy-Write Income Fund (US:BXMX) har 164 Institutionella ägare och aktieägare som har lämnat in 13D/G- eller 13F-formulär till Securities Exchange Commission (SEC). Dessa institut innehar totalt 32,658,930 aktier. Största aktieägare inkluderar Morgan Stanley, Wells Fargo & Company/mn, LPL Financial LLC, Invesco Ltd., UBS Group AG, PCEF - Invesco CEF Income Composite ETF, Raymond James Financial Inc, Advisors Asset Management, Inc., Allspring Global Investments Holdings, LLC, and Bank Of America Corp /de/ .
Nuveen S&P 500 Buy-Write Income Fund (NYSE:BXMX) Institutionell ägarstruktur visar institutioners och fonders nuvarande positioner i företaget, samt de senaste förändringarna i positionernas storlek. Större aktieägare kan vara enskilda investerare, fonder, hedgefonder eller institutioner. Bilaga 13D visar att investeraren äger (eller ägde) mer än 5% av företaget och avser (eller avsåg) att aktivt eftersträva en förändring av affärsstrategin. Schedule 13G indikerar en passiv investering på över 5%.
The share price as of September 9, 2025 is 14,34 / share. Previously, on September 10, 2024, the share price was 13,40 / share. This represents an increase of 7,01% over that period.
Fondsentimentets poäng
Fondsentimentet poängen(fka Ägarackumulation-poäng) visar vilka aktier som är mest köpta av fonder. Det är resultatet av en sofistikerad kvantitativ flerfaktormodell som identifierar företag med de högsta nivåerna av institutionell ackumulering. Poängsättningsmodellen använder en kombination av den totala ökningen av redovisade ägare, förändringarna i portföljallokeringarna för dessa ägare och andra mått. Siffran sträcker sig från 0 till 100, där högre siffror indikerar en högre nivå av ackumulering i förhållande till sina konkurrenter, och 50 är genomsnittet.
Uppdateringsfrekvens: Dagligen
Se Ownership Explorer, som innehåller en lista över de högst rankade företagen.
Institutionell sälj/köp-kvot
Förutom att rapportera vanliga eget kapital- och skuldemissioner måste institutioner med mer än 100MM tillgångar under förvaltning också avslöja sina innehav av sälj- och köpoptioner. Eftersom säljoptioner i allmänhet indikerar ett negativt sentiment och köpoptioner indikerar ett positivt sentiment, kan vi få en uppfattning om det övergripande institutionella sentimentet genom att plotta förhållandet mellan säljoptioner och köpoptioner. Diagrammet till höger visar det historiska förhållandet mellan sälj- och köpoptioner för detta instrument.
Genom att använda sälj/köp-kvoten som en indikator på aktieägarnas sentiment undviker man en av de största bristerna med att använda det totala institutionella ägandet, nämligen att en betydande del av de förvaltade tillgångarna investeras passivt för att följa index. Passivt förvaltade fonder köper vanligtvis inte optioner, så indikatorn för sälj/köp-kvoten ger en bättre bild av stämningen i aktivt förvaltade fonder.
13F- och NPORT-arkiveringar
Detaljer om 13F-arkiveringar är gratis. Detaljer om NP-arkiveringar kräver ett premiummedlemskap. Gröna rader indikerar nya positioner. Röda rader indikerar stängda positioner. Klicka på länk symbolen för att se hela transaktionshistoriken.
Uppgradera
för att låsa upp premiumdata och exportera till Excel ![]() .
.
| Fil Datum | Källa | Investerare | Typ | Genomsnittligt pris (beräknat) |
Aktier | Δ Aktier (%) |
Rapporterat värde (1000 USD) |
Δ Värde (%) |
Portföljallokering (%) |
|
|---|---|---|---|---|---|---|---|---|---|---|
| 2025-07-15 | 13F | World Equity Group, Inc. | 26 750 | 102,65 | 371 | 114,45 | ||||
| 2025-07-10 | 13F | Oliver Lagore Vanvalin Investment Group | 9 597 | 0,00 | 126 | −6,72 | ||||
| 2025-08-14 | 13F | Hilltop Holdings Inc. | 39 598 | −11,90 | 550 | −6,79 | ||||
| 2025-08-18 | 13F | Hollencrest Capital Management | 8 609 | 0,00 | 119 | 6,25 | ||||
| 2025-07-16 | 13F | Signaturefd, Llc | 2 511 | 35 | ||||||
| 2025-08-14 | 13F | Polar Asset Management Partners Inc. | 156 696 | 2 175 | ||||||
| 2025-07-16 | 13F | Twelve Points Wealth Management LLC | 432 690 | 4,27 | 6 006 | 10,30 | ||||
| 2025-08-12 | 13F | Wealth Dimensions Group, Ltd. | 10 943 | −10,69 | 152 | −5,62 | ||||
| 2025-07-24 | 13F | IFP Advisors, Inc | 5 200 | −7,14 | 72 | −1,37 | ||||
| 2025-07-29 | 13F | International Assets Investment Management, Llc | 47 367 | 10,33 | 657 | 16,70 | ||||
| 2025-08-14 | 13F | GWM Advisors LLC | 87 831 | 102,31 | 1 219 | 114,24 | ||||
| 2025-08-11 | 13F | Delta Asset Management Llc/tn | 1 800 | 0,00 | 25 | 4,35 | ||||
| 2025-03-12 | 13F/A | Private Capital Management Llc | 0 | −100,00 | 0 | |||||
| 2025-08-12 | 13F | Advisors Asset Management, Inc. | 927 730 | 18,19 | 12 877 | 25,03 | ||||
| 2025-08-07 | 13F | BOK Financial Private Wealth, Inc. | 1 957 | 0,00 | 28 | 3,85 | ||||
| 2025-08-14 | 13F | Apriem Advisors | 17 968 | 0,00 | 249 | 5,96 | ||||
| 2025-07-17 | 13F | Janney Montgomery Scott LLC | 269 380 | 27,32 | 4 | 50,00 | ||||
| 2025-08-06 | 13F | Maltin Wealth Management, Inc. | 18 291 | 1,72 | 254 | 7,66 | ||||
| 2025-07-25 | 13F | Hazlett, Burt & Watson, Inc. | 7 594 | −21,89 | 0 | |||||
| 2025-07-23 | 13F | Joel Isaacson & Co., LLC | 0 | −100,00 | 0 | |||||
| 2025-07-24 | 13F | Costello Asset Management, INC | 100 | 0,00 | 1 | 0,00 | ||||
| 2025-08-14 | 13F | Mml Investors Services, Llc | 17 905 | 5,32 | 0 | |||||
| 2025-08-07 | 13F | Readystate Asset Management Lp | 0 | −100,00 | 0 | |||||
| 2025-08-08 | 13F | Cornerstone Advisors, LLC | 380 684 | −45,66 | 5 284 | −42,52 | ||||
| 2025-08-13 | 13F | StoneX Group Inc. | 26 437 | −20,26 | 373 | −16,03 | ||||
| 2025-07-25 | 13F | Cwm, Llc | 1 748 | 0,00 | 0 | |||||
| 2025-07-08 | 13F | Nbc Securities, Inc. | 28 864 | −0,71 | 0 | |||||
| 2025-07-17 | 13F | Venture Visionary Partners LLC | 52 681 | −3,03 | 731 | 2,67 | ||||
| 2025-08-14 | 13F | Wiley Bros.-aintree Capital, Llc | 87 808 | 67,66 | 1 219 | 78,59 | ||||
| 2025-07-29 | 13F | Hoese & Co LLP | 875 | −50,00 | 12 | −45,45 | ||||
| 2025-08-01 | 13F | Envestnet Asset Management Inc | 167 022 | −4,50 | 2 318 | 1,05 | ||||
| 2025-08-13 | 13F | Kayne Anderson Rudnick Investment Management Llc | 465 | 0,00 | 6 | 0,00 | ||||
| 2025-08-12 | 13F | Steward Partners Investment Advisory, Llc | 50 446 | 1,03 | 700 | 6,87 | ||||
| 2025-08-14 | 13F | Two Sigma Investments, Lp | 169 380 | 2 351 | ||||||
| 2025-08-13 | 13F | Global Endowment Management, LP | 0 | −100,00 | 0 | |||||
| 2025-05-08 | 13F | Plante Moran Financial Advisors, LLC | 0 | −100,00 | 0 | |||||
| 2025-04-29 | 13F | Pensionmark Financial Group, Llc | 0 | −100,00 | 0 | |||||
| 2025-08-12 | 13F | LPL Financial LLC | 1 629 051 | 0,85 | 22 611 | 6,69 | ||||
| 2025-08-12 | 13F | Proequities, Inc. | 0 | 0 | ||||||
| 2025-08-07 | 13F | Hennion & Walsh Asset Management, Inc. | 104 200 | 99,24 | 1 446 | 110,79 | ||||
| 2025-08-14 | 13F | Royal Bank Of Canada | 479 512 | −3,25 | 6 656 | 2,37 | ||||
| 2025-08-12 | 13F | Pathstone Holdings, LLC | 17 537 | 0,00 | 243 | 5,65 | ||||
| 2025-08-15 | 13F | Kestra Advisory Services, LLC | 74 671 | 11,09 | 1 036 | 17,59 | ||||
| 2025-08-04 | 13F | Carret Asset Management, Llc | 10 000 | 0,00 | 139 | 5,34 | ||||
| 2025-08-15 | 13F | Captrust Financial Advisors | 15 769 | 219 | ||||||
| 2025-08-13 | 13F | Invesco Ltd. | 1 507 507 | −0,41 | 20 924 | 5,36 | ||||
| 2025-07-15 | 13F | Bay Capital Advisors, LLC | 15 950 | 0,00 | 221 | 5,74 | ||||
| 2025-08-15 | 13F | Puff Wealth Management, Llc | 81 552 | 3,15 | 1 132 | 9,06 | ||||
| 2025-08-12 | 13F | Wood Tarver Financial Group, LLC | 21 | 0,00 | 0 | |||||
| 2025-07-25 | 13F | Northwest Capital Management Inc | 978 | 0,00 | 14 | 8,33 | ||||
| 2025-07-31 | 13F | Cambridge Investment Research Advisors, Inc. | 567 331 | 1,63 | 8 | 0,00 | ||||
| 2025-07-25 | 13F | Stephens Consulting, LLC | 0 | −100,00 | 0 | |||||
| 2025-05-12 | 13F | Independent Advisor Alliance | 0 | −100,00 | 0 | −100,00 | ||||
| 2025-08-07 | 13F | Kestra Private Wealth Services, Llc | 18 292 | 5,02 | 254 | 10,96 | ||||
| 2025-08-14 | 13F | Wells Fargo & Company/mn | 1 689 550 | 1,44 | 23 451 | 7,32 | ||||
| 2025-07-28 | 13F | BRYN MAWR TRUST Co | 504 | 0,00 | 7 | 0,00 | ||||
| 2025-03-11 | 13F/A | Elequin Capital Lp | 0 | −100,00 | 0 | |||||
| 2025-07-14 | 13F | Matrix Trust Co | 57 855 | 0,67 | 1 | |||||
| 2025-07-09 | 13F | Triumph Capital Management | 17 432 | 0,00 | 242 | 5,70 | ||||
| 2025-05-15 | 13F | Talon Private Wealth, LLC | 0 | −100,00 | 0 | −100,00 | ||||
| 2025-05-05 | 13F | Lindbrook Capital, Llc | 690 062 | 0,00 | 9 054 | −6,22 | ||||
| 2025-07-14 | 13F | Park Avenue Securities Llc | 122 039 | −4,13 | 2 | 0,00 | ||||
| 2025-08-11 | 13F | Blue Bell Private Wealth Management, Llc | 5 680 | 2,64 | 79 | 8,33 | ||||
| 2025-08-06 | 13F | Commonwealth Equity Services, Llc | 327 849 | −6,20 | 5 | 0,00 | ||||
| 2025-08-07 | 13F | Commerce Bank | 15 819 | 0,00 | 220 | 5,80 | ||||
| 2025-05-06 | 13F | MCF Advisors LLC | 0 | −100,00 | 0 | |||||
| 2025-08-05 | 13F | Bank of New York Mellon Corp | 12 762 | 8,09 | 177 | 14,94 | ||||
| 2025-08-14 | 13F | Susquehanna International Group, Llp | 0 | −100,00 | 0 | |||||
| 2025-07-21 | 13F | Ameritas Advisory Services, LLC | 3 090 | 43 | ||||||
| 2025-08-12 | 13F | Landscape Capital Management, L.l.c. | 0 | −100,00 | 0 | |||||
| 2025-05-08 | 13F | Private Advisory Group LLC | 0 | −100,00 | 0 | |||||
| 2025-08-11 | 13F | Rothschild Investment Llc | 693 | 0,00 | 10 | 0,00 | ||||
| 2025-08-14 | 13F | Atomi Financial Group, Inc. | 77 062 | −5,89 | 1 070 | −0,47 | ||||
| 2025-08-11 | 13F | Citigroup Inc | 2 650 | 0,00 | 37 | 5,88 | ||||
| 2025-08-27 | NP | RYDEX VARIABLE TRUST - Multi-Hedge Strategies Fund Variable Annuity | 230 | −19,30 | 3 | 0,00 | ||||
| 2025-07-15 | 13F | Focused Wealth Management, Inc | 333 887 | 1,57 | 4 634 | 7,47 | ||||
| 2025-08-05 | 13F | Key FInancial Inc | 37 | 0,00 | 1 | |||||
| 2025-07-24 | 13F | Leo Wealth, LLC | 34 991 | 0,00 | 486 | 5,66 | ||||
| 2025-08-14 | 13F | Mariner, LLC | 16 381 | 12,93 | 227 | 19,47 | ||||
| 2025-08-19 | 13F | Newbridge Financial Services Group, Inc. | 1 061 | 15 | ||||||
| 2025-04-15 | 13F | Fiduciary Financial Group, Llc | 0 | −100,00 | 0 | |||||
| 2025-07-28 | NP | PCEF - Invesco CEF Income Composite ETF This fund is a listed as child fund of Invesco Ltd. and if that institution has disclosed ownership in this security, then these positions will not be double counted when calculating total shares and total value | 1 465 087 | −0,51 | 19 735 | −3,24 | ||||
| 2025-08-13 | 13F | Rsm Us Wealth Management Llc | 17 671 | −0,82 | 250 | 5,04 | ||||
| 2025-05-06 | 13F | Venturi Wealth Management, LLC | 0 | −100,00 | 0 | |||||
| 2025-07-22 | 13F | DAVENPORT & Co LLC | 13 927 | 0,00 | 193 | 6,04 | ||||
| 2025-07-30 | 13F | D.a. Davidson & Co. | 48 594 | 0,70 | 674 | 6,48 | ||||
| 2025-08-14 | 13F | UBS Group AG | 1 488 300 | −4,04 | 20 658 | 1,52 | ||||
| 2025-08-04 | 13F | Spire Wealth Management | 37 364 | 10,23 | 519 | 16,67 | ||||
| 2025-08-08 | 13F | Avantax Advisory Services, Inc. | 22 147 | 18,73 | 307 | 25,82 | ||||
| 2025-08-05 | 13F | Prosperity Wealth Management, Inc. | 123 745 | 1,21 | 1 718 | 7,04 | ||||
| 2025-08-06 | 13F | Marco Investment Management Llc | 27 300 | 0,00 | 379 | 5,59 | ||||
| 2025-08-12 | 13F | Founders Financial Alliance, LLC | 12 908 | −0,20 | 179 | 5,92 | ||||
| 2025-08-14 | 13F | Kovitz Investment Group Partners, LLC | 105 731 | 39,30 | 1 468 | 47,54 | ||||
| 2025-08-14 | 13F | Bank Of America Corp /de/ | 823 947 | 2,94 | 11 436 | 8,90 | ||||
| 2025-08-12 | 13F | Armor Investment Advisors, LLC | 19 673 | −0,07 | 273 | 5,81 | ||||
| 2025-07-28 | 13F | Harbour Investments, Inc. | 1 825 | 25 | ||||||
| 2025-08-19 | 13F | National Asset Management, Inc. | 31 119 | −70,37 | 432 | −70,66 | ||||
| 2025-07-29 | 13F | Private Trust Co Na | 2 000 | −12,78 | 28 | −10,00 | ||||
| 2025-07-25 | 13F | Allspring Global Investments Holdings, LLC | 905 057 | 42,10 | 12 562 | 50,34 | ||||
| 2025-07-14 | 13F | Farmers & Merchants Investments Inc | 1 850 | 0,00 | 26 | 4,17 | ||||
| 2025-08-14 | 13F | NCP Inc. | 127 332 | 0,82 | 1 767 | 6,64 | ||||
| 2025-07-29 | 13F | Sims Investment Management, Llc | 60 100 | 0,00 | 834 | 5,84 | ||||
| 2025-08-14 | 13F | Glen Eagle Advisors, LLC | 15 970 | −21,96 | 222 | −17,54 | ||||
| 2025-08-14 | 13F | Cnh Partners Llc | 361 193 | −23,44 | 4 992 | −18,61 | ||||
| 2025-08-13 | 13F | Baird Financial Group, Inc. | 29 808 | −4,34 | 414 | 1,23 | ||||
| 2025-08-05 | 13F | Shaker Financial Services, LLC | 77 595 | −62,94 | 1 106 | −60,77 | ||||
| 2025-08-13 | 13F | Colonial Trust Co / SC | 254 | 0,00 | 3 | 0,00 | ||||
| 2025-08-04 | 13F | Horizon Wealth Management, LLC | 11 660 | 0,00 | 162 | 5,92 | ||||
| 2025-07-16 | 13F | St Germain D J Co Inc | 187 | 0,00 | 3 | 0,00 | ||||
| 2025-08-13 | 13F | Colonial Trust Advisors | 2 200 | 31 | ||||||
| 2025-08-27 | NP | RYMSX - Guggenheim Multi-Hedge Strategies Fund Class P | 137 | −37,44 | 2 | −50,00 | ||||
| 2025-08-11 | 13F | Annis Gardner Whiting Capital Advisors, LLC | 3 000 | 0,00 | 42 | 5,13 | ||||
| 2025-08-12 | 13F | CIBC Private Wealth Group, LLC | 33 | 0,00 | 0 | |||||
| 2025-08-18 | 13F | Arq Wealth Advisors, Llc | 0 | −100,00 | 0 | |||||
| 2025-08-05 | 13F | Sage Capital Management, LLC | 255 095 | 2,35 | 3 541 | 8,26 | ||||
| 2025-08-12 | 13F | Coldstream Capital Management Inc | 0 | −100,00 | 0 | |||||
| 2025-08-06 | 13F | SOUTH STATE Corp | 978 | 0,00 | 14 | 8,33 | ||||
| 2025-07-25 | 13F | Integrated Capital Management, Inc. | 23 069 | 2,70 | 320 | 8,84 | ||||
| 2025-08-11 | 13F | Nations Financial Group Inc, /ia/ /adv | 20 877 | −6,92 | 290 | −1,70 | ||||
| 2025-08-14 | 13F | Wealth Preservation Advisors, LLC | 7 655 | 0,00 | 106 | 6,00 | ||||
| 2025-08-05 | 13F | Huntington National Bank | 35 | 0,00 | ||||||
| 2025-07-15 | 13F | Financial Management Professionals, Inc. | 314 | 0,00 | 4 | 0,00 | ||||
| 2025-08-04 | 13F | Kovack Advisors, Inc. | 12 778 | −3,77 | 177 | 1,72 | ||||
| 2025-04-22 | 13F | Castleview Partners, Llc | 0 | −100,00 | 0 | |||||
| 2025-07-24 | 13F | Us Bancorp \de\ | 5 000 | 0,00 | 69 | 6,15 | ||||
| 2025-07-18 | 13F | Truist Financial Corp | 41 249 | −0,07 | 573 | 5,73 | ||||
| 2025-07-07 | 13F | Bangor Savings Bank | 1 057 | −45,99 | 15 | −44,00 | ||||
| 2025-08-13 | 13F | Summit Financial, LLC | 26 414 | 116,45 | 373 | 133,13 | ||||
| 2025-08-06 | 13F | Prospera Financial Services Inc | 100 783 | 1,49 | 1 399 | 7,37 | ||||
| 2025-07-08 | 13F | Apella Capital, LLC | 15 035 | 0,00 | 209 | 8,33 | ||||
| 2025-07-21 | 13F | Pflug Koory, LLC | 33 682 | 0,00 | 468 | 5,90 | ||||
| 2025-07-17 | 13F | Jackson, Grant Investment Advisers, Inc. | 31 103 | 1,49 | 432 | 7,21 | ||||
| 2025-08-14 | 13F | Ameriprise Financial Inc | 313 236 | −21,45 | 4 334 | −17,17 | ||||
| 2025-08-20 | NP | ADANX - AQR Diversified Arbitrage Fund Class N | 119 046 | −13,55 | 1 652 | −8,53 | ||||
| 2025-08-06 | 13F | Moors & Cabot, Inc. | 73 052 | −44,65 | 1 014 | −41,48 | ||||
| 2025-08-08 | 13F | Cetera Investment Advisers | 153 547 | 8,89 | 2 131 | 15,19 | ||||
| 2025-08-18 | 13F | Geneos Wealth Management Inc. | 9 252 | −1,76 | 128 | 4,07 | ||||
| 2025-07-08 | 13F | Arlington Trust Co LLC | 6 000 | 0,00 | 83 | 6,41 | ||||
| 2025-07-23 | 13F | Tyche Wealth Partners LLC | 25 640 | 0,07 | 356 | 5,65 | ||||
| 2025-08-14 | 13F | CoreFirst Bank & Trust | 930 | 13 | ||||||
| 2025-08-22 | NP | Cornerstone Total Return Fund Inc | 87 486 | −63,05 | 1 214 | −60,91 | ||||
| 2025-07-16 | 13F | Encompass Wealth Advisors, Llc | 14 207 | −37,20 | 197 | −33,45 | ||||
| 2025-04-23 | 13F | Continuum Advisory, LLC | 0 | −100,00 | 0 | |||||
| 2025-08-13 | 13F | Northwestern Mutual Wealth Management Co | 47 387 | 3,15 | 658 | 9,14 | ||||
| 2025-05-15 | 13F | Gwn Securities Inc. | 0 | −100,00 | 0 | |||||
| 2025-08-14 | 13F | Raymond James Financial Inc | 951 409 | −0,65 | 13 206 | 5,11 | ||||
| 2025-08-07 | 13F | Allworth Financial LP | 36 858 | 244,79 | 512 | 278,52 | ||||
| 2025-08-11 | 13F | HighTower Advisors, LLC | 37 334 | −13,43 | 518 | −8,32 | ||||
| 2025-07-07 | 13F | Centurion Wealth Management LLC | 12 318 | 0,00 | 171 | −1,16 | ||||
| 2025-07-10 | 13F | Global Financial Private Client, LLC | 0 | −100,00 | 0 | |||||
| 2025-07-29 | 13F | Commons Capital, Llc | 15 127 | 1,34 | 210 | 7,18 | ||||
| 2025-07-24 | 13F | Eastern Bank | 2 199 | 0,00 | 31 | 7,14 | ||||
| 2025-08-11 | 13F | Alteri Wealth LLC | 47 955 | 10,48 | 666 | 16,87 | ||||
| 2025-06-04 | 13F | Pvg Asset Management Corp | 0 | −100,00 | 0 | |||||
| 2025-07-01 | 13F | Harbor Investment Advisory, Llc | 2 468 | 0,00 | 34 | 6,25 | ||||
| 2025-07-25 | 13F | Atria Wealth Solutions, Inc. | 14 914 | −69,25 | 211 | −67,34 | ||||
| 2025-07-21 | 13F | Patriot Financial Group Insurance Agency, LLC | 27 630 | 0,93 | 384 | 6,69 | ||||
| 2025-08-08 | 13F | Pnc Financial Services Group, Inc. | 32 256 | 29,21 | 448 | 36,70 | ||||
| 2025-05-14 | 13F | ICONIQ Capital, LLC | 0 | −100,00 | 0 | |||||
| 2025-07-16 | 13F | Investment Partners Asset Management, Inc. | 37 219 | −0,24 | 517 | 5,52 | ||||
| 2025-08-08 | 13F | Fortis Group Advisors, LLC | 250 | 0,00 | 3 | 0,00 | ||||
| 2025-08-14 | 13F/A | Rockefeller Capital Management L.P. | 34 524 | 1,75 | 479 | 7,64 | ||||
| 2025-04-25 | 13F | Smallwood Wealth Investment Management, LLC | 4 027 | 53 | ||||||
| 2025-08-13 | 13F | MONECO Advisors, LLC | 257 967 | −2,18 | 3 581 | 3,50 | ||||
| 2025-08-12 | 13F | Bokf, Na | 0 | −100,00 | 0 | |||||
| 2025-08-12 | 13F | Richmond Investment Services, LLC | 114 171 | 95,73 | 1 585 | 107,06 | ||||
| 2025-05-08 | 13F | Essential Planning, LLC. | 0 | −100,00 | 0 | |||||
| 2025-05-07 | 13F | Sheaff Brock Investment Advisors, LLC | 13 188 | −0,08 | 173 | −5,98 | ||||
| 2025-09-04 | 13F/A | Advisor Group Holdings, Inc. | 380 959 | 3,05 | 5 288 | 9,03 | ||||
| 2025-08-14 | 13F | Quantedge Capital Pte Ltd | 0 | −100,00 | 0 | |||||
| 2025-07-18 | 13F | TPG Advisors LLC | 138 713 | −0,49 | 1 925 | 5,31 | ||||
| 2025-08-05 | 13F | Palogic Value Management, L.P. | 21 371 | −2,29 | 297 | 3,50 | ||||
| 2025-05-06 | 13F | Atria Investments Llc | 0 | −100,00 | 0 | |||||
| 2025-07-15 | 13F | Shulman DeMeo Asset Management LLC | 96 095 | −0,12 | 1 334 | 5,63 | ||||
| 2025-07-11 | 13F | Pinnacle Bancorp, Inc. | 2 895 | 40 | ||||||
| 2025-08-08 | 13F | Creative Planning | 0 | −100,00 | 0 | |||||
| 2025-08-11 | 13F | WPG Advisers, LLC | 683 | −35,63 | 9 | −30,77 | ||||
| 2025-08-13 | 13F | Green Harvest Asset Management LLC | 15 760 | 0,00 | 219 | 5,83 | ||||
| 2025-08-08 | 13F | Islay Capital Management, Llc | 76 317 | −4,91 | 1 059 | 0,67 | ||||
| 2025-08-14 | 13F | Comerica Bank | 92 866 | 3,05 | 1 289 | 8,97 | ||||
| 2025-08-14 | 13F | CoreCap Advisors, LLC | 20 656 | 55,19 | 287 | 64,37 | ||||
| 2025-06-12 | 13F/A | Deutsche Bank Ag\ | 0 | −100,00 | 0 | |||||
| 2025-08-14 | 13F | Great Valley Advisor Group, Inc. | 0 | −100,00 | 0 | |||||
| 2025-08-14 | 13F | Wetherby Asset Management Inc | 26 302 | 109,85 | 365 | 108,57 | ||||
| 2025-04-16 | 13F | Fortitude Family Office, LLC | 0 | −100,00 | 0 | |||||
| 2025-08-12 | 13F | Jpmorgan Chase & Co | 2 528 | 4,08 | 35 | 12,90 | ||||
| 2025-08-13 | 13F | Guggenheim Capital Llc | 723 627 | 8,17 | 10 044 | 14,44 | ||||
| 2025-05-02 | 13F | Legacy Capital Wealth Partners, LLC | 0 | −100,00 | 0 | −100,00 | ||||
| 2025-08-14 | 13F | Stifel Financial Corp | 302 608 | 7,54 | 4 200 | 13,79 | ||||
| 2025-07-30 | 13F | FNY Investment Advisers, LLC | 5 000 | 0,00 | 0 | |||||
| 2025-08-14 | 13F | Jane Street Group, Llc | 0 | −100,00 | 0 | |||||
| 2025-08-15 | 13F | Morgan Stanley | 11 835 003 | 2,03 | 164 270 | 7,94 | ||||
| 2025-08-04 | 13F | Wolverine Asset Management Llc | 0 | −100,00 | 0 | |||||
| 2025-07-16 | 13F | Instrumental Wealth, Llc | 25 251 | 5,92 | 353 | 15,41 | ||||
| 2025-08-14 | 13F | Colony Group, LLC | 30 143 | 21,39 | 418 | 28,62 | ||||
| 2025-07-30 | 13F | Patten Group, Inc. | 58 215 | −0,73 | 808 | 5,07 | ||||
| 2025-07-31 | 13F | Blake Schutter Theil Wealth Advisors, LLC | 68 604 | 0,24 | 952 | 6,13 | ||||
| 2025-08-07 | 13F | Clarity Wealth Advisors, LLC | 10 091 | −17,10 | 140 | −11,95 | ||||
| 2025-07-11 | 13F | Farther Finance Advisors, LLC | 3 600 | 380,00 | 50 | 444,44 | ||||
| 2025-07-23 | 13F | Ameliora Wealth Management Ltd. | 200 | 0,00 | 3 | 0,00 | ||||
| 2025-08-22 | NP | Cornerstone Strategic Value Fund Inc | 293 198 | −36,79 | 4 070 | −33,13 |