Grundläggande statistik
| Institutionella ägare | 163 total, 163 long only, 0 short only, 0 long/short - change of 17,99% MRQ |
| Genomsnittlig portföljallokering | 0.4162 % - change of 19,49% MRQ |
| Institutionella aktier (lång) | 41 366 729 (ex 13D/G) - change of 14,21MM shares 52,35% MRQ |
| Institutionellt värde (lång) | $ 952 828 USD ($1000) |
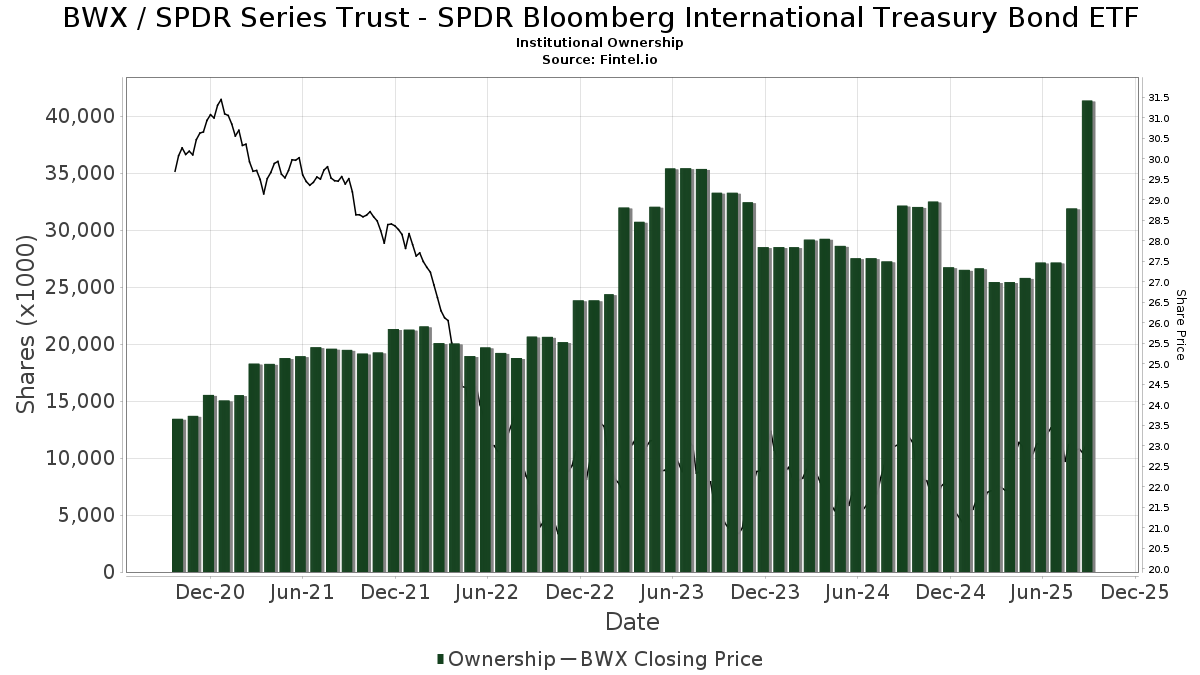
Institutionellt ägande och aktieägare
SPDR Series Trust - SPDR Bloomberg International Treasury Bond ETF (US:BWX) har 163 Institutionella ägare och aktieägare som har lämnat in 13D/G- eller 13F-formulär till Securities Exchange Commission (SEC). Dessa institut innehar totalt 41,366,729 aktier. Största aktieägare inkluderar ARGI Investment Services, LLC, Manufacturers Life Insurance Company, The, Citigroup Inc, Annex Advisory Services, LLC, Morgan Stanley, Checchi Capital Advisers, LLC, State Street Corp, Leuthold Group, Llc, Envestnet Asset Management Inc, and Creative Planning .
SPDR Series Trust - SPDR Bloomberg International Treasury Bond ETF (ARCA:BWX) Institutionell ägarstruktur visar institutioners och fonders nuvarande positioner i företaget, samt de senaste förändringarna i positionernas storlek. Större aktieägare kan vara enskilda investerare, fonder, hedgefonder eller institutioner. Bilaga 13D visar att investeraren äger (eller ägde) mer än 5% av företaget och avser (eller avsåg) att aktivt eftersträva en förändring av affärsstrategin. Schedule 13G indikerar en passiv investering på över 5%.
The share price as of September 19, 2025 is 23,04 / share. Previously, on September 23, 2024, the share price was 23,26 / share. This represents a decline of 0,95% over that period.
Fondsentimentets poäng
Fondsentimentet poängen(fka Ägarackumulation-poäng) visar vilka aktier som är mest köpta av fonder. Det är resultatet av en sofistikerad kvantitativ flerfaktormodell som identifierar företag med de högsta nivåerna av institutionell ackumulering. Poängsättningsmodellen använder en kombination av den totala ökningen av redovisade ägare, förändringarna i portföljallokeringarna för dessa ägare och andra mått. Siffran sträcker sig från 0 till 100, där högre siffror indikerar en högre nivå av ackumulering i förhållande till sina konkurrenter, och 50 är genomsnittet.
Uppdateringsfrekvens: Dagligen
Se Ownership Explorer, som innehåller en lista över de högst rankade företagen.
AI+ Ask Fintel’s AI assistant about SPDR Series Trust - SPDR Bloomberg International Treasury Bond ETF.
Thinking of good questions…
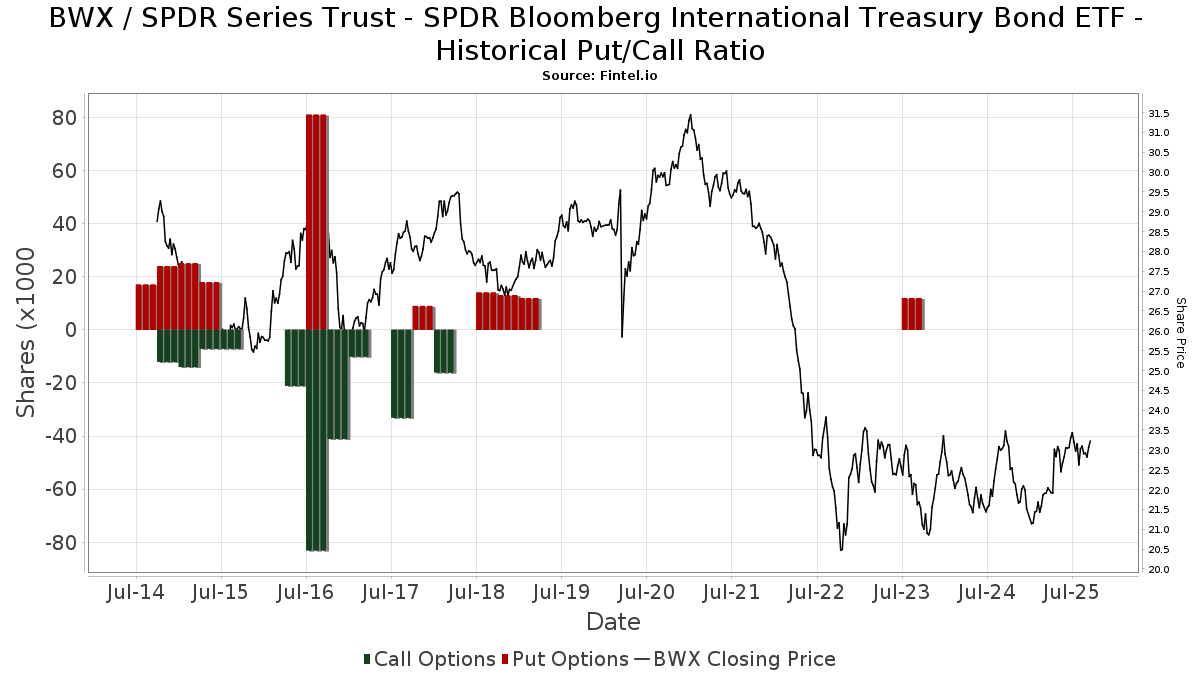
Institutionell sälj/köp-kvot
Förutom att rapportera vanliga eget kapital- och skuldemissioner måste institutioner med mer än 100MM tillgångar under förvaltning också avslöja sina innehav av sälj- och köpoptioner. Eftersom säljoptioner i allmänhet indikerar ett negativt sentiment och köpoptioner indikerar ett positivt sentiment, kan vi få en uppfattning om det övergripande institutionella sentimentet genom att plotta förhållandet mellan säljoptioner och köpoptioner. Diagrammet till höger visar det historiska förhållandet mellan sälj- och köpoptioner för detta instrument.
Genom att använda sälj/köp-kvoten som en indikator på aktieägarnas sentiment undviker man en av de största bristerna med att använda det totala institutionella ägandet, nämligen att en betydande del av de förvaltade tillgångarna investeras passivt för att följa index. Passivt förvaltade fonder köper vanligtvis inte optioner, så indikatorn för sälj/köp-kvoten ger en bättre bild av stämningen i aktivt förvaltade fonder.
13F- och NPORT-arkiveringar
Detaljer om 13F-arkiveringar är gratis. Detaljer om NP-arkiveringar kräver ett premiummedlemskap. Gröna rader indikerar nya positioner. Röda rader indikerar stängda positioner. Klicka på länk symbolen för att se hela transaktionshistoriken.
Uppgradera
för att låsa upp premiumdata och exportera till Excel ![]() .
.
| Fil Datum | Källa | Investerare | Typ | Genomsnittligt pris (beräknat) |
Aktier | Δ Aktier (%) |
Rapporterat värde (1000 USD) |
Δ Värde (%) |
Portföljallokering (%) |
|
|---|---|---|---|---|---|---|---|---|---|---|
| 2025-07-30 | 13F | Legacy Wealth Asset Management, LLC | 29 644 | 0,25 | 696 | 7,74 | ||||
| 2025-08-14 | 13F | Snowden Capital Advisors LLC | 18 364 | −0,01 | 431 | 7,48 | ||||
| 2025-08-26 | NP | LCR - Leuthold Core ETF | 78 256 | −7,14 | 1 838 | −0,22 | ||||
| 2025-07-15 | 13F | Mather Group, Llc. | 0 | −100,00 | 0 | |||||
| 2025-07-25 | 13F | Ackerman Capital Advisors, LLC | 9 869 | −97,54 | 232 | −97,37 | ||||
| 2025-08-04 | 13F | Center for Financial Planning, Inc. | 1 403 | 33 | ||||||
| 2025-08-12 | 13F | Steward Partners Investment Advisory, Llc | 6 319 | −51,81 | 148 | −48,25 | ||||
| 2025-08-28 | NP | SSTIX - State Street Total Return V.I.S. Fund Class 1 Shares | 453 950 | 10 663 | ||||||
| 2025-08-14 | 13F | Ancora Advisors, LLC | 36 | 0,00 | 1 | |||||
| 2025-07-11 | 13F | Pinnacle Bancorp, Inc. | 300 | 0,00 | 7 | 16,67 | ||||
| 2025-08-15 | 13F | Tower Research Capital LLC (TRC) | 7 | 600,00 | 0 | |||||
| 2025-09-04 | 13F | Beacon Capital Management, Inc. | 2 722 | 64 | ||||||
| 2025-07-18 | 13F/A | MJT & Associates Financial Advisory Group, Inc. | 988 | 0,00 | 23 | 9,52 | ||||
| 2025-07-24 | 13F | VanderPol Investments L.L.C. | 53 818 | 1 264 | ||||||
| 2025-08-14 | 13F | Visionary Wealth Advisors | 0 | −100,00 | 0 | |||||
| 2025-05-14 | 13F | Caitlin John, LLC | 0 | −100,00 | 0 | |||||
| 2025-08-14 | 13F | Jane Street Group, Llc | 565 308 | −24,76 | 13 279 | −19,15 | ||||
| 2025-07-24 | 13F | IFP Advisors, Inc | 57 | 0,00 | 1 | 0,00 | ||||
| 2025-07-22 | 13F | Net Worth Advisory Group | 377 753 | 5,89 | 8 873 | 13,79 | ||||
| 2025-07-25 | 13F | Investment Advisory Group, LLC | 0 | −100,00 | 0 | |||||
| 2025-07-28 | 13F | RFG Advisory, LLC | 230 188 | 5 407 | ||||||
| 2025-08-14 | 13F | Stifel Financial Corp | 68 433 | −2,52 | 1 607 | 4,76 | ||||
| 2025-05-14 | 13F | Napa Wealth Management | 0 | −100,00 | 0 | |||||
| 2025-07-31 | 13F | Auour Investments LLC | 72 364 | 2,46 | 1 700 | 4,23 | ||||
| 2025-08-08 | 13F | Creative Planning | 806 718 | −19,13 | 18 950 | −13,11 | ||||
| 2025-05-28 | NP | FISR - SPDR SSGA Fixed Income Sector Rotation ETF This fund is a listed as child fund of State Street Corp and if that institution has disclosed ownership in this security, then these positions will not be double counted when calculating total shares and total value | 726 | −99,89 | 16 | −99,90 | ||||
| 2025-07-14 | 13F | Pacifica Partners Inc. | 45 | 0,00 | 1 | 0,00 | ||||
| 2025-08-13 | 13F | Cerity Partners LLC | 43 673 | 334,43 | 1 026 | 368,04 | ||||
| 2025-07-31 | 13F | FSM Wealth Advisors, LLC | 13 405 | −2,46 | 311 | 3,67 | ||||
| 2025-08-07 | 13F | David R. Rahn & Associates Inc. | 102 231 | −81,04 | 2 401 | −79,63 | ||||
| 2025-08-13 | 13F | Colonial Trust Co / SC | 3 001 | 65,07 | 70 | 79,49 | ||||
| 2025-07-21 | 13F | Ameritas Advisory Services, LLC | 1 322 | 31 | ||||||
| 2025-05-15 | 13F | Mariner, LLC | 0 | −100,00 | 0 | |||||
| 2025-04-23 | 13F | Mascagni Wealth Management, Inc. | 0 | −100,00 | 0 | −100,00 | ||||
| 2025-07-09 | 13F | Breakwater Investment Management | 2 807 | 0,00 | 66 | 6,56 | ||||
| 2025-08-14 | 13F | Fairview Capital Investment Management, Llc | 37 341 | 3,18 | 877 | 10,87 | ||||
| 2025-04-22 | 13F | Castleview Partners, Llc | 0 | −100,00 | 0 | −100,00 | ||||
| 2025-08-07 | 13F | Allworth Financial LP | 1 047 | 681,34 | 25 | 700,00 | ||||
| 2025-08-15 | 13F | Global View Capital Management LLC | 33 315 | 783 | ||||||
| 2025-08-08 | 13F | SBI Securities Co., Ltd. | 1 053 | 0,77 | 25 | 9,09 | ||||
| 2025-07-28 | 13F | Harbour Investments, Inc. | 273 | 950,00 | 6 | |||||
| 2025-08-13 | 13F | Proactive Wealth Strategies LLC | 8 571 | 0 | ||||||
| 2025-08-13 | 13F | Rsm Us Wealth Management Llc | 19 415 | 456 | ||||||
| 2025-08-14 | 13F | Smartleaf Asset Management LLC | 9 192 | 2 275,19 | 215 | 2 575,00 | ||||
| 2025-05-08 | 13F | Altiora Financial Group, LLC | 0 | −100,00 | 0 | |||||
| 2025-08-14 | 13F | Financial Engines Advisors L.L.C. | 403 152 | −1,65 | 9 470 | 5,68 | ||||
| 2025-07-31 | 13F | Brinker Capital Investments, LLC | 0 | −100,00 | 0 | −100,00 | ||||
| 2025-07-17 | 13F | Wolff Wiese Magana Llc | 127 | 0,00 | 3 | 0,00 | ||||
| 2025-04-14 | 13F | Strategic Wealth Designers | 0 | −100,00 | 0 | −100,00 | ||||
| 2025-07-31 | 13F | United Community Bank | 5 959 | 25,29 | 140 | 34,95 | ||||
| 2025-08-13 | 13F | ARGI Investment Services, LLC | 7 984 272 | 58,59 | 187 551 | 70,42 | ||||
| 2025-07-11 | 13F | Farther Finance Advisors, LLC | 518 | 0,00 | 12 | 9,09 | ||||
| 2025-07-24 | 13F | Forefront Analytics, LLC | 88 982 | 2 089 | ||||||
| 2025-08-13 | 13F | Johnson Financial Group, Inc. | 2 427 | 1,12 | 57 | 9,62 | ||||
| 2025-04-22 | 13F | Synergy Financial Management, LLC | 0 | −100,00 | 0 | |||||
| 2025-08-14 | 13F | Ameriprise Financial Inc | 257 513 | 21,47 | 6 049 | 30,51 | ||||
| 2025-08-26 | NP | LCORX - Leuthold Core Investment Fund Retail Class | 411 919 | 0,00 | 9 676 | 7,45 | ||||
| 2025-09-04 | 13F/A | Advisor Group Holdings, Inc. | 92 197 | 22,61 | 2 156 | 31,16 | ||||
| 2025-08-11 | 13F | Aptus Capital Advisors, LLC | 287 | 0,00 | 7 | 0,00 | ||||
| 2025-07-25 | 13F | Concord Wealth Partners | 128 | 0,79 | 3 | 50,00 | ||||
| 2025-08-15 | 13F | Morgan Stanley | 2 625 775 | 22,19 | 61 679 | 31,31 | ||||
| 2025-07-11 | 13F | Seacrest Wealth Management, Llc | 12 881 | 0,65 | 303 | 8,24 | ||||
| 2025-08-28 | NP | GAL - SPDR SSGA Global Allocation ETF This fund is a listed as child fund of State Street Corp and if that institution has disclosed ownership in this security, then these positions will not be double counted when calculating total shares and total value | 221 473 | 98,66 | 5 202 | 113,46 | ||||
| 2025-08-13 | 13F | Renaissance Technologies Llc | 185 500 | 4 357 | ||||||
| 2025-04-29 | 13F | Hm Payson & Co | 54 208 | 376,30 | 1 185 | 387,24 | ||||
| 2025-07-25 | 13F | Cwm, Llc | 0 | −100,00 | 0 | |||||
| 2025-08-12 | 13F | Jpmorgan Chase & Co | 37 510 | 231,48 | 881 | 256,68 | ||||
| 2025-08-14 | 13F | Susquehanna International Group, Llp | 0 | −100,00 | 0 | |||||
| 2025-05-21 | 13F/A | Geneos Wealth Management Inc. | 59 | 1 | ||||||
| 2025-08-13 | 13F | Mackenzie Financial Corp | 173 005 | 0,00 | 4 064 | 7,46 | ||||
| 2025-08-07 | 13F | Montag A & Associates Inc | 896 | 0,00 | 21 | 10,53 | ||||
| 2025-07-23 | 13F/A | Euro Pacific Asset Management, LLC | 54 023 | −1,77 | 1 | 0,00 | ||||
| 2025-08-06 | 13F | Commonwealth Equity Services, Llc | 445 119 | 2 155,48 | 10 | |||||
| 2025-08-13 | 13F | EverSource Wealth Advisors, LLC | 0 | −100,00 | 0 | |||||
| 2025-08-14 | 13F | Gen-Wealth Partners Inc | 1 641 | 1,61 | 39 | 8,57 | ||||
| 2025-05-14 | 13F | Bnp Paribas Arbitrage, Sa | 0 | −100,00 | 0 | |||||
| 2025-08-06 | 13F | Csenge Advisory Group | 11 233 | 2,50 | 258 | 2,39 | ||||
| 2025-08-07 | 13F | Blackhawk Capital Partners LLC. | 0 | −100,00 | 0 | |||||
| 2025-08-05 | 13F | Bank Of Montreal /can/ | 63 860 | 1 908,81 | 1 500 | 2 073,91 | ||||
| 2025-07-09 | 13F | Post Resch Tallon Group Inc. | 12 713 | 0,00 | 299 | 7,58 | ||||
| 2025-07-31 | 13F | Moser Wealth Advisors, LLC | 219 | 5 | ||||||
| 2025-08-28 | NP | SSIZX - Sierra Tactical Core Income Fund Class A Shares | 461 700 | 10 845 | ||||||
| 2025-08-14 | 13F | Sunbelt Securities, Inc. | 111 | 0,00 | 2 | 0,00 | ||||
| 2025-07-30 | NP | QVOY - Q3 All-Season Active Rotation ETF | 25 155 | 577 | ||||||
| 2025-05-14 | 13F | Northwestern Mutual Wealth Management Co | 0 | −100,00 | 0 | |||||
| 2025-07-17 | 13F | Fifth Third Securities, Inc. | 19 101 | −28,06 | 449 | −22,76 | ||||
| 2025-07-25 | 13F | Richardson Financial Services Inc. | 989 | −28,85 | 23 | −23,33 | ||||
| 2025-08-08 | 13F | Capital Investment Advisory Services, LLC | 1 556 | 461,73 | 37 | 500,00 | ||||
| 2025-08-14 | 13F | GWM Advisors LLC | 52 529 | 10 533,40 | 1 234 | 12 230,00 | ||||
| 2025-07-09 | 13F | Baron Financial Group, LLC | 112 126 | 4,74 | 2 634 | 12,52 | ||||
| 2025-08-13 | 13F | Jones Financial Companies Lllp | 61 732 | 29,20 | 1 441 | 38,03 | ||||
| 2025-04-24 | 13F | Tsfg, Llc | 0 | −100,00 | 0 | |||||
| 2025-07-14 | 13F | UMA Financial Services, Inc. | 47 | 0,00 | 1 | 0,00 | ||||
| 2025-08-19 | 13F | Cape Investment Advisory, Inc. | 1 640 | 0,61 | 39 | 8,57 | ||||
| 2025-07-16 | 13F | Brown, Lisle/cummings, Inc. | 0 | −100,00 | 0 | |||||
| 2025-08-14 | 13F | Wells Fargo & Company/mn | 135 974 | −6,25 | 3 194 | 0,76 | ||||
| 2025-08-11 | 13F | Citigroup Inc | 3 753 724 | 19 000,01 | 88 175 | 20 453,38 | ||||
| 2025-08-12 | 13F | CIBC Private Wealth Group, LLC | 76 | −74,58 | 2 | −83,33 | ||||
| 2025-04-14 | 13F | Park Avenue Securities Llc | 0 | −100,00 | 0 | |||||
| 2025-08-13 | 13F | RPg Family Wealth Advisory, LLC | 14 286 | −95,92 | 336 | −95,62 | ||||
| 2025-08-12 | 13F | Global Retirement Partners, LLC | 723 | −0,28 | 17 | 6,67 | ||||
| 2025-08-08 | 13F | Emerald Investment Partners, Llc | 268 | 0,00 | 6 | 20,00 | ||||
| 2025-07-24 | 13F | Blair William & Co/il | 959 | 17,52 | 23 | 29,41 | ||||
| 2025-07-17 | 13F | Sound Income Strategies, LLC | 34 | 1 | ||||||
| 2025-08-05 | 13F | Lord & Richards Wealth Management, LLC | 0 | −100,00 | 0 | |||||
| 2025-07-10 | 13F | Worth Asset Management, LLC | 31 420 | 738 | ||||||
| 2025-05-30 | NP | GPTCX - GuidePath(R) Conservative Allocation Fund Service Shares | 61 241 | 1,34 | 1 339 | 3,56 | ||||
| 2025-08-08 | 13F | Larson Financial Group LLC | 47 | 1 | ||||||
| 2025-05-01 | 13F | High Note Wealth, LLC | 0 | −100,00 | 0 | |||||
| 2025-07-23 | 13F | Vontobel Holding Ltd. | 19 023 | −12,10 | 447 | −5,71 | ||||
| 2025-07-29 | 13F | FLC Capital Advisors | 392 651 | 9 223 | ||||||
| 2025-07-29 | 13F | Tradewinds Capital Management, LLC | 754 299 | 17 718 | ||||||
| 2025-08-01 | 13F | Envestnet Asset Management Inc | 816 030 | 4,52 | 19 169 | 12,32 | ||||
| 2025-07-17 | 13F | Eclectic Associates Inc /adv | 25 206 | −0,66 | 592 | 6,86 | ||||
| 2025-08-14 | 13F | Raymond James Financial Inc | 32 666 | 0,61 | 767 | 8,18 | ||||
| 2025-08-12 | 13F | Blueprint Financial Advisors LLC | 294 633 | 51,21 | 6 921 | 62,48 | ||||
| 2025-08-06 | 13F | Valued Wealth Advisors LLC | 0 | −100,00 | 0 | |||||
| 2025-05-08 | 13F | Natixis Advisors, L.p. | 0 | −100,00 | 0 | |||||
| 2025-08-12 | 13F | XTX Topco Ltd | 12 237 | 287 | ||||||
| 2025-08-05 | 13F | Simplex Trading, Llc | 189 | 0 | ||||||
| 2025-07-14 | 13F | Golden State Equity Partners | 33 102 | −16,25 | 778 | −9,97 | ||||
| 2025-08-14 | 13F | Tennessee Valley Asset Management Partners | 16 116 | 12,96 | 379 | 21,54 | ||||
| 2025-08-05 | 13F | Huntington National Bank | 0 | |||||||
| 2025-08-07 | 13F | Bradley & Co. Private Wealth Management, LLC | 0 | 0 | ||||||
| 2025-08-11 | 13F | Principal Securities, Inc. | 20 426 | 46,17 | 480 | 60,74 | ||||
| 2025-07-23 | 13F | Tectonic Advisors Llc | 442 925 | 29,12 | 10 404 | 38,76 | ||||
| 2025-08-14 | 13F | UBS Group AG | 132 018 | 11,93 | 3 101 | 20,29 | ||||
| 2025-07-07 | 13F | Upper Left Wealth Management, LLC | 226 378 | −0,74 | 5 318 | 6,66 | ||||
| 2025-07-18 | 13F | Pure Financial Advisors, Inc. | 48 524 | −5,09 | 1 140 | 1,97 | ||||
| 2025-08-14 | 13F | CoreCap Advisors, LLC | 22 965 | 795,67 | 539 | 862,50 | ||||
| 2025-08-12 | 13F | Blueprint Investment Partners LLC | 662 796 | 52,95 | 15 569 | 64,37 | ||||
| 2025-07-17 | 13F | Spartan Planning & Wealth Management | 176 993 | 64,63 | 4 158 | 76,89 | ||||
| 2025-04-21 | 13F | Cherry Tree Wealth Management, LLC | 0 | −100,00 | 0 | |||||
| 2025-08-12 | 13F | Proequities, Inc. | 0 | 0 | ||||||
| 2025-08-11 | 13F | HighTower Advisors, LLC | 17 431 | 409 | ||||||
| 2025-08-11 | 13F | Strategic Wealth Partners, Ltd. | 250 | 6 | ||||||
| 2025-07-28 | 13F | Axxcess Wealth Management, Llc | 17 964 | 422 | ||||||
| 2025-08-13 | 13F | Leuthold Group, Llc | 839 145 | 3,89 | 19 712 | 11,64 | ||||
| 2025-08-06 | 13F | Adviser Investments LLC | 181 952 | −60,95 | 4 274 | −58,03 | ||||
| 2025-08-14 | 13F | Destination Wealth Management | 10 078 | 237 | ||||||
| 2025-05-13 | 13F | Peak Financial Management, Inc. | 0 | −100,00 | 0 | |||||
| 2025-08-11 | 13F | Covestor Ltd | 15 656 | 26,86 | 0 | |||||
| 2025-09-03 | 13F | Q3 Asset Management | 93 851 | 2 | ||||||
| 2025-08-14 | 13F | Wiley Bros.-aintree Capital, Llc | 9 871 | 232 | ||||||
| 2025-07-18 | 13F | Client 1st Advisory Group, Llc | 14 067 | 0,00 | 330 | 7,49 | ||||
| 2025-08-06 | 13F | AE Wealth Management LLC | 32 | −99,47 | 1 | −100,00 | ||||
| 2025-07-30 | 13F | Prosperity Financial Group, Inc. | 9 511 | 223 | ||||||
| 2025-08-12 | 13F | Pathstone Holdings, LLC | 45 011 | 1 057 | ||||||
| 2025-08-12 | 13F | Howe & Rusling Inc | 401 | −37,34 | 9 | −30,77 | ||||
| 2025-08-13 | 13F | Cresset Asset Management, LLC | 38 214 | 898 | ||||||
| 2025-08-08 | 13F | Pnc Financial Services Group, Inc. | 48 149 | 122,42 | 1 131 | 139,11 | ||||
| 2025-08-14 | 13F | Comerica Bank | 13 998 | 44,07 | 329 | 54,72 | ||||
| 2025-07-25 | 13F | Keener Financial Planning LLC | 1 162 | 0 | ||||||
| 2025-08-15 | 13F | Kestra Advisory Services, LLC | 30 042 | 10,00 | 706 | 18,09 | ||||
| 2025-07-11 | 13F | Annex Advisory Services, LLC | 3 130 772 | 73 542 | ||||||
| 2025-08-08 | 13F | Cetera Investment Advisers | 347 371 | −2,18 | 8 160 | 5,11 | ||||
| 2025-08-14 | 13F | Cardiff Park Advisors, Llc | 18 435 | 0,00 | 433 | 7,71 | ||||
| 2025-08-11 | 13F | Sykon Capital Llc | 232 600 | 5 464 | ||||||
| 2025-08-14 | 13F | Riggs Asset Managment Co. Inc. | 0 | −100,00 | 0 | |||||
| 2025-08-12 | 13F | LPL Financial LLC | 401 392 | −9,61 | 9 429 | −2,87 | ||||
| 2025-07-22 | 13F | 4Thought Financial Group Inc. | 12 551 | −4,47 | 295 | 2,44 | ||||
| 2025-08-26 | NP | GLBIX - Leuthold Global Fund Institutional Class | 12 929 | 0,00 | 304 | 7,45 | ||||
| 2025-08-14 | 13F | State Street Corp | 904 760 | 2 766,07 | 21 253 | 2 980,00 | ||||
| 2025-08-13 | 13F/A | StoneX Group Inc. | 10 157 | 228 | ||||||
| 2025-08-12 | 13F | MAI Capital Management | 84 | 0,00 | 2 | 0,00 | ||||
| 2025-08-14 | 13F | Manufacturers Life Insurance Company, The | 7 099 331 | 11,52 | 166 763 | 19,84 | ||||
| 2025-08-14 | 13F | Bank Of America Corp /de/ | 488 691 | 54,86 | 11 479 | 66,41 | ||||
| 2025-08-04 | 13F | Assetmark, Inc | 38 320 | −65,37 | 900 | −62,78 | ||||
| 2025-07-10 | 13F | Wealth Enhancement Advisory Services, Llc | 9 730 | 227 | ||||||
| 2025-08-06 | 13F | Convergence Financial, LLC | 45 054 | 41,42 | 1 058 | 52,01 | ||||
| 2025-08-12 | 13F | O'shaughnessy Asset Management, Llc | 48 | 1 | ||||||
| 2025-08-14 | 13F | Hancock Whitney Corp | 75 330 | 1 770 | ||||||
| 2025-05-05 | 13F | Transce3nd, LLC | 0 | −100,00 | 0 | |||||
| 2025-08-14 | 13F | Colony Group, LLC | 9 924 | 0,80 | 233 | 8,37 | ||||
| 2025-07-21 | 13F | Quent Capital, LLC | 103 939 | −6,36 | 2 442 | 0,62 | ||||
| 2025-08-13 | 13F | Satovsky Asset Management Llc | 19 250 | 452 | ||||||
| 2025-08-06 | 13F | First Horizon Advisors, Inc. | 4 849 | −59,66 | 114 | −56,87 | ||||
| 2025-05-02 | 13F | Cullen/frost Bankers, Inc. | 0 | −100,00 | 0 | |||||
| 2025-08-14 | 13F | Citadel Advisors Llc | 22 167 | 30,04 | 521 | 39,78 | ||||
| 2025-07-25 | 13F | Atria Wealth Solutions, Inc. | 0 | −100,00 | 0 | |||||
| 2025-07-03 | 13F | Fiduciary Financial Group, Llc | 10 747 | 253 | ||||||
| 2025-07-24 | 13F | Us Bancorp \de\ | 0 | −100,00 | 0 | |||||
| 2025-04-29 | 13F | Truist Financial Corp | 0 | −100,00 | 0 | |||||
| 2025-08-08 | 13F | Croban | 88 982 | 11,80 | 2 089 | 20,13 | ||||
| 2025-07-25 | 13F | Envestnet Portfolio Solutions, Inc. | 62 196 | −45,56 | 1 461 | −41,53 | ||||
| 2025-04-21 | 13F | Nelson, Van Denburg & Campbell Wealth Management Group, LLC | 0 | −100,00 | 0 | |||||
| 2025-08-13 | 13F | Summit Financial, LLC | 8 563 | 201 | ||||||
| 2025-07-22 | 13F | Coastal Investment Advisors, Inc. | 12 207 | 2,49 | 287 | 10,00 | ||||
| 2025-08-13 | 13F | Congress Wealth Management LLC / DE / | 13 522 | −2,69 | 318 | 4,62 | ||||
| 2025-07-22 | 13F | Checchi Capital Advisers, LLC | 1 627 532 | 1,05 | 38 231 | 8,59 | ||||
| 2025-08-14 | 13F | Royal Bank Of Canada | 29 123 | 6,22 | 684 | 14,00 | ||||
| 2025-08-06 | 13F | Walkner Condon Financial Advisors LLC | 205 328 | 119,90 | 4 823 | 136,26 | ||||
| 2025-07-24 | 13F | rebel Financial LLC | 267 556 | 6 285 | ||||||
| 2025-08-14 | 13F | Mercer Global Advisors Inc /adv | 72 173 | 603,03 | 1 695 | 656,70 | ||||
| 2025-07-02 | 13F | HBW Advisory Services LLC | 8 803 | 207 | ||||||
| 2025-08-14 | 13F | Mml Investors Services, Llc | 154 234 | −6,10 | 4 | 0,00 | ||||
| 2025-07-31 | 13F | Cambridge Investment Research Advisors, Inc. | 17 756 | 0 | ||||||
| 2025-07-29 | 13F | Salomon & Ludwin, LLC | 32 | −51,52 | 1 | −100,00 | ||||
| 2025-05-16 | 13F | Coppell Advisory Solutions LLC | 0 | −100,00 | 0 | |||||
| 2025-07-31 | 13F | Oppenheimer & Co Inc | 22 885 | −1,31 | 538 | 6,13 | ||||
| 2025-08-14 | 13F | Fmr Llc | 645 | −0,15 | 15 | 7,14 | ||||
| 2025-05-06 | 13F | Avantax Advisory Services, Inc. | 0 | −100,00 | 0 |
Other Listings
| MX:BWX |