Grundläggande statistik
| Institutionella ägare | 175 total, 175 long only, 0 short only, 0 long/short - change of 5,42% MRQ |
| Genomsnittlig portföljallokering | 0.8934 % - change of 7,40% MRQ |
| Institutionella aktier (lång) | 26 249 004 (ex 13D/G) - change of 1,41MM shares 5,68% MRQ |
| Institutionellt värde (lång) | $ 2 454 867 USD ($1000) |
Institutionellt ägande och aktieägare
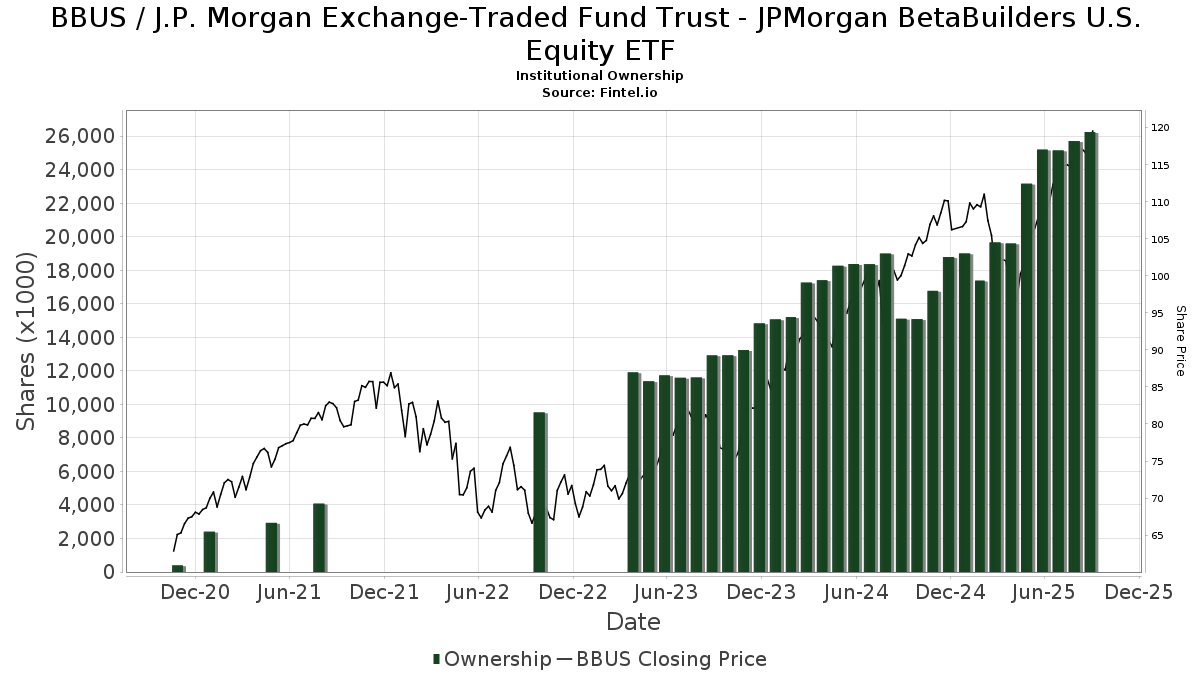
J.P. Morgan Exchange-Traded Fund Trust - JPMorgan BetaBuilders U.S. Equity ETF (US:BBUS) har 175 Institutionella ägare och aktieägare som har lämnat in 13D/G- eller 13F-formulär till Securities Exchange Commission (SEC). Dessa institut innehar totalt 26,249,004 aktier. Största aktieägare inkluderar Jpmorgan Chase & Co, Janney Montgomery Scott LLC, Vestmark Advisory Solutions, Inc., LPL Financial LLC, Morgan Stanley, Envestnet Asset Management Inc, PFSEX - RiskPro® 30+ Fund Class R, Cornerstone Wealth Management, LLC, Gradient Investments LLC, and Kelly Financial Group Llc .
J.P. Morgan Exchange-Traded Fund Trust - JPMorgan BetaBuilders U.S. Equity ETF (BATS:BBUS) Institutionell ägarstruktur visar institutioners och fonders nuvarande positioner i företaget, samt de senaste förändringarna i positionernas storlek. Större aktieägare kan vara enskilda investerare, fonder, hedgefonder eller institutioner. Bilaga 13D visar att investeraren äger (eller ägde) mer än 5% av företaget och avser (eller avsåg) att aktivt eftersträva en förändring av affärsstrategin. Schedule 13G indikerar en passiv investering på över 5%.
The share price as of September 12, 2025 is 119,12 / share. Previously, on September 16, 2024, the share price was 101,56 / share. This represents an increase of 17,29% over that period.
Fondsentimentets poäng
Fondsentimentet poängen(fka Ägarackumulation-poäng) visar vilka aktier som är mest köpta av fonder. Det är resultatet av en sofistikerad kvantitativ flerfaktormodell som identifierar företag med de högsta nivåerna av institutionell ackumulering. Poängsättningsmodellen använder en kombination av den totala ökningen av redovisade ägare, förändringarna i portföljallokeringarna för dessa ägare och andra mått. Siffran sträcker sig från 0 till 100, där högre siffror indikerar en högre nivå av ackumulering i förhållande till sina konkurrenter, och 50 är genomsnittet.
Uppdateringsfrekvens: Dagligen
Se Ownership Explorer, som innehåller en lista över de högst rankade företagen.
Institutionell sälj/köp-kvot
Förutom att rapportera vanliga eget kapital- och skuldemissioner måste institutioner med mer än 100MM tillgångar under förvaltning också avslöja sina innehav av sälj- och köpoptioner. Eftersom säljoptioner i allmänhet indikerar ett negativt sentiment och köpoptioner indikerar ett positivt sentiment, kan vi få en uppfattning om det övergripande institutionella sentimentet genom att plotta förhållandet mellan säljoptioner och köpoptioner. Diagrammet till höger visar det historiska förhållandet mellan sälj- och köpoptioner för detta instrument.
Genom att använda sälj/köp-kvoten som en indikator på aktieägarnas sentiment undviker man en av de största bristerna med att använda det totala institutionella ägandet, nämligen att en betydande del av de förvaltade tillgångarna investeras passivt för att följa index. Passivt förvaltade fonder köper vanligtvis inte optioner, så indikatorn för sälj/köp-kvoten ger en bättre bild av stämningen i aktivt förvaltade fonder.
13F- och NPORT-arkiveringar
Detaljer om 13F-arkiveringar är gratis. Detaljer om NP-arkiveringar kräver ett premiummedlemskap. Gröna rader indikerar nya positioner. Röda rader indikerar stängda positioner. Klicka på länk symbolen för att se hela transaktionshistoriken.
Uppgradera
för att låsa upp premiumdata och exportera till Excel ![]() .
.
| Fil Datum | Källa | Investerare | Typ | Genomsnittligt pris (beräknat) |
Aktier | Δ Aktier (%) |
Rapporterat värde (1000 USD) |
Δ Värde (%) |
Portföljallokering (%) |
|
|---|---|---|---|---|---|---|---|---|---|---|
| 2025-07-31 | 13F | MN Wealth Advisors, LLC | 226 009 | −16,53 | 25 295 | −7,41 | ||||
| 2025-08-13 | 13F | Jones Financial Companies Lllp | 0 | −100,00 | 0 | |||||
| 2025-07-29 | 13F | Mattson Financial Services, LLC | 24 680 | 36,29 | 2 762 | 51,18 | ||||
| 2025-08-11 | 13F | Semus Wealth Partners LLC | 5 763 | −6,48 | 645 | 3,70 | ||||
| 2025-08-13 | 13F | Gateway Wealth Partners, LLC | 20 627 | −25,14 | 2 309 | −16,98 | ||||
| 2025-07-23 | 13F | Prime Capital Investment Advisors, LLC | 0 | −100,00 | 0 | |||||
| 2025-08-11 | 13F | Private Advisor Group, LLC | 56 461 | −10,98 | 6 319 | −1,23 | ||||
| 2025-08-12 | 13F | Jpmorgan Chase & Co | 3 724 792 | −15,93 | 416 879 | −6,74 | ||||
| 2025-07-17 | 13F | Archford Capital Strategies, LLC | 62 679 | −26,97 | 7 015 | −18,99 | ||||
| 2025-07-28 | 13F | Rosenberg Matthew Hamilton | 64 336 | 121,38 | 7 200 | 145,65 | ||||
| 2025-08-01 | 13F | Bank of Jackson Hole Trust | 33 | 0,00 | 4 | 0,00 | ||||
| 2025-07-30 | 13F | Fingerlakes Wealth Management, Inc. | 25 645 | 11,39 | 2 870 | 23,60 | ||||
| 2025-08-12 | 13F | Tradition Wealth Management, LLC | 319 774 | 8,24 | 35 789 | 20,07 | ||||
| 2025-08-04 | 13F | IFG Advisory, LLC | 133 667 | −25,62 | 14 960 | −17,49 | ||||
| 2025-07-28 | 13F | Mutual Advisors, LLC | 4 713 | 16,60 | 544 | 35,07 | ||||
| 2025-07-24 | 13F | JB Capital LLC | 1 959 | 219 | ||||||
| 2025-08-14 | 13F | D. E. Shaw & Co., Inc. | 2 218 | 248 | ||||||
| 2025-08-14 | 13F | Herold Advisors, Inc. | 2 000 | 0,00 | 224 | 10,95 | ||||
| 2025-08-13 | 13F | GeoWealth Management, LLC | 21 595 | −0,91 | 2 417 | 9,92 | ||||
| 2025-08-14 | 13F | Integrated Wealth Concepts LLC | 99 917 | 21,17 | 11 183 | 34,42 | ||||
| 2025-07-25 | 13F | Envestnet Portfolio Solutions, Inc. | 6 195 | −11,79 | 693 | −2,12 | ||||
| 2025-04-11 | 13F | Principia Wealth Advisory, LLC | 0 | −100,00 | 0 | −100,00 | ||||
| 2025-08-07 | 13F | Shared Vision Wealth Group LLC | 3 501 | 15,97 | 401 | 31,91 | ||||
| 2025-08-14 | 13F | Two Sigma Investments, Lp | 127 900 | 14 315 | ||||||
| 2025-07-21 | 13F | Ascent Group, LLC | 45 248 | 7,92 | 5 064 | 19,72 | ||||
| 2025-08-05 | 13F | Frederick Financial Consultants, LLC | 1 887 | 211 | ||||||
| 2025-08-05 | 13F | Bank of New York Mellon Corp | 2 302 | 0,00 | 258 | 10,78 | ||||
| 2025-08-06 | 13F | Hoxton Planning & Management, LLC | 10 672 | 367,46 | 1 194 | 419,13 | ||||
| 2025-08-14 | 13F | Riggs Asset Managment Co. Inc. | 111 | 0,00 | 12 | 9,09 | ||||
| 2025-08-14 | 13F | Bank Of America Corp /de/ | 107 330 | 147,13 | 12 012 | 174,18 | ||||
| 2025-08-06 | 13F | AE Wealth Management LLC | 43 | −63,87 | 5 | −66,67 | ||||
| 2025-07-25 | 13F | Sequoia Financial Advisors, LLC | 2 522 | 18,91 | 282 | 32,39 | ||||
| 2025-05-02 | 13F | First Command Advisory Services, Inc. | 0 | −100,00 | 0 | |||||
| 2025-08-06 | 13F | Moors & Cabot, Inc. | 0 | −100,00 | 0 | |||||
| 2025-08-12 | 13F | Wayfinding Financial, LLC | 45 609 | −2,57 | 5 | 25,00 | ||||
| 2025-08-14 | 13F | Qube Research & Technologies Ltd | 863 | −52,87 | 97 | −47,83 | ||||
| 2025-08-13 | 13F | Renaissance Technologies Llc | 6 400 | 48,84 | 716 | 65,36 | ||||
| 2025-08-06 | 13F | Mascagni Wealth Management, Inc. | 1 984 | −34,54 | 222 | −27,21 | ||||
| 2025-08-08 | 13F | Good Life Advisors, LLC | 7 934 | 5,42 | 888 | 16,86 | ||||
| 2025-08-04 | 13F | Assetmark, Inc | 465 258 | −10,19 | 52 072 | −0,38 | ||||
| 2025-08-12 | 13F | Gladstone Institutional Advisory LLC | 5 751 | 0,12 | 644 | 11,05 | ||||
| 2025-08-13 | 13F | Townsquare Capital Llc | 0 | −100,00 | 0 | |||||
| 2025-07-25 | 13F | Welch Group, LLC | 2 227 | 0,00 | 249 | 11,66 | ||||
| 2025-07-08 | 13F | Webster Bank, N. A. | 192 | 0,00 | 21 | 10,53 | ||||
| 2025-08-14 | 13F | Goldman Sachs Group Inc | 38 477 | 54,12 | 4 306 | 71,01 | ||||
| 2025-07-15 | 13F | Well Done, LLC | 1 947 | 218 | ||||||
| 2025-08-12 | 13F | Change Path, LLC | 102 788 | −9,00 | 11 504 | 0,96 | ||||
| 2025-08-14 | 13F | Susquehanna International Group, Llp | 29 280 | −24,36 | 3 277 | −16,08 | ||||
| 2025-05-14 | 13F | CIBC Private Wealth Group, LLC | 0 | −100,00 | 0 | |||||
| 2025-08-12 | 13F | Archer Investment Corp | 2 691 | 10,70 | 301 | 22,86 | ||||
| 2025-07-10 | 13F | Family Legacy Financial Solutions, LLC | 242 | 27 | ||||||
| 2025-08-15 | 13F | Kestra Advisory Services, LLC | 2 177 | 0,14 | 244 | 10,96 | ||||
| 2025-07-22 | 13F | Firethorn Wealth Partners, Llc | 25 429 | 11,08 | 2 846 | 23,26 | ||||
| 2025-08-08 | 13F | Emerald Investment Partners, Llc | 388 | 0,00 | 43 | 10,26 | ||||
| 2025-08-06 | 13F | Golden State Wealth Management, LLC | 2 321 | 6,81 | 260 | 18,26 | ||||
| 2025-07-09 | 13F | Massmutual Trust Co Fsb/adv | 76 264 | −12,00 | 8 535 | −2,38 | ||||
| 2025-08-08 | 13F | National Mutual Insurance Federation of Agricultural Cooperatives | 463 000 | 0,00 | 51 819 | 10,93 | ||||
| 2025-07-08 | 13F/A | Salem Investment Counselors Inc | 14 | 0,00 | 2 | 0,00 | ||||
| 2025-07-14 | 13F | Park Avenue Securities Llc | 206 411 | −0,42 | 23 | 15,00 | ||||
| 2025-07-23 | 13F | Fortis Advisors, LLC | 2 053 | −33,41 | 230 | −26,37 | ||||
| 2025-08-12 | 13F | Bravias Capital Group, LLC | 106 956 | 2,96 | 11 971 | 14,22 | ||||
| 2025-05-09 | 13F | Cary Street Partners Financial Llc | 0 | −100,00 | 0 | |||||
| 2025-04-29 | 13F | Financial Network Wealth Management LLC | 9 237 | 12,54 | 1 | |||||
| 2025-08-11 | 13F | Pineridge Advisors LLC | 9 | 1 | ||||||
| 2025-07-16 | 13F | ORG Partners LLC | 25 649 | 2 867 | ||||||
| 2025-07-08 | 13F | Paladin Wealth, LLC | 16 058 | −11,89 | 1 797 | −2,23 | ||||
| 2025-09-04 | 13F/A | Advisor Group Holdings, Inc. | 271 521 | 53,35 | 29 470 | 64,95 | ||||
| 2025-08-12 | 13F | Global Retirement Partners, LLC | 9 297 | 152,22 | 1 041 | 166,67 | ||||
| 2025-07-14 | 13F | AdvisorNet Financial, Inc | 21 851 | 15,12 | 2 446 | 27,74 | ||||
| 2025-08-13 | 13F | EverSource Wealth Advisors, LLC | 129 | 0,00 | 14 | 7,69 | ||||
| 2025-05-15 | 13F/A | Orion Portfolio Solutions, LLC | 119 290 | −8,15 | 12 035 | −12,51 | ||||
| 2025-08-14 | 13F | UBS Group AG | 106 | 1 666,67 | 12 | |||||
| 2025-08-08 | 13F | Creative Planning | 206 981 | −76,82 | 23 165 | −74,29 | ||||
| 2025-08-14 | 13F | Mariner, LLC | 2 218 | −18,25 | 248 | −9,16 | ||||
| 2025-08-19 | 13F | Advisory Services Network, LLC | 14 977 | 5,06 | 1 716 | 19,26 | ||||
| 2025-08-14 | 13F | Mml Investors Services, Llc | 170 383 | 3,49 | 19 | 18,75 | ||||
| 2025-08-11 | 13F | Rothschild Investment Llc | 22 | 0,00 | 2 | 0,00 | ||||
| 2025-08-13 | 13F | Russell Investments Group, Ltd. | 10 | 0,00 | 1 | 0,00 | ||||
| 2025-08-19 | 13F | National Asset Management, Inc. | 0 | −100,00 | 0 | |||||
| 2025-07-11 | 13F | Adirondack Trust Co | 2 935 | 25,32 | 328 | 38,98 | ||||
| 2025-07-17 | 13F | Halbert Hargrove Global Advisors, Llc | 8 | −11,11 | 1 | |||||
| 2025-08-11 | 13F | Nations Financial Group Inc, /ia/ /adv | 14 381 | 20,67 | 1 610 | 33,86 | ||||
| 2025-07-31 | 13F | Cambridge Investment Research Advisors, Inc. | 482 627 | −12,17 | 54 | −1,82 | ||||
| 2025-06-30 | NP | PFJDX - RiskPro® Dynamic 20-30 Fund Class R | 180 008 | −13,58 | 18 044 | −20,58 | ||||
| 2025-07-23 | 13F | Kingswood Wealth Advisors, Llc | 12 666 | 3,15 | 1 418 | 14,46 | ||||
| 2025-08-04 | 13F | Creative Financial Designs Inc /adv | 9 | 1 | ||||||
| 2025-08-13 | 13F | Beacon Pointe Advisors, LLC | 2 693 | 0,00 | 301 | 11,07 | ||||
| 2025-08-06 | 13F | Commonwealth Equity Services, Llc | 14 301 | 31,70 | 2 | 0,00 | ||||
| 2025-08-07 | 13F | Nwam Llc | 13 585 | 0,41 | 1 561 | 14,44 | ||||
| 2025-08-07 | 13F | Allworth Financial LP | 822 | 20,88 | 92 | 37,31 | ||||
| 2025-07-15 | 13F | Kelly Financial Group Llc | 486 677 | 11,28 | 54 469 | 23,44 | ||||
| 2025-07-21 | 13F | Ameriflex Group, Inc. | 0 | −100,00 | 0 | |||||
| 2025-08-13 | 13F | Twin Peaks Wealth Advisors, LLC | 16 058 | 2,89 | 1 869 | 23,30 | ||||
| 2025-08-18 | 13F | Geneos Wealth Management Inc. | 8 143 | 18,37 | 911 | 31,27 | ||||
| 2025-08-12 | 13F | Cornerstone Wealth Management, LLC | 687 686 | −4,96 | 76 966 | 5,43 | ||||
| 2025-08-12 | 13F | Jacobi Capital Management LLC | 25 578 | 25,98 | 2 863 | 39,75 | ||||
| 2025-07-28 | 13F | WealthPlan Investment Management, LLC | 34 573 | 3 869 | ||||||
| 2025-08-14 | 13F | GWM Advisors LLC | 440 | 0,23 | 49 | 11,36 | ||||
| 2025-08-13 | 13F | VestGen Advisors, LLC | 41 528 | 88,91 | 4 748 | 114,16 | ||||
| 2025-08-11 | 13F | Aptus Capital Advisors, LLC | 55 270 | 31,28 | 6 186 | 45,63 | ||||
| 2025-08-14 | 13F | Ancora Advisors, LLC | 1 609 | 0,00 | 180 | 11,11 | ||||
| 2025-08-01 | 13F/A | GGM Financials LLC | 4 361 | −0,02 | 488 | 10,91 | ||||
| 2025-07-14 | 13F | Signature Securities Group Corporation | 2 930 | −2,40 | 328 | 8,28 | ||||
| 2025-07-16 | 13F | Wealth Group Ltd | 220 954 | 350,12 | 24 729 | 399,37 | ||||
| 2025-07-24 | 13F | 3Chopt Investment Partners, LLC | 42 242 | −13,50 | 4 728 | −4,06 | ||||
| 2025-08-08 | 13F | Gts Securities Llc | 0 | −100,00 | 0 | |||||
| 2025-08-08 | 13F/A | Ignite Planners, LLC | 14 793 | 7,52 | 1 682 | 21,09 | ||||
| 2025-08-12 | 13F | J.w. Cole Advisors, Inc. | 8 715 | 11,79 | 975 | 24,05 | ||||
| 2025-07-17 | 13F | Janney Montgomery Scott LLC | 3 120 488 | −1,54 | 349 | 9,40 | ||||
| 2025-07-23 | 13F | HMV Wealth Advisors, LLC | 0 | −100,00 | 0 | |||||
| 2025-08-11 | 13F | Vanguard Group Inc | 5 958 | −11,22 | 667 | −1,62 | ||||
| 2025-07-16 | 13F | Blue Oak Capital, LLC | 99 537 | −17,72 | 11 140 | −8,72 | ||||
| 2025-08-13 | 13F | IAG Wealth Partners, LLC | 22 381 | 4 776,03 | 2 505 | 5 343,48 | ||||
| 2025-07-08 | 13F | Gradient Investments LLC | 581 991 | 3,13 | 65 136 | 14,41 | ||||
| 2025-08-13 | 13F | Northwestern Mutual Wealth Management Co | 941 | −3,59 | 105 | 7,14 | ||||
| 2025-08-14 | 13F | Fmr Llc | 4 857 | 48,03 | 544 | 64,05 | ||||
| 2025-07-30 | 13F | TFB Advisors LLC | 12 852 | −9,83 | 1 438 | 0,07 | ||||
| 2025-07-22 | 13F | Sutton Place Investors Llc | 20 192 | 1,02 | 2 260 | 12,05 | ||||
| 2025-08-14 | 13F | Smartleaf Asset Management LLC | 285 | 32 | ||||||
| 2025-07-25 | 13F | Atria Wealth Solutions, Inc. | 3 555 | 3,74 | 398 | 15,07 | ||||
| 2025-07-30 | 13F | Drive Wealth Management, Llc | 132 922 | 18,10 | 14 877 | 31,02 | ||||
| 2025-08-14 | 13F | Royal Bank Of Canada | 70 088 | −10,36 | 7 845 | −0,56 | ||||
| 2025-07-24 | 13F | Robertson Stephens Wealth Management, LLC | 441 230 | 60,09 | 49 383 | 77,59 | ||||
| 2025-08-15 | 13F | Morgan Stanley | 1 798 161 | 11,31 | 201 250 | 23,48 | ||||
| 2025-08-05 | 13F | 5T Wealth, LLC | 100 779 | 11,97 | 11 279 | 24,22 | ||||
| 2025-08-12 | 13F | WealthTrak Capital Management LLC | 63 | −44,74 | 7 | −36,36 | ||||
| 2025-07-24 | 13F | Blair William & Co/il | 467 | 678,33 | 52 | 766,67 | ||||
| 2025-08-12 | 13F | O'shaughnessy Asset Management, Llc | 190 | −92,18 | 21 | −91,43 | ||||
| 2025-08-13 | 13F | WCG Wealth Advisors LLC | 10 364 | −3,26 | 1 160 | 7,31 | ||||
| 2025-07-23 | 13F | Clear Creek Financial Management, LLC | 18 938 | 12,93 | 2 120 | 25,31 | ||||
| 2025-08-11 | 13F | HighTower Advisors, LLC | 9 052 | −8,64 | 1 013 | 1,40 | ||||
| 2025-07-24 | 13F | JNBA Financial Advisors | 136 | 0,00 | 15 | 15,38 | ||||
| 2025-08-12 | 13F | Proequities, Inc. | 0 | 0 | ||||||
| 2025-08-14 | 13F | Jane Street Group, Llc | 18 497 | 2 070 | ||||||
| 2025-08-13 | 13F | Cary Street Partner Investment Advisory Llc | 19 214 | −6,17 | 2 150 | 4,12 | ||||
| 2025-07-16 | 13F | Perigon Wealth Management, LLC | 402 511 | 0,51 | 45 049 | 11,50 | ||||
| 2025-07-24 | 13F | KFA Private Wealth Group, LLC | 2 212 | 248 | ||||||
| 2025-08-14 | 13F | Federation des caisses Desjardins du Quebec | 50 | 6 | ||||||
| 2025-08-15 | 13F/A | Florida Financial Advisors, Llc | 104 893 | −0,78 | 11 740 | 10,07 | ||||
| 2025-08-13 | 13F | Marshall Wace, Llp | 7 059 | 790 | ||||||
| 2025-08-11 | 13F | Lake Street Financial Llc | 44 213 | −7,23 | 4 948 | 2,91 | ||||
| 2025-08-14 | 13F | CoreCap Advisors, LLC | 268 | 208,05 | 30 | 262,50 | ||||
| 2025-08-26 | 13F/A | Thrivent Financial For Lutherans | 29 344 | 3 | ||||||
| 2025-07-25 | 13F | Cwm, Llc | 119 721 | 131,68 | 13 | 160,00 | ||||
| 2025-07-22 | 13F | Grimes & Company, Inc. | 2 200 | 0,27 | 246 | 11,31 | ||||
| 2025-07-17 | 13F | Sound Income Strategies, LLC | 172 | 0,00 | 19 | 11,76 | ||||
| 2025-07-21 | 13F | Ameritas Advisory Services, LLC | 191 | 21 | ||||||
| 2025-07-18 | 13F | Lockerman Financial Group, Inc. | 26 442 | −8,56 | 2 959 | 1,44 | ||||
| 2025-04-21 | 13F | Ronald Blue Trust, Inc. | 0 | −100,00 | 0 | −100,00 | ||||
| 2025-07-17 | 13F | Kelly Financial Services LLC | 4 255 | 6,56 | 476 | 18,41 | ||||
| 2025-08-14 | 13F | Wells Fargo & Company/mn | 1 404 | 157 | ||||||
| 2025-07-28 | 13F | Harbour Investments, Inc. | 339 | 0,30 | 38 | 8,82 | ||||
| 2025-08-08 | 13F | SBI Securities Co., Ltd. | 132 | 59,04 | 15 | 75,00 | ||||
| 2025-08-11 | 13F | Synergy Investment Management, LLC | 0 | −100,00 | 0 | |||||
| 2025-08-14 | 13F | Ameriprise Financial Inc | 73 400 | −28,52 | 8 215 | −20,71 | ||||
| 2025-08-14 | 13F | Great Valley Advisor Group, Inc. | 74 533 | 268,74 | 8 342 | 309,07 | ||||
| 2025-08-15 | 13F | Equitable Holdings, Inc. | 30 874 | −27,75 | 3 455 | −19,86 | ||||
| 2025-08-11 | 13F | Citigroup Inc | 6 960 | 779 | ||||||
| 2025-08-12 | 13F | LPL Financial LLC | 2 804 857 | −0,05 | 313 920 | 10,88 | ||||
| 2025-08-04 | 13F | Spire Wealth Management | 1 236 | 189,46 | 138 | 220,93 | ||||
| 2025-08-15 | 13F | Brown Financial Advisors | 31 109 | −1,58 | 3 482 | 9,19 | ||||
| 2025-08-04 | 13F | Pensionmark Financial Group, Llc | 3 689 | −19,86 | 413 | −11,21 | ||||
| 2025-08-01 | 13F | Envestnet Asset Management Inc | 1 631 843 | 2,62 | 182 636 | 13,84 | ||||
| 2025-08-14 | 13F | Comerica Bank | 1 262 | −1,87 | 141 | 9,30 | ||||
| 2025-08-08 | 13F | Cetera Investment Advisers | 360 284 | 0,34 | 40 323 | 11,31 | ||||
| 2025-08-15 | 13F | Tower Research Capital LLC (TRC) | 7 856 | 167,03 | 879 | 196,96 | ||||
| 2025-05-02 | 13F | Wealthfront Advisers Llc | 0 | −100,00 | 0 | −100,00 | ||||
| 2025-08-05 | 13F | Cherry Tree Wealth Management, LLC | 208 | 0,00 | 23 | 15,00 | ||||
| 2025-07-25 | 13F | NorthRock Partners, LLC | 0 | −100,00 | 0 | |||||
| 2025-08-14 | 13F | Harwood Advisory Group, LLC | 0 | −100,00 | 0 | −100,00 | ||||
| 2025-06-30 | NP | PFSEX - RiskPro® 30+ Fund Class R | 787 862 | 75,74 | 78 975 | 61,50 | ||||
| 2025-08-29 | 13F | Total Investment Management Inc | 1 765 | 198 | ||||||
| 2025-07-16 | 13F | Owen LaRue, LLC | 4 880 | 546 | ||||||
| 2025-08-18 | 13F | N.E.W. Advisory Services LLC | 0 | −100,00 | 0 | |||||
| 2025-07-18 | 13F | Nabity-Jensen Investment Management Inc | 5 857 | 0,00 | 656 | 11,02 | ||||
| 2025-08-01 | 13F | Rossby Financial, LCC | 625 | 0,00 | 70 | 11,29 | ||||
| 2025-08-05 | 13F | Strategic Financial Concepts, LLC | 4 224 | −73,53 | 473 | −70,67 | ||||
| 2025-07-10 | 13F | Wealth Enhancement Advisory Services, Llc | 6 365 | −17,54 | 721 | −7,33 | ||||
| 2025-07-11 | 13F | Farther Finance Advisors, LLC | 23 965 | −26,62 | 2 682 | −18,90 | ||||
| 2025-07-14 | 13F | Ridgewood Investments LLC | 1 149 | 0,00 | 129 | 11,30 | ||||
| 2025-07-25 | 13F | Richardson Financial Services Inc. | 6 358 | 6,71 | 711 | 18,14 | ||||
| 2025-08-06 | 13F | Vestmark Advisory Solutions, Inc. | 2 856 818 | 108,05 | 319 735 | 130,80 | ||||
| 2025-08-08 | 13F | Capital Investment Advisory Services, LLC | 2 433 | −12,76 | 272 | −3,20 | ||||
| 2025-07-30 | 13F | LGT Financial Advisors LLC | 887 | 0,11 | 99 | 11,24 | ||||
| 2025-08-14 | 13F | Raymond James Financial Inc | 45 168 | 108,29 | 5 055 | 131,14 | ||||
| 2025-08-18 | 13F | Goodman Advisory Group, LLC | 0 | −100,00 | 0 | |||||
| 2025-07-30 | 13F | Whittier Trust Co Of Nevada Inc | 7 193 | 20,63 | 805 | 33,94 | ||||
| 2025-08-08 | 13F | Empower Advisory Group, LLC | 0 | −100,00 | 0 | |||||
| 2025-07-24 | 13F | IFP Advisors, Inc | 30 219 | 38,59 | 3 382 | 53,80 | ||||
| 2025-05-13 | 13F | Northern Trust Corp | 0 | −100,00 | 0 | |||||
| 2025-05-12 | 13F | Independent Advisor Alliance | 0 | −100,00 | 0 | |||||
| 2025-08-01 | 13F | Schmidt P J Investment Management Inc | 78 025 | −0,71 | 8 733 | 10,14 | ||||
| 2025-08-14 | 13F | Betterment LLC | 2 049 | −68,66 | 0 | |||||
| 2025-08-27 | 13F/A | Brinker Capital Investments, LLC | 118 942 | −0,29 | 13 312 | 10,61 | ||||
| 2025-07-29 | 13F | Private Trust Co Na | 7 728 | −13,10 | 865 | −3,68 | ||||
| 2025-08-12 | 13F | Absolute Capital Management, LLC | 2 028 | −8,40 | 227 | 1,79 | ||||
| 2025-05-14 | 13F | Zacks Investment Management | 0 | −100,00 | 0 | |||||
| 2025-07-25 | 13F | We Are One Seven, LLC | 32 379 | 3 624 | ||||||
| 2025-07-21 | 13F | Triad Wealth Partners, LLC | 10 865 | 0,79 | 1 216 | 11,87 |