Grundläggande statistik
| Institutionella ägare | 184 total, 179 long only, 0 short only, 5 long/short - change of 13,50% MRQ |
| Genomsnittlig portföljallokering | 0.0544 % - change of 18,88% MRQ |
| Institutionella aktier (lång) | 2 849 238 (ex 13D/G) - change of 0,40MM shares 16,20% MRQ |
| Institutionellt värde (lång) | $ 231 999 USD ($1000) |
Institutionellt ägande och aktieägare
ARK ETF Trust - ARK Autonomous Technology & Robotics ETF (US:ARKQ) har 184 Institutionella ägare och aktieägare som har lämnat in 13D/G- eller 13F-formulär till Securities Exchange Commission (SEC). Dessa institut innehar totalt 2,849,238 aktier. Största aktieägare inkluderar Bank Of America Corp /de/, Morgan Stanley, LPL Financial LLC, Wells Fargo & Company/mn, DRW Securities, LLC, Kingstone Capital Partners Texas, LLC, Prudential Plc, Brookstone Capital Management, Raymond James Financial Inc, and EWG Elevate Inc. .
ARK ETF Trust - ARK Autonomous Technology & Robotics ETF (BATS:ARKQ) Institutionell ägarstruktur visar institutioners och fonders nuvarande positioner i företaget, samt de senaste förändringarna i positionernas storlek. Större aktieägare kan vara enskilda investerare, fonder, hedgefonder eller institutioner. Bilaga 13D visar att investeraren äger (eller ägde) mer än 5% av företaget och avser (eller avsåg) att aktivt eftersträva en förändring av affärsstrategin. Schedule 13G indikerar en passiv investering på över 5%.
The share price as of September 12, 2025 is 100,75 / share. Previously, on September 16, 2024, the share price was 56,20 / share. This represents an increase of 79,27% over that period.

Fondsentimentets poäng
Fondsentimentet poängen(fka Ägarackumulation-poäng) visar vilka aktier som är mest köpta av fonder. Det är resultatet av en sofistikerad kvantitativ flerfaktormodell som identifierar företag med de högsta nivåerna av institutionell ackumulering. Poängsättningsmodellen använder en kombination av den totala ökningen av redovisade ägare, förändringarna i portföljallokeringarna för dessa ägare och andra mått. Siffran sträcker sig från 0 till 100, där högre siffror indikerar en högre nivå av ackumulering i förhållande till sina konkurrenter, och 50 är genomsnittet.
Uppdateringsfrekvens: Dagligen
Se Ownership Explorer, som innehåller en lista över de högst rankade företagen.
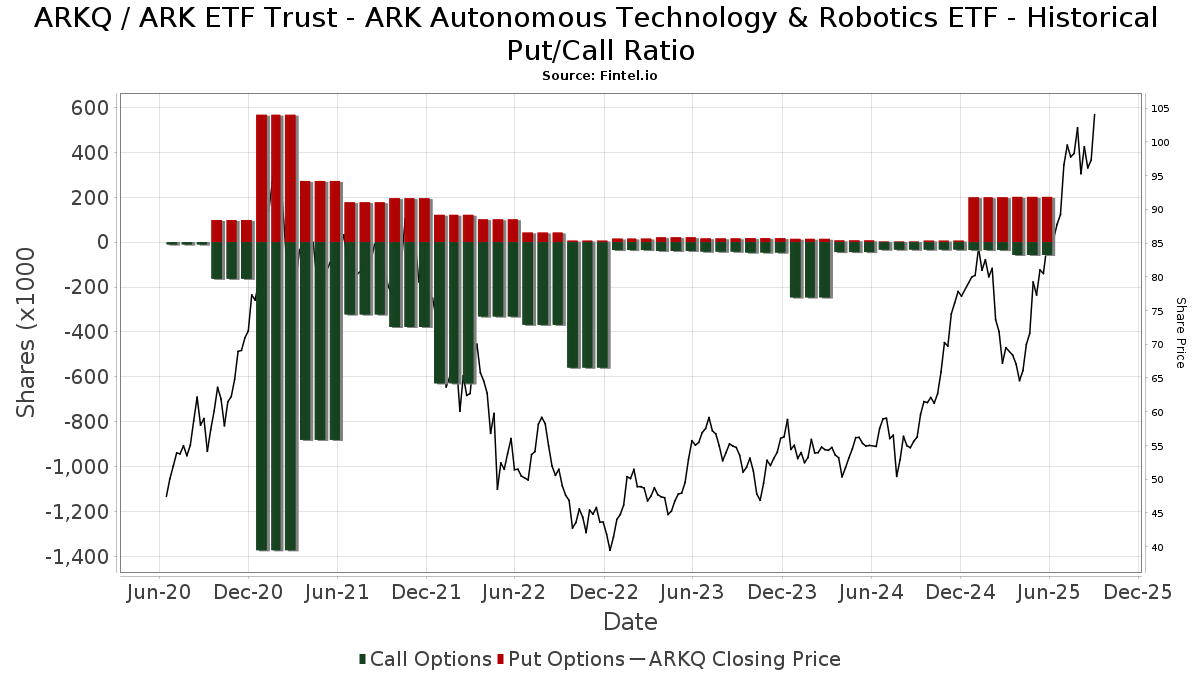
Institutionell sälj/köp-kvot
Förutom att rapportera vanliga eget kapital- och skuldemissioner måste institutioner med mer än 100MM tillgångar under förvaltning också avslöja sina innehav av sälj- och köpoptioner. Eftersom säljoptioner i allmänhet indikerar ett negativt sentiment och köpoptioner indikerar ett positivt sentiment, kan vi få en uppfattning om det övergripande institutionella sentimentet genom att plotta förhållandet mellan säljoptioner och köpoptioner. Diagrammet till höger visar det historiska förhållandet mellan sälj- och köpoptioner för detta instrument.
Genom att använda sälj/köp-kvoten som en indikator på aktieägarnas sentiment undviker man en av de största bristerna med att använda det totala institutionella ägandet, nämligen att en betydande del av de förvaltade tillgångarna investeras passivt för att följa index. Passivt förvaltade fonder köper vanligtvis inte optioner, så indikatorn för sälj/köp-kvoten ger en bättre bild av stämningen i aktivt förvaltade fonder.
13F- och NPORT-arkiveringar
Detaljer om 13F-arkiveringar är gratis. Detaljer om NP-arkiveringar kräver ett premiummedlemskap. Gröna rader indikerar nya positioner. Röda rader indikerar stängda positioner. Klicka på länk symbolen för att se hela transaktionshistoriken.
Uppgradera
för att låsa upp premiumdata och exportera till Excel ![]() .
.
| Fil Datum | Källa | Investerare | Typ | Genomsnittligt pris (beräknat) |
Aktier | Δ Aktier (%) |
Rapporterat värde (1000 USD) |
Δ Värde (%) |
Portföljallokering (%) |
|
|---|---|---|---|---|---|---|---|---|---|---|
| 2025-08-12 | 13F | J.w. Cole Advisors, Inc. | 2 825 | 252 | ||||||
| 2025-08-14 | 13F | Citadel Advisors Llc | Put | 3 700 | −48,61 | 330 | −31,03 | |||
| 2025-08-14 | 13F | CoreCap Advisors, LLC | 14 | 0,00 | 1 | |||||
| 2025-08-14 | 13F | Colony Group, LLC | 2 311 | 206 | ||||||
| 2025-07-25 | 13F | Atria Wealth Solutions, Inc. | 4 534 | −40,69 | 404 | −20,36 | ||||
| 2025-07-11 | 13F | Wealth Management Partners, LLC | 16 164 | −3,04 | 1 425 | 29,08 | ||||
| 2025-08-14 | 13F | Citadel Advisors Llc | Call | 15 300 | 21,43 | 1 364 | 63,55 | |||
| 2025-08-12 | 13F | Fairscale Capital, LLC | 1 999 | 0,00 | 194 | 46,97 | ||||
| 2025-07-08 | 13F | Strategic Advocates LLC | 19 113 | 3,70 | 1 704 | 39,56 | ||||
| 2025-08-06 | 13F | Csenge Advisory Group | 9 258 | −23,85 | 736 | −6,36 | ||||
| 2025-08-12 | 13F | SRS Capital Advisors, Inc. | 8 115 | 10,42 | 724 | 48,77 | ||||
| 2025-05-15 | 13F | Hrt Financial Lp | 0 | −100,00 | 0 | |||||
| 2025-08-11 | 13F | Rothschild Investment Llc | 10 | 0,00 | 1 | |||||
| 2025-08-14 | 13F | Wealth Advisors of Tampa Bay, LLC | 0 | −100,00 | 0 | |||||
| 2025-08-15 | 13F | Captrust Financial Advisors | 4 215 | 376 | ||||||
| 2025-08-08 | 13F | Atlantic Trust, LLC | 5 080 | 0,00 | 453 | 34,52 | ||||
| 2025-08-11 | 13F | HighTower Advisors, LLC | 14 852 | 3,02 | 1 324 | 38,64 | ||||
| 2025-08-05 | 13F | Fourth Dimension Wealth, LLC | 1 | 0,00 | 0 | |||||
| 2025-07-22 | 13F | Powell Investment Advisors, LLC | 865 | 77 | ||||||
| 2025-08-12 | 13F | Steward Partners Investment Advisory, Llc | 5 132 | −30,30 | 458 | −6,16 | ||||
| 2025-07-17 | 13F | Investment Research & Advisory Group, Inc. | 32 | 3 | ||||||
| 2025-08-14 | 13F | Glen Eagle Advisors, LLC | 90 | 0,00 | 8 | 60,00 | ||||
| 2025-05-16 | 13F | Coppell Advisory Solutions LLC | 0 | −100,00 | 0 | |||||
| 2025-08-11 | 13F | Western Wealth Management, LLC | 2 853 | −6,76 | 254 | 7,63 | ||||
| 2025-08-13 | 13F | StoneX Group Inc. | 2 815 | −10,35 | 251 | 20,67 | ||||
| 2025-08-11 | 13F | Aptus Capital Advisors, LLC | 8 | 0,00 | 1 | |||||
| 2025-08-14 | 13F | Harwood Advisory Group, LLC | 132 | −1,49 | 12 | 10,00 | ||||
| 2025-08-18 | 13F/A | National Bank Of Canada /fi/ | 595 | −38,85 | 53 | −17,19 | ||||
| 2025-07-14 | 13F | Armstrong Advisory Group, Inc | 107 | 10 | ||||||
| 2025-08-07 | 13F | Montag A & Associates Inc | 298 | 0,00 | 27 | 36,84 | ||||
| 2025-05-06 | 13F | Rsm Us Wealth Management Llc | 0 | −100,00 | 0 | |||||
| 2025-08-13 | 13F | IAG Wealth Partners, LLC | 797 | 0,00 | 71 | 36,54 | ||||
| 2025-07-15 | 13F | Mather Group, Llc. | 6 429 | 0,00 | 573 | 34,82 | ||||
| 2025-07-17 | 13F | Saxon Interests, Inc. | 4 344 | 0,00 | 288 | 0,00 | ||||
| 2025-07-31 | 13F | Whipplewood Advisors, LLC | 0 | −100,00 | 0 | |||||
| 2025-05-02 | 13F | Transcendent Capital Group LLC | 0 | −100,00 | 0 | |||||
| 2025-08-15 | 13F | First Heartland Consultants, Inc. | 0 | −100,00 | 0 | |||||
| 2025-08-12 | 13F | Park Square Financial Group, LLC | 0 | −100,00 | 0 | |||||
| 2025-08-18 | 13F | Geneos Wealth Management Inc. | 767 | 539,17 | 68 | 871,43 | ||||
| 2025-08-12 | 13F | Wood Tarver Financial Group, LLC | 299 | 0,00 | 0 | −100,00 | ||||
| 2025-08-13 | 13F | Mount Yale Investment Advisors, LLC | 12 | 1 | ||||||
| 2025-08-18 | 13F | Wolverine Trading, Llc | Put | 2 500 | 221 | |||||
| 2025-07-08 | 13F | Nbc Securities, Inc. | 1 750 | −39,88 | 0 | |||||
| 2025-07-14 | 13F | Abound Wealth Management | 0 | −100,00 | 0 | |||||
| 2025-08-18 | 13F | Wolverine Trading, Llc | Call | 8 100 | 716 | |||||
| 2025-08-14 | 13F | Murphy & Mullick Capital Management Corp | 70 | 0,00 | 6 | 50,00 | ||||
| 2025-08-13 | 13F | Scotia Capital Inc. | 3 207 | 0,63 | 286 | 35,07 | ||||
| 2025-08-11 | 13F/A | Purus Wealth Management, LLC | 6 869 | −0,04 | 612 | 34,51 | ||||
| 2025-07-23 | 13F | Nbt Bank N A /ny | 126 | 0,00 | 11 | 37,50 | ||||
| 2025-05-16 | 13F/A | Kestra Investment Management, LLC | 0 | −100,00 | 0 | |||||
| 2025-07-29 | 13F | JTC Employer Solutions Trusteee Ltd | 2 165 | 0,00 | 0 | |||||
| 2025-07-31 | 13F | Oppenheimer Asset Management Inc. | 8 221 | 0,88 | 733 | 35,99 | ||||
| 2025-05-15 | 13F | Barclays Plc | 0 | −100,00 | 0 | |||||
| 2025-07-17 | 13F | Eagle Wealth Strategies Llc | 3 026 | 270 | ||||||
| 2025-08-06 | 13F | Commonwealth Equity Services, Llc | 48 179 | −5,67 | 4 | 33,33 | ||||
| 2025-05-12 | 13F | Kohmann Bosshard Financial Services, LLC | 0 | −100,00 | 0 | |||||
| 2025-05-13 | 13F | EverSource Wealth Advisors, LLC | 0 | −100,00 | 0 | |||||
| 2025-07-22 | 13F | Mascoma Wealth Management LLC | 0 | −100,00 | 0 | |||||
| 2025-08-11 | 13F | TD Waterhouse Canada Inc. | 215 | −20,96 | 19 | 5,56 | ||||
| 2025-08-14 | 13F | Wells Fargo & Company/mn | 187 515 | 16,35 | 16 721 | 56,58 | ||||
| 2025-05-13 | 13F | Tyler-Stone Wealth Management | 0 | −100,00 | 0 | |||||
| 2025-08-11 | 13F | Principal Securities, Inc. | 711 | −15,46 | 63 | −3,08 | ||||
| 2025-08-12 | 13F | Archer Investment Corp | 105 | 0,00 | 9 | 50,00 | ||||
| 2025-08-14 | 13F | Smartleaf Asset Management LLC | 77 | 7 | ||||||
| 2025-07-16 | 13F/A | CX Institutional | 21 | 0 | ||||||
| 2025-08-06 | 13F | Aspect Partners, LLC | 0 | −100,00 | 0 | |||||
| 2025-04-08 | 13F | Parallel Advisors, LLC | 0 | −100,00 | 0 | |||||
| 2025-08-14 | 13F | Susquehanna International Group, Llp | 31 375 | −14,05 | 2 798 | 15,67 | ||||
| 2025-07-24 | 13F | Us Bancorp \de\ | 2 366 | 0,00 | 211 | 34,62 | ||||
| 2025-08-14 | 13F | Susquehanna International Group, Llp | Put | 2 300 | 205 | |||||
| 2025-08-14 | 13F | Susquehanna International Group, Llp | Call | 9 600 | 856 | |||||
| 2025-07-16 | 13F | Signaturefd, Llc | 2 505 | 2,00 | 223 | 37,65 | ||||
| 2025-07-17 | 13F | Global Trust Asset Management, LLC | 550 | 175,00 | 49 | 276,92 | ||||
| 2025-07-25 | 13F | Cwm, Llc | 21 175 | 1,26 | 2 | 0,00 | ||||
| 2025-07-18 | 13F | Truist Financial Corp | 22 287 | 568,08 | 1 987 | 799,10 | ||||
| 2025-08-12 | 13F | Jaffetilchin Investment Partners, LLC | 4 002 | 357 | ||||||
| 2025-05-12 | 13F | Simplex Trading, Llc | 0 | −100,00 | 0 | |||||
| 2025-08-07 | 13F | Kestra Private Wealth Services, Llc | 2 602 | 232 | ||||||
| 2025-08-14 | 13F | DHK Financial Advisors, Inc. | 10 425 | 0,00 | 930 | 34,64 | ||||
| 2025-05-15 | 13F | Citadel Advisors Llc | 0 | −100,00 | 0 | −100,00 | ||||
| 2025-08-13 | 13F | Kilter Group LLC | 397 | 35 | ||||||
| 2025-08-05 | 13F | Huntington National Bank | 21 | 40,00 | ||||||
| 2025-08-14 | 13F | Marshall Investment Management, Llc | 0 | −100,00 | 0 | |||||
| 2025-07-16 | 13F | Essex Financial Services, Inc. | 2 923 | 261 | ||||||
| 2025-08-01 | 13F | Envestnet Asset Management Inc | 40 626 | 79,06 | 3 623 | 140,98 | ||||
| 2025-04-25 | 13F | WASHINGTON TRUST Co | 0 | −100,00 | 0 | |||||
| 2025-07-28 | 13F | BRYN MAWR TRUST Co | 0 | −100,00 | 0 | |||||
| 2025-08-01 | 13F | Bessemer Group Inc | 12 | 0,00 | 0 | |||||
| 2025-07-18 | 13F | PFG Investments, LLC | 3 600 | 321 | ||||||
| 2025-08-13 | 13F | Northwestern Mutual Wealth Management Co | 3 644 | 20,03 | 325 | 61,19 | ||||
| 2025-07-21 | 13F | Credential Qtrade Securities Inc. | 0 | −100,00 | 0 | −100,00 | ||||
| 2025-07-23 | 13F | West Paces Advisors Inc. | 0 | −100,00 | 0 | |||||
| 2025-08-01 | 13F | Gwn Securities Inc. | 0 | −100,00 | 0 | |||||
| 2025-08-14 | 13F | Atomi Financial Group, Inc. | 10 036 | −2,92 | 895 | 30,70 | ||||
| 2025-08-11 | 13F | Blue Bell Private Wealth Management, Llc | 12 | 0,00 | 1 | |||||
| 2025-07-21 | 13F | Barrett & Company, Inc. | 247 | 0,00 | 22 | 37,50 | ||||
| 2025-08-08 | 13F | Advyzon Investment Management, LLC | 5 892 | 2,68 | 525 | 38,16 | ||||
| 2025-08-12 | 13F | Global Retirement Partners, LLC | 2 446 | 318,12 | 218 | 384,44 | ||||
| 2025-08-14 | 13F | Raymond James Financial Inc | 52 518 | 12,51 | 4 683 | 51,46 | ||||
| 2025-08-14 | 13F | Stifel Financial Corp | 17 731 | 25,47 | 1 581 | 68,91 | ||||
| 2025-03-21 | 13F | Prostatis Group LLC | 0 | −100,00 | 0 | |||||
| 2025-08-05 | 13F | Financial Sense Advisors, Inc. | 40 205 | 3 585 | ||||||
| 2025-08-15 | 13F | North Ridge Wealth Advisors, Inc. | 0 | −100,00 | 0 | |||||
| 2025-08-13 | 13F | Navis Wealth Advisors, LLC | 5 419 | 0,00 | 483 | 34,54 | ||||
| 2025-07-21 | 13F | DHJJ Financial Advisors, Ltd. | 1 | 0,00 | 0 | |||||
| 2025-08-04 | 13F | Roble, Belko & Company, Inc | 119 | 0 | ||||||
| 2025-08-14 | 13F | Heritage Wealth Management, Inc. | 2 709 | 242 | ||||||
| 2025-08-15 | 13F | Kestra Advisory Services, LLC | 15 895 | 2,65 | 1 417 | 38,11 | ||||
| 2025-05-02 | 13F | Capital A Wealth Management, LLC | 126 | −82,83 | 8 | −85,71 | ||||
| 2025-07-15 | 13F | Financial Management Professionals, Inc. | 352 | 0,00 | 31 | 34,78 | ||||
| 2025-08-11 | 13F | One Capital Management, LLC | 6 798 | 47,43 | 606 | 98,69 | ||||
| 2025-08-01 | 13F | Rossby Financial, LCC | 61 | 144,00 | 5 | 400,00 | ||||
| 2025-08-14 | 13F | Comerica Bank | 100 | −45,65 | 9 | −33,33 | ||||
| 2025-08-14 | 13F | GWM Advisors LLC | 6 992 | 44,58 | 623 | 94,69 | ||||
| 2025-08-12 | 13F | Prudential Plc | 78 450 | 23,84 | 6 995 | 66,67 | ||||
| 2025-08-14 | 13F | Qube Research & Technologies Ltd | 0 | −100,00 | 0 | |||||
| 2025-08-04 | 13F | Atria Investments Llc | 0 | −100,00 | 0 | |||||
| 2025-05-14 | 13F | Group One Trading, L.p. | 0 | −100,00 | 0 | −100,00 | ||||
| 2025-07-17 | 13F | Avondale Wealth Management | 345 | 0,00 | 31 | 36,36 | ||||
| 2025-08-05 | 13F | Bank of New York Mellon Corp | 14 972 | 0,00 | 1 335 | 34,58 | ||||
| 2025-08-14 | 13F | Jane Street Group, Llc | Put | 7 200 | −76,77 | 642 | −68,74 | |||
| 2025-08-14 | 13F | Jane Street Group, Llc | Call | 24 500 | 5,60 | 2 185 | 42,09 | |||
| 2025-09-04 | 13F/A | Advisor Group Holdings, Inc. | 28 299 | 19,02 | 2 524 | 60,25 | ||||
| 2025-08-12 | 13F | LPL Financial LLC | 310 658 | 30,21 | 27 701 | 75,23 | ||||
| 2025-08-05 | 13F | GPS Wealth Strategies Group, LLC | 35 | 0,00 | 3 | 50,00 | ||||
| 2025-08-08 | 13F | Avantax Advisory Services, Inc. | 37 278 | 39,78 | 3 324 | 88,12 | ||||
| 2025-07-31 | 13F | Cambridge Investment Research Advisors, Inc. | 26 716 | 1,72 | 2 | 100,00 | ||||
| 2025-08-19 | 13F | Advisory Services Network, LLC | 2 086 | 202 | ||||||
| 2025-07-11 | 13F | Kingstone Capital Partners Texas, LLC | 126 153 | 7 | ||||||
| 2025-08-14 | 13F | Sunbelt Securities, Inc. | 146 | 0,00 | 11 | 22,22 | ||||
| 2025-07-09 | 13F | Dynamic Advisor Solutions LLC | 2 813 | 251 | ||||||
| 2025-08-14 | 13F | Mercer Global Advisors Inc /adv | 12 170 | 0,75 | 1 085 | 35,63 | ||||
| 2025-08-07 | 13F | Tacita Capital Inc | 4 600 | 4,55 | 410 | 40,89 | ||||
| 2025-07-10 | 13F | Wealth Enhancement Advisory Services, Llc | 6 229 | 0,10 | 553 | 33,98 | ||||
| 2025-08-14 | 13F | EP Wealth Advisors, Inc. | 3 513 | 313 | ||||||
| 2025-08-14 | 13F | Federation des caisses Desjardins du Quebec | 993 | 0,00 | 89 | 35,38 | ||||
| 2025-08-07 | 13F | Traynor Capital Management, Inc. | 2 794 | 241 | ||||||
| 2025-08-11 | 13F | Covestor Ltd | 5 | 0 | ||||||
| 2025-07-31 | 13F | Wealthfront Advisers Llc | 38 830 | 13,36 | 3 462 | 52,58 | ||||
| 2025-08-11 | 13F | Compass Capital Corp /ma/ /adv | 6 151 | 471 | ||||||
| 2025-08-06 | 13F | First Horizon Advisors, Inc. | 6 311 | −1,16 | 563 | 32,86 | ||||
| 2025-08-07 | 13F | PFG Advisors | 6 006 | 1,69 | 536 | 36,83 | ||||
| 2025-08-13 | 13F | Walleye Capital LLC | 6 910 | −2,15 | 616 | 31,91 | ||||
| 2025-07-09 | 13F | Breakwater Investment Management | 0 | −100,00 | 0 | |||||
| 2025-07-31 | 13F | AlTi Global, Inc. | 12 186 | 0,00 | 1 087 | 34,57 | ||||
| 2025-08-04 | 13F | Whalen Wealth Management Inc. | 2 941 | 262 | ||||||
| 2025-07-11 | 13F | Farther Finance Advisors, LLC | 3 303 | −1,96 | 295 | 31,25 | ||||
| 2025-07-14 | 13F | UMA Financial Services, Inc. | 251 | 24,88 | 22 | 69,23 | ||||
| 2025-08-08 | 13F | Creative Planning | 5 008 | 12,16 | 447 | 51,19 | ||||
| 2025-08-11 | 13F | Private Advisor Group, LLC | 46 486 | 26,10 | 4 145 | 69,74 | ||||
| 2025-07-14 | 13F | Painted Porch Advisors LLC | 0 | −100,00 | 0 | −100,00 | ||||
| 2025-07-16 | 13F | Highline Wealth Partners Llc | 649 | −80,84 | 58 | −74,55 | ||||
| 2025-08-14 | 13F | Cubist Systematic Strategies, LLC | 6 992 | 623 | ||||||
| 2025-07-03 | 13F | Garde Capital, Inc. | 8 | 0,00 | 1 | |||||
| 2025-05-06 | 13F | Advisors Preferred, LLC | 0 | −100,00 | 0 | |||||
| 2025-08-08 | 13F | Cetera Investment Advisers | 20 852 | 1,19 | 1 859 | 36,19 | ||||
| 2025-08-14 | 13F | DRW Securities, LLC | Put | 187 000 | 15,01 | 16 675 | 54,78 | |||
| 2025-08-14 | 13F | DRW Securities, LLC | 10 405 | −80,03 | 928 | −73,14 | ||||
| 2025-08-14 | 13F | Fwl Investment Management, Llc | 684 | 61 | ||||||
| 2025-08-14 | 13F | Bank Of America Corp /de/ | 579 927 | −5,01 | 51 712 | 27,84 | ||||
| 2025-05-12 | 13F | Sandy Spring Bank | 48 | 0,00 | 3 | 0,00 | ||||
| 2025-08-12 | 13F | WealthTrak Capital Management LLC | 23 | 0,00 | 2 | 100,00 | ||||
| 2025-04-11 | 13F | Insight Advisors, LLC/ PA | 0 | −100,00 | 0 | |||||
| 2025-08-12 | 13F | Pathstone Holdings, LLC | 2 485 | 222 | ||||||
| 2025-05-19 | 13F/A | Jane Street Group, Llc | 0 | −100,00 | 0 | −100,00 | ||||
| 2025-08-14 | 13F | UBS Group AG | 20 333 | −57,85 | 1 813 | −43,26 | ||||
| 2025-05-08 | NP | QALTX - Quantified Alternative Investment Fund Investor Class Shares | 0 | −100,00 | 0 | −100,00 | ||||
| 2025-08-14 | 13F | Mml Investors Services, Llc | 12 697 | 8,12 | 1 | |||||
| 2025-07-17 | 13F | Wolff Wiese Magana Llc | 35 | 0,00 | 3 | 50,00 | ||||
| 2025-08-14 | 13F | NCP Inc. | 0 | −100,00 | 0 | |||||
| 2025-08-14 | 13F | Oxford Financial Group Ltd | 1 436 | 0,00 | 128 | 34,74 | ||||
| 2025-09-02 | 13F | Pvg Asset Management Corp | 5 612 | 500 | ||||||
| 2025-07-28 | 13F | Kiker Wealth Management, LLC | 0 | −100,00 | 0 | |||||
| 2025-07-29 | 13F | Activest Wealth Management | 190 | −58,70 | 17 | −46,67 | ||||
| 2025-08-13 | 13F | Green Harvest Asset Management LLC | 2 903 | 259 | ||||||
| 2025-08-13 | 13F | Crescent Grove Advisors, LLC | 13 088 | 2,22 | 1 167 | 37,62 | ||||
| 2025-05-09 | 13F | Headlands Technologies LLC | 0 | −100,00 | 0 | |||||
| 2025-08-06 | 13F | Atlantic Union Bankshares Corp | 48 | 4 | ||||||
| 2025-07-17 | 13F | Nelson, Van Denburg & Campbell Wealth Management Group, LLC | 2 520 | 225 | ||||||
| 2025-08-04 | 13F | Spire Wealth Management | 3 786 | −8,17 | 338 | 23,44 | ||||
| 2025-08-12 | 13F | Insigneo Advisory Services, Llc | 2 262 | 202 | ||||||
| 2025-08-14 | 13F | Mariner, LLC | 9 902 | −3,73 | 883 | 29,52 | ||||
| 2025-08-14 | 13F | D. E. Shaw & Co., Inc. | 6 556 | 65,81 | 585 | 123,75 | ||||
| 2025-07-30 | 13F | Capstone Triton Financial Group, LLC | 0 | −100,00 | 0 | |||||
| 2025-08-12 | 13F | Boreal Capital Management LLC | 150 | 13 | ||||||
| 2025-08-05 | 13F | Key FInancial Inc | 350 | 31 | ||||||
| 2025-08-13 | 13F | Renaissance Technologies Llc | 2 500 | −81,06 | 223 | −74,60 | ||||
| 2025-05-13 | 13F | Hartland & Co., LLC | 0 | −100,00 | 0 | |||||
| 2025-08-12 | 13F | Franklin Resources Inc | 1 500 | 134 | ||||||
| 2025-08-13 | 13F | Russell Investments Group, Ltd. | 150 | 417,24 | 13 | 1 200,00 | ||||
| 2025-07-29 | 13F | Stratos Wealth Partners, LTD. | 3 722 | 332 | ||||||
| 2025-07-28 | 13F | Harbour Investments, Inc. | 354 | 0,00 | 32 | 34,78 | ||||
| 2025-08-04 | 13F | Creative Financial Designs Inc /adv | 18 | 0,00 | 2 | 0,00 | ||||
| 2025-08-05 | 13F | Sigma Planning Corp | 3 172 | −19,96 | 283 | 7,63 | ||||
| 2025-08-07 | 13F | Allworth Financial LP | 2 045 | 0,00 | 182 | 30,00 | ||||
| 2025-08-04 | 13F | Integrity Alliance, Llc. | 0 | −100,00 | 0 | |||||
| 2025-08-08 | 13F | Tortoise Investment Management, LLC | 60 | 0,00 | 5 | 66,67 | ||||
| 2025-08-05 | 13F | Scarborough Advisors, LLC | 425 | 38 | ||||||
| 2025-08-15 | 13F | Morgan Stanley | 411 262 | 30,68 | 36 672 | 75,87 | ||||
| 2025-07-08 | 13F | Granite Bay Wealth Management, LLC | 3 300 | 0 | ||||||
| 2025-08-08 | 13F | Larson Financial Group LLC | 16 | 0,00 | 1 | 0,00 | ||||
| 2025-04-28 | 13F | Mutual Advisors, LLC | 0 | −100,00 | 0 | −100,00 | ||||
| 2025-07-17 | 13F | Beacon Capital Management, LLC | 337 | 0,00 | 30 | 36,36 | ||||
| 2025-07-30 | 13F | Brookstone Capital Management | 60 604 | −3,78 | 5 404 | 29,50 | ||||
| 2025-07-28 | 13F | Copia Wealth Management | 4 969 | −1,21 | 443 | 33,03 | ||||
| 2025-07-11 | 13F | Adirondack Trust Co | 28 | 0,00 | 2 | 100,00 | ||||
| 2025-08-12 | 13F | Marshall & Sterling Wealth Advisors Inc. | 172 | 0,58 | 15 | 36,36 | ||||
| 2025-05-12 | 13F | Citigroup Inc | 0 | −100,00 | 0 | |||||
| 2025-08-12 | 13F | CIBC Private Wealth Group, LLC | 86 | 0,00 | 8 | 40,00 | ||||
| 2025-08-19 | 13F | Newbridge Financial Services Group, Inc. | 9 679 | 863 | ||||||
| 2025-07-31 | 13F | Hartford Financial Management Inc. | 32 515 | −1,25 | 2 899 | 32,92 | ||||
| 2025-07-24 | 13F | IFP Advisors, Inc | 40 | 0,00 | 4 | 50,00 | ||||
| 2025-07-18 | 13F | SOA Wealth Advisors, LLC. | 276 | 0,00 | 25 | 33,33 | ||||
| 2025-07-22 | 13F | Belpointe Asset Management LLC | 4 406 | −1,12 | 393 | 32,88 | ||||
| 2025-04-24 | 13F | Decker Retirement Planning Inc. | 0 | −100,00 | 0 | |||||
| 2025-08-29 | 13F | Centaurus Financial, Inc. | 1 214 | −20,39 | 0 | |||||
| 2025-07-22 | 13F | Wealthcare Advisory Partners LLC | 2 509 | 224 | ||||||
| 2025-08-08 | 13F | Glassman Wealth Services | 200 | 0,00 | 18 | 30,77 | ||||
| 2025-08-11 | 13F | Hexagon Capital Partners LLC | 0 | −100,00 | 0 | |||||
| 2025-07-17 | 13F | Albion Financial Group /ut | 55 | 0,00 | 5 | 33,33 | ||||
| 2025-07-24 | 13F | Ronald Blue Trust, Inc. | 743 | −48,69 | 66 | −30,53 | ||||
| 2025-05-15 | 13F | Tower Research Capital LLC (TRC) | 0 | −100,00 | 0 | |||||
| 2025-07-23 | 13F | Gerber, Llc | 2 392 | 213 | ||||||
| 2025-07-30 | 13F | Financial Perspectives, Inc | 427 | −62,84 | 38 | −50,00 | ||||
| 2025-08-11 | 13F | Strategic Wealth Partners, Ltd. | 222 | 20 | ||||||
| 2025-07-10 | 13F | Oliver Lagore Vanvalin Investment Group | 2 | 0,00 | 0 | |||||
| 2025-08-08 | 13F | United Asset Strategies, Inc. | 3 847 | 0,00 | 343 | 35,04 | ||||
| 2025-07-15 | 13F | EWG Elevate Inc. | 49 338 | 4 399 | ||||||
| 2025-07-30 | 13F | Strategic Blueprint, LLC | 5 051 | 0,26 | 450 | 35,14 | ||||
| 2025-07-30 | 13F | Princeton Global Asset Management LLC | 40 | 0,00 | 4 | 50,00 | ||||
| 2025-08-12 | 13F | MAI Capital Management | 1 592 | 0,51 | 142 | 35,58 | ||||
| 2025-05-08 | 13F | Harvest Fund Management Co., Ltd | 0 | −100,00 | 0 | |||||
| 2025-08-06 | 13F | AE Wealth Management LLC | 1 193 | −28,00 | 106 | −2,75 | ||||
| 2025-08-12 | 13F | Proequities, Inc. | 0 | 0 | ||||||
| 2025-07-14 | 13F | AdvisorNet Financial, Inc | 280 | 0,00 | 25 | 33,33 | ||||
| 2025-08-06 | 13F | Golden State Wealth Management, LLC | 229 | 172,62 | 20 | 300,00 | ||||
| 2025-08-14 | 13F | Royal Bank Of Canada | 14 478 | −55,48 | 1 291 | −40,09 | ||||
| 2025-08-08 | 13F | Pnc Financial Services Group, Inc. | 1 219 | 0,00 | 109 | 35,00 | ||||
| 2025-07-10 | 13F | Peoples Bank/KS | 0 | −100,00 | 0 | |||||
| 2025-07-21 | 13F | Ameritas Advisory Services, LLC | 304 | 27 | ||||||
| 2025-04-23 | 13F | Financial Life Planners | 0 | −100,00 | 0 | |||||
| 2025-08-12 | 13F | Jpmorgan Chase & Co | 33 217 | 0,06 | 2 962 | 34,65 |