Grundläggande statistik
| Institutionella ägare | 191 total, 191 long only, 0 short only, 0 long/short - change of 15,76% MRQ |
| Genomsnittlig portföljallokering | 0.4178 % - change of −2,65% MRQ |
| Institutionella aktier (lång) | 16 670 799 (ex 13D/G) - change of 1,37MM shares 8,95% MRQ |
| Institutionellt värde (lång) | $ 510 300 USD ($1000) |
Institutionellt ägande och aktieägare
Goldman Sachs Physical Gold ETF (US:AAAU) har 191 Institutionella ägare och aktieägare som har lämnat in 13D/G- eller 13F-formulär till Securities Exchange Commission (SEC). Dessa institut innehar totalt 16,670,799 aktier. Största aktieägare inkluderar Wellspring Financial Advisors, LLC, Quadrature Capital Ltd, LPL Financial LLC, Advisor Group Holdings, Inc., Proficio Capital Partners LLC, Raymond James Financial Inc, Exchange Traded Concepts, Llc, Royal Bank Of Canada, Mirae Asset Global Investments Co., Ltd., and TDSC - Cabana Target Drawdown 10 ETF .
Goldman Sachs Physical Gold ETF (BATS:AAAU) Institutionell ägarstruktur visar institutioners och fonders nuvarande positioner i företaget, samt de senaste förändringarna i positionernas storlek. Större aktieägare kan vara enskilda investerare, fonder, hedgefonder eller institutioner. Bilaga 13D visar att investeraren äger (eller ägde) mer än 5% av företaget och avser (eller avsåg) att aktivt eftersträva en förändring av affärsstrategin. Schedule 13G indikerar en passiv investering på över 5%.
The share price as of September 12, 2025 is 35,98 / share. Previously, on September 16, 2024, the share price was 25,54 / share. This represents an increase of 40,87% over that period.

Fondsentimentets poäng
Fondsentimentet poängen(fka Ägarackumulation-poäng) visar vilka aktier som är mest köpta av fonder. Det är resultatet av en sofistikerad kvantitativ flerfaktormodell som identifierar företag med de högsta nivåerna av institutionell ackumulering. Poängsättningsmodellen använder en kombination av den totala ökningen av redovisade ägare, förändringarna i portföljallokeringarna för dessa ägare och andra mått. Siffran sträcker sig från 0 till 100, där högre siffror indikerar en högre nivå av ackumulering i förhållande till sina konkurrenter, och 50 är genomsnittet.
Uppdateringsfrekvens: Dagligen
Se Ownership Explorer, som innehåller en lista över de högst rankade företagen.
Institutionell sälj/köp-kvot
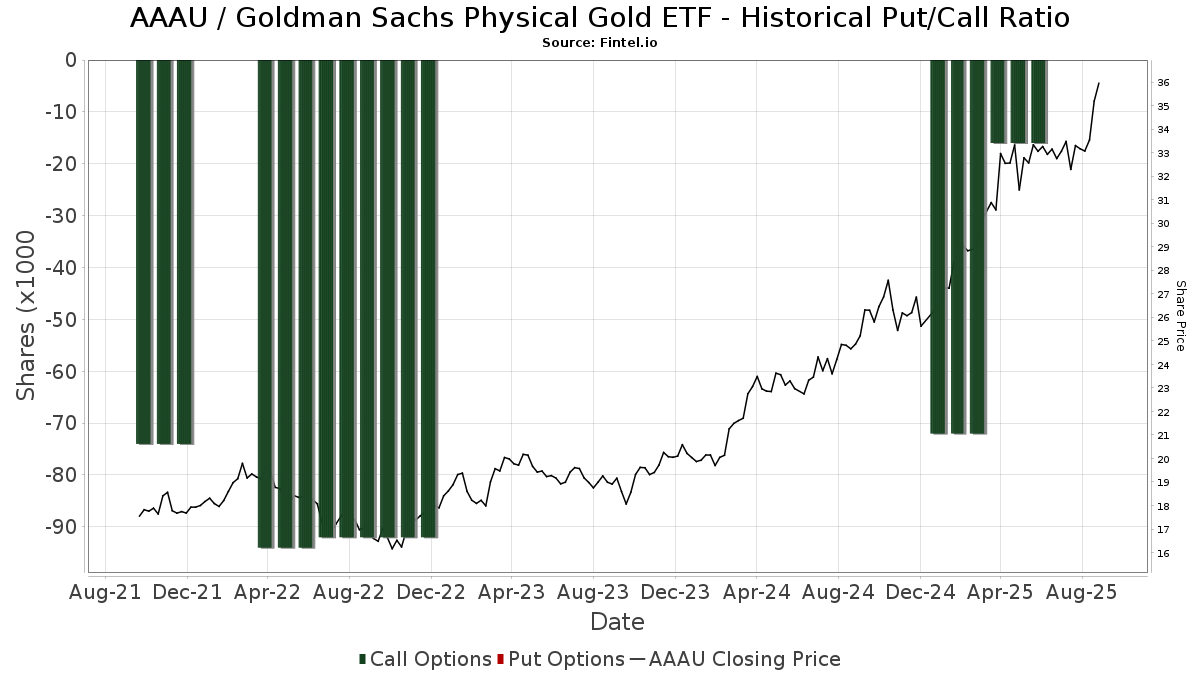
Förutom att rapportera vanliga eget kapital- och skuldemissioner måste institutioner med mer än 100MM tillgångar under förvaltning också avslöja sina innehav av sälj- och köpoptioner. Eftersom säljoptioner i allmänhet indikerar ett negativt sentiment och köpoptioner indikerar ett positivt sentiment, kan vi få en uppfattning om det övergripande institutionella sentimentet genom att plotta förhållandet mellan säljoptioner och köpoptioner. Diagrammet till höger visar det historiska förhållandet mellan sälj- och köpoptioner för detta instrument.
Genom att använda sälj/köp-kvoten som en indikator på aktieägarnas sentiment undviker man en av de största bristerna med att använda det totala institutionella ägandet, nämligen att en betydande del av de förvaltade tillgångarna investeras passivt för att följa index. Passivt förvaltade fonder köper vanligtvis inte optioner, så indikatorn för sälj/köp-kvoten ger en bättre bild av stämningen i aktivt förvaltade fonder.
13F- och NPORT-arkiveringar
Detaljer om 13F-arkiveringar är gratis. Detaljer om NP-arkiveringar kräver ett premiummedlemskap. Gröna rader indikerar nya positioner. Röda rader indikerar stängda positioner. Klicka på länk symbolen för att se hela transaktionshistoriken.
Uppgradera
för att låsa upp premiumdata och exportera till Excel ![]() .
.
| Fil Datum | Källa | Investerare | Typ | Genomsnittligt pris (beräknat) |
Aktier | Δ Aktier (%) |
Rapporterat värde (1000 USD) |
Δ Värde (%) |
Portföljallokering (%) |
|
|---|---|---|---|---|---|---|---|---|---|---|
| 2025-08-08 | 13F | IMA Wealth, Inc. | 382 | 12 | ||||||
| 2025-08-14 | 13F | Clg Llc | 87 962 | 7,07 | 2 875 | 13,33 | ||||
| 2025-08-14 | 13F/A | Rockefeller Capital Management L.P. | 72 920 | −18,82 | 2 383 | −14,06 | ||||
| 2025-08-13 | 13F | Renaissance Technologies Llc | 91 500 | −87,44 | 2 990 | −86,71 | ||||
| 2025-08-06 | 13F | Legacy Wealth Managment, LLC/ID | 1 | 0 | ||||||
| 2025-07-31 | 13F | Cambridge Investment Research Advisors, Inc. | 293 640 | −8,81 | 10 | 0,00 | ||||
| 2025-08-15 | 13F | Morgan Stanley | 21 208 | 46,62 | 693 | 55,38 | ||||
| 2025-07-29 | 13F | Kanawha Capital Management Llc | 0 | −100,00 | 0 | |||||
| 2025-08-05 | 13F | Simplex Trading, Llc | 17 974 | 120,00 | 1 | |||||
| 2025-07-21 | 13F | Ameriflex Group, Inc. | 5 861 | 10,09 | 193 | 17,07 | ||||
| 2025-08-12 | 13F | LPL Financial LLC | 770 515 | 9,89 | 25 180 | 16,30 | ||||
| 2025-07-29 | 13F | Private Trust Co Na | 2 308 | 113,31 | 75 | 127,27 | ||||
| 2025-07-23 | 13F | Spectrum Asset Management, Inc. (NB/CA) | 71 360 | 2 332 | ||||||
| 2025-07-25 | 13F | Prostatis Group LLC | 23 157 | 19,16 | 757 | 26,00 | ||||
| 2025-08-08 | 13F | Compass Financial Services Inc | 1 635 | 0,00 | 53 | 6,00 | ||||
| 2025-08-12 | 13F | Osborne Partners Capital Management, Llc | 300 209 | −7,48 | 9 811 | −2,10 | ||||
| 2025-07-29 | 13F | Koshinski Asset Management, Inc. | 0 | −100,00 | 0 | |||||
| 2025-07-29 | 13F | Horst & Graben Wealth Management LLC | 16 553 | 541 | ||||||
| 2025-08-08 | 13F | Fortis Group Advisors, LLC | 107 180 | −17,68 | 3 482 | −13,38 | ||||
| 2025-08-14 | 13F | Arete Wealth Advisors, LLC | 70 879 | 7,35 | 2 | 0,00 | ||||
| 2025-08-14 | 13F | Cantor Fitzgerald, L. P. | 6 400 | 209 | ||||||
| 2025-08-12 | 13F | Jpmorgan Chase & Co | 73 967 | 52,88 | 2 417 | 61,78 | ||||
| 2025-05-02 | 13F | Armor Investment Advisors, LLC | 0 | −100,00 | 0 | −100,00 | ||||
| 2025-08-14 | 13F | Two Sigma Securities, Llc | 7 729 | 253 | ||||||
| 2025-07-25 | 13F | Concurrent Investment Advisors, LLC | 13 538 | 0,00 | 442 | 5,74 | ||||
| 2025-07-22 | 13F | Joule Financial, LLC | 0 | −100,00 | 0 | |||||
| 2025-09-04 | 13F/A | Advisor Group Holdings, Inc. | 716 080 | −15,63 | 23 401 | −10,71 | ||||
| 2025-07-10 | 13F | Oliver Lagore Vanvalin Investment Group | 172 548 | −31,07 | 5 328 | −17,93 | ||||
| 2025-07-10 | 13F | Wealth Enhancement Advisory Services, Llc | 9 363 | 308 | ||||||
| 2025-08-11 | 13F | Private Advisor Group, LLC | 18 804 | 36,21 | 615 | 44,13 | ||||
| 2025-08-14 | 13F | Fmr Llc | 5 488 | −30,99 | 179 | −26,94 | ||||
| 2025-08-14 | 13F | Susquehanna International Group, Llp | 29 219 | 955 | ||||||
| 2025-07-16 | 13F | True North Advisors, LLC | 20 020 | 654 | ||||||
| 2025-08-12 | 13F | Kimelman & Baird, LLC | 225 | 0,00 | 7 | 16,67 | ||||
| 2025-08-14 | 13F | Gould Capital, LLC | 98 | 0,00 | 3 | 0,00 | ||||
| 2025-04-21 | 13F | SILVER OAK SECURITIES, Inc | 0 | −100,00 | 0 | |||||
| 2025-08-06 | 13F | Golden State Wealth Management, LLC | 0 | −100,00 | 0 | −100,00 | ||||
| 2025-07-15 | 13F | Mather Group, Llc. | 0 | −100,00 | 0 | |||||
| 2025-08-15 | 13F | Equitable Holdings, Inc. | 26 660 | 23,43 | 871 | 30,78 | ||||
| 2025-08-01 | 13F | Oarsman Capital, Inc. | 182 412 | 6,06 | 5 961 | 12,26 | ||||
| 2025-05-06 | 13F | Blume Capital Management, Inc. | 0 | −100,00 | 0 | |||||
| 2025-07-16 | 13F | Cambridge Advisors Inc. | 89 462 | 0,23 | 2 924 | 6,06 | ||||
| 2025-09-04 | 13F | Beacon Capital Management, Inc. | 1 309 | 43 | ||||||
| 2025-08-11 | 13F | Regal Investment Advisors LLC | 48 329 | −2,82 | 1 579 | 2,87 | ||||
| 2025-07-17 | 13F | CWA Asset Management Group, LLC | 12 719 | −33,82 | 416 | −30,02 | ||||
| 2025-08-13 | 13F | Northern Trust Corp | 6 435 | 210 | ||||||
| 2025-07-24 | 13F | IFP Advisors, Inc | 11 214 | 0,21 | 366 | 6,09 | ||||
| 2025-05-14 | 13F | Jane Street Group, Llc | 0 | −100,00 | 0 | |||||
| 2025-08-28 | 13F | China Universal Asset Management Co., Ltd. | 232 000 | 23,40 | 7 582 | 30,59 | ||||
| 2025-06-26 | NP | CLSM - Cabana Target Leading Sector Moderate ETF | 330 026 | −69,57 | 10 746 | −50,82 | ||||
| 2025-07-21 | 13F | Matauro, Llc | 28 598 | −3,17 | 935 | 2,52 | ||||
| 2025-08-08 | 13F | Foundations Investment Advisors, LLC | 71 774 | −5,55 | 2 346 | −0,04 | ||||
| 2025-08-11 | 13F | HighTower Advisors, LLC | 249 913 | −0,34 | 8 167 | 5,48 | ||||
| 2025-07-24 | 13F | Us Bancorp \de\ | 4 139 | −10,78 | 135 | −5,59 | ||||
| 2025-08-04 | 13F | Spire Wealth Management | 6 900 | 0,00 | 225 | 5,63 | ||||
| 2025-08-12 | 13F | MAI Capital Management | 6 213 | −12,93 | 203 | −7,73 | ||||
| 2025-08-04 | 13F | Pensionmark Financial Group, Llc | 74 869 | 28,86 | 2 447 | 36,34 | ||||
| 2025-08-14 | 13F | Vivaldi Capital Management, LLC | 138 607 | 4 530 | ||||||
| 2025-07-29 | 13F | Stratos Wealth Advisors, LLC | 10 505 | −71,33 | 343 | −69,67 | ||||
| 2025-08-14 | 13F | Group One Trading, L.p. | 1 564 | 51 | ||||||
| 2025-08-13 | 13F | NEOS Investment Management LLC | 104 666 | 3 420 | ||||||
| 2025-07-29 | 13F | Fundamentun, Llc | 90 344 | 44,18 | 2 952 | 52,64 | ||||
| 2025-08-08 | 13F | Cetera Investment Advisers | 223 326 | −23,97 | 7 298 | −19,54 | ||||
| 2025-08-13 | 13F | Mount Yale Investment Advisors, LLC | 316 | 10 | ||||||
| 2025-07-24 | 13F | SLT Holdings LLC | 15 263 | −28,82 | 499 | −24,77 | ||||
| 2025-08-18 | 13F | Wolverine Trading, Llc | 8 508 | −15,80 | 275 | −10,75 | ||||
| 2025-08-14 | 13F | Mariner, LLC | 99 079 | 1 134,78 | 3 238 | 1 210,53 | ||||
| 2025-08-12 | 13F | WealthTrak Capital Management LLC | 105 763 | −6,54 | 3 456 | −1,09 | ||||
| 2025-08-06 | 13F | Pekin Hardy Strauss, Inc. | 12 200 | 0,00 | 399 | 5,85 | ||||
| 2025-04-14 | 13F | Midland Wealth Advisors Llc | 0 | −100,00 | 0 | −100,00 | ||||
| 2025-04-28 | NP | MPAY - Akros Monthly Payout ETF | 552 | 16 | ||||||
| 2025-08-01 | 13F | Belvedere Trading LLC | 7 323 | 239 | ||||||
| 2025-07-08 | 13F | Arlington Trust Co LLC | 4 512 | 0,00 | 147 | 5,76 | ||||
| 2025-08-01 | 13F | Belvedere Trading LLC | Call | 1 100 | 36 | |||||
| 2025-08-12 | 13F | Park Square Financial Group, LLC | 1 575 | 600,00 | 51 | 750,00 | ||||
| 2025-08-07 | 13F | Resources Investment Advisors, LLC. | 73 218 | −5,69 | 2 393 | −0,21 | ||||
| 2025-07-23 | 13F | Secured Retirement Advisors, Llc | 23 696 | −17,79 | 774 | −13,03 | ||||
| 2025-08-12 | 13F | Global Retirement Partners, LLC | 113 861 | 3,62 | 3 721 | 30,57 | ||||
| 2025-08-13 | 13F | IAG Wealth Partners, LLC | 0 | −100,00 | 0 | |||||
| 2025-08-14 | 13F | Royal Bank Of Canada | 571 038 | −1,59 | 18 662 | 4,15 | ||||
| 2025-08-11 | 13F | Guidance Point Advisors, LLC | 39 752 | −6,19 | 1 299 | −0,69 | ||||
| 2025-08-06 | 13F | Texas Yale Capital Corp. | 15 869 | 1,18 | 519 | 7,02 | ||||
| 2025-05-15 | 13F | GWM Advisors LLC | 0 | −100,00 | 0 | |||||
| 2025-08-14 | 13F | Mml Investors Services, Llc | 53 953 | 3,89 | 2 | 0,00 | ||||
| 2025-07-18 | 13F | Vigilare Wealth Management | 8 157 | 0,70 | 267 | 6,40 | ||||
| 2025-05-20 | 13F | Fortis Capital Advisors, LLC | 0 | −100,00 | 0 | |||||
| 2025-08-21 | 13F | Aveo Capital Partners, LLC | 0 | −100,00 | 0 | |||||
| 2025-07-14 | 13F | Signature Securities Group Corporation | 9 813 | 0,00 | 321 | 5,61 | ||||
| 2025-07-16 | 13F | Colton Groome Financial Advisors, Llc | 251 923 | 4,97 | 8 233 | 5,35 | ||||
| 2025-08-07 | 13F | Proficio Capital Partners LLC | 684 180 | −1,38 | 22 359 | 11,53 | ||||
| 2025-07-11 | 13F | Farther Finance Advisors, LLC | 5 555 | 515,17 | 182 | 570,37 | ||||
| 2025-08-18 | 13F | Hollencrest Capital Management | 3 000 | 0,00 | 98 | 6,52 | ||||
| 2025-05-07 | 13F | Spectrum Wealth Counsel, LLC | 550 | 0,00 | 17 | 14,29 | ||||
| 2025-07-30 | 13F | Brookstone Capital Management | 9 598 | −6,95 | 314 | −1,57 | ||||
| 2025-07-29 | 13F | JTC Employer Solutions Trusteee Ltd | 17 823 | 0,00 | 1 | |||||
| 2025-08-14 | 13F | Colony Group, LLC | 70 479 | −3,84 | 2 303 | 1,77 | ||||
| 2025-08-07 | 13F | Winch Advisory Services, LLC | 147 804 | −1,22 | 4 830 | 4,55 | ||||
| 2025-07-25 | 13F | We Are One Seven, LLC | 11 899 | 0,88 | 389 | 6,59 | ||||
| 2025-08-25 | 13F/A | Neuberger Berman Group LLC | 26 500 | −1,85 | 866 | 3,96 | ||||
| 2025-08-13 | 13F | EverSource Wealth Advisors, LLC | 336 | 0,00 | 11 | 0,00 | ||||
| 2025-08-14 | 13F | Visionary Wealth Advisors | 20 808 | −86,42 | 680 | −85,63 | ||||
| 2025-05-20 | 13F | Belpointe Asset Management LLC | 0 | −100,00 | 0 | |||||
| 2025-08-08 | 13F | Cooper Capital Advisors LLC | 0 | −100,00 | 0 | |||||
| 2025-08-05 | 13F | C2P Capital Advisory Group, LLC d.b.a. Prosperity Capital Advisors | 0 | −100,00 | 0 | |||||
| 2025-08-05 | 13F | Fourth Dimension Wealth, LLC | 2 057 | 0,00 | 67 | 6,35 | ||||
| 2025-07-30 | 13F | Drive Wealth Management, Llc | 16 000 | 523 | ||||||
| 2025-06-26 | NP | TDSC - Cabana Target Drawdown 10 ETF | 436 533 | −36,54 | 14 214 | 2,57 | ||||
| 2025-08-14 | 13F | Stifel Financial Corp | 287 903 | 48,93 | 9 409 | 57,61 | ||||
| 2025-08-11 | 13F | Principal Securities, Inc. | 822 | 26,66 | 27 | 62,50 | ||||
| 2025-08-13 | 13F | Twin Peaks Wealth Advisors, LLC | 208 | 7 | ||||||
| 2025-08-04 | 13F | Haven Private, LLC | 61 955 | −7,42 | 2 025 | −2,03 | ||||
| 2025-07-23 | 13F | Capstone Wealth Management Group, Llc | 0 | −100,00 | 0 | |||||
| 2025-08-18 | 13F | Geneos Wealth Management Inc. | 155 490 | −13,41 | 5 081 | −8,37 | ||||
| 2025-07-08 | 13F | Moulton Wealth Management, Inc | 181 939 | −20,70 | 5 992 | −15,42 | ||||
| 2025-08-13 | 13F | Cerity Partners LLC | 113 484 | 0,31 | 3 709 | 6,16 | ||||
| 2025-07-23 | 13F | Vontobel Holding Ltd. | 10 000 | −12,90 | 327 | −7,91 | ||||
| 2025-07-02 | 13F | Capital Market Strategies LLC | 23 258 | −16,21 | 760 | −11,32 | ||||
| 2025-08-14 | 13F | Modern Wealth Management, LLC | 8 200 | −18,00 | 268 | −13,31 | ||||
| 2025-04-29 | 13F | Truist Financial Corp | 0 | −100,00 | 0 | |||||
| 2025-08-15 | 13F | Fft Wealth Management Llc | 6 000 | 201 | ||||||
| 2025-08-06 | 13F | Legacy Investment Solutions, LLC | 1 | 0 | ||||||
| 2025-08-12 | 13F | Cutter & CO Brokerage, Inc. | 0 | −100,00 | 0 | |||||
| 2025-07-22 | 13F | Simplicity Wealth,LLC | 0 | −100,00 | 0 | |||||
| 2025-08-14 | 13F | Bank Of America Corp /de/ | 0 | −100,00 | 0 | |||||
| 2025-04-23 | 13F/A | Mascagni Wealth Management, Inc. | 9 109 | 0,00 | 281 | 0,00 | ||||
| 2025-07-11 | 13F | Grove Bank & Trust | 147 | 0,00 | 5 | 0,00 | ||||
| 2025-07-21 | 13F | Hilltop National Bank | 17 975 | 0,00 | 587 | 25,97 | ||||
| 2025-07-31 | 13F | Oppenheimer & Co Inc | 43 417 | 453,51 | 1 419 | 485,95 | ||||
| 2025-08-05 | 13F | Sigma Planning Corp | 7 377 | 7,07 | 241 | 13,68 | ||||
| 2025-08-04 | 13F | L.m. Kohn & Company | 17 137 | 560 | ||||||
| 2025-08-14 | 13F | Citadel Advisors Llc | 79 946 | −40,84 | 2 613 | −37,41 | ||||
| 2025-07-28 | 13F | Mutual Advisors, LLC | 48 393 | 7,19 | 1 595 | 8,28 | ||||
| 2025-08-14 | 13F | Sunbelt Securities, Inc. | 1 550 | 0,00 | 40 | −14,89 | ||||
| 2025-07-17 | 13F | Forefront Wealth Management Inc. | 24 714 | 808 | ||||||
| 2025-07-14 | 13F | Friday Financial | 7 394 | 242 | ||||||
| 2025-08-14 | 13F | Citadel Advisors Llc | Call | 15 700 | −78,37 | 513 | −77,11 | |||
| 2025-08-14 | 13F | Integrated Wealth Concepts LLC | 12 225 | 27,57 | 400 | 35,25 | ||||
| 2025-08-19 | 13F | Advisory Services Network, LLC | 44 713 | 363,78 | 1 453 | 388,89 | ||||
| 2025-08-13 | 13F | StoneX Group Inc. | 23 834 | 251,38 | 779 | 272,25 | ||||
| 2025-04-23 | 13F | International Assets Investment Management, Llc | 0 | −100,00 | 0 | |||||
| 2025-07-17 | 13F | Janney Montgomery Scott LLC | 30 770 | 11,81 | 1 | |||||
| 2025-08-15 | 13F | First Heartland Consultants, Inc. | 0 | −100,00 | 0 | |||||
| 2025-07-15 | 13F | Fifth Third Bancorp | 0 | −100,00 | 0 | |||||
| 2025-07-09 | 13F | Fragasso Group Inc. | 12 536 | 410 | ||||||
| 2025-07-30 | 13F | D.a. Davidson & Co. | 6 233 | −52,52 | 204 | −49,88 | ||||
| 2025-06-27 | NP | MAPP - Harbor Multi-Asset Explorer ETF | 5 188 | −43,89 | 169 | −34,37 | ||||
| 2025-07-14 | 13F | S.A. Mason LLC | 8 040 | 0,00 | 263 | 5,65 | ||||
| 2025-08-13 | 13F | Scotia Capital Inc. | 9 955 | 24,47 | 325 | 32,11 | ||||
| 2025-07-16 | 13F | Augustine Asset Management Inc | 384 920 | 2,58 | 12 579 | 8,57 | ||||
| 2025-08-12 | 13F | Proequities, Inc. | 0 | 0 | ||||||
| 2025-08-04 | 13F | Hantz Financial Services, Inc. | 0 | −100,00 | 0 | |||||
| 2025-08-14 | 13F | CoreCap Advisors, LLC | 5 055 | 363,34 | 165 | 400,00 | ||||
| 2025-07-09 | 13F | Aaron Wealth Advisors LLC | 6 700 | 219 | ||||||
| 2025-08-14 | 13F | Wells Fargo & Company/mn | 3 | 200,00 | 0 | |||||
| 2025-08-14 | 13F | Comerica Bank | 8 864 | 9,61 | 290 | 16,06 | ||||
| 2025-08-25 | 13F | Silverlake Wealth Management Llc | 56 910 | 102,45 | 1 860 | 114,17 | ||||
| 2025-08-14 | 13F | Headlands Technologies LLC | 4 472 | 146 | ||||||
| 2025-07-16 | 13F | Essex Financial Services, Inc. | 63 873 | −9,28 | 2 087 | −4,00 | ||||
| 2025-08-08 | 13F | Pnc Financial Services Group, Inc. | 1 600 | 0,00 | 52 | 6,12 | ||||
| 2025-08-14 | 13F | Hrt Financial Lp | 15 641 | 1 | ||||||
| 2025-07-23 | 13F | WESPAC Advisors, LLC | 0 | −100,00 | 0 | |||||
| 2025-07-28 | 13F | Copia Wealth Management | 182 | 49,18 | 6 | 66,67 | ||||
| 2025-08-14 | 13F | Harwood Advisory Group, LLC | 2 053 | −18,34 | 67 | 3,08 | ||||
| 2025-05-12 | 13F | Virtu Financial LLC | 0 | −100,00 | 0 | |||||
| 2025-07-15 | 13F | GSB Wealth Management, LLC | 19 744 | 0,00 | 645 | 5,91 | ||||
| 2025-08-07 | 13F | Kestra Private Wealth Services, Llc | 10 593 | 346 | ||||||
| 2025-08-12 | 13F | Wood Tarver Financial Group, LLC | 4 519 | 0 | ||||||
| 2025-08-13 | 13F | Generation Capital Management LLC | 0 | −100,00 | 0 | |||||
| 2025-08-05 | 13F | GPS Wealth Strategies Group, LLC | 11 377 | 0,00 | 372 | 5,70 | ||||
| 2025-08-14 | 13F | Raymond James Financial Inc | 676 500 | 3,51 | 22 108 | 9,54 | ||||
| 2025-07-21 | 13F | Ameritas Advisory Services, LLC | 4 135 | 135 | ||||||
| 2025-08-13 | 13F | GeoWealth Management, LLC | 12 843 | −17,03 | 420 | −12,34 | ||||
| 2025-08-14 | 13F | Boothbay Fund Management, Llc | 22 100 | −21,63 | 722 | −17,01 | ||||
| 2025-08-14 | 13F | Citadel Advisors Llc | Put | 0 | −100,00 | 0 | ||||
| 2025-07-17 | 13F | Sage Rhino Capital Llc | 24 282 | 142,82 | 794 | 157,47 | ||||
| 2025-07-31 | 13F | Buckingham Strategic Partners | 7 394 | 242 | ||||||
| 2025-07-28 | 13F | Axxcess Wealth Management, Llc | 83 097 | −14,51 | 2 716 | −9,53 | ||||
| 2025-08-01 | 13F | Riverwater Partners LLC | 50 138 | 47,83 | 1 639 | 56,45 | ||||
| 2025-08-08 | 13F | Creative Planning | 56 784 | 16,75 | 1 856 | 23,58 | ||||
| 2025-05-15 | 13F | Perennial Investment Advisors, LLC | 0 | −100,00 | 0 | |||||
| 2025-08-12 | 13F | CIBC Private Wealth Group, LLC | 150 | 5 | ||||||
| 2025-08-06 | 13F | Founders Financial Securities Llc | 25 567 | −61,81 | 836 | −62,34 | ||||
| 2025-08-13 | 13F | Quadrature Capital Ltd | 920 490 | 30 082 | ||||||
| 2025-07-07 | 13F | Capital Asset Advisory Services LLC | 82 846 | −14,63 | 2 731 | −8,85 | ||||
| 2025-08-11 | 13F | Mill Creek Capital Advisors, LLC | 17 849 | −6,33 | 583 | −0,85 | ||||
| 2025-07-23 | 13F | Gentry Private Wealth, Llc | 23 948 | 783 | ||||||
| 2025-07-22 | 13F | Wealthcare Advisory Partners LLC | 7 033 | 2,93 | 230 | 8,53 | ||||
| 2025-08-13 | 13F | Alerus Financial Na | 351 739 | 0,00 | 11 495 | 5,83 | ||||
| 2025-07-29 | 13F | Primoris Wealth Advisors, Llc | 16 025 | 524 | ||||||
| 2025-08-01 | 13F | Brookwood Investment Group LLC | 9 960 | −16,80 | 325 | −11,92 | ||||
| 2025-08-06 | 13F | Commonwealth Equity Services, Llc | 336 327 | 1,23 | 11 | 0,00 | ||||
| 2025-08-13 | 13F | Truvestments Capital Llc | 1 862 | 0,00 | 61 | 5,26 | ||||
| 2025-07-10 | 13F | Exchange Traded Concepts, Llc | 600 138 | 128,47 | 19 613 | 141,80 | ||||
| 2025-07-24 | 13F | Jfs Wealth Advisors, Llc | 20 | 1 | ||||||
| 2025-07-25 | 13F | Apollon Wealth Management, LLC | 43 407 | 0,52 | 1 419 | 6,38 | ||||
| 2025-08-14 | 13F | Hara Capital LLC | 7 500 | 0,00 | 245 | 6,06 | ||||
| 2025-08-15 | 13F | Kestra Advisory Services, LLC | 69 875 | 4,37 | 2 284 | 10,45 | ||||
| 2025-08-12 | 13F | BlackRock, Inc. | 1 922 | 0,00 | 63 | 5,08 | ||||
| 2025-08-15 | 13F | Nikulski Financial, Inc. | 76 467 | 2,60 | 2 499 | 8,56 | ||||
| 2025-07-24 | 13F | KC Investment Advisors, LLC | 38 428 | 1 256 | ||||||
| 2025-08-11 | 13F | NewEdge Wealth, LLC | 45 149 | 1 516 | ||||||
| 2025-08-01 | 13F | GoalVest Advisory LLC | 67 620 | 2 210 | ||||||
| 2025-08-14 | 13F | J. Stern & Co. LLP | 42 415 | 0,00 | 1 408 | 7,49 | ||||
| 2025-05-14 | 13F | Flow Traders U.s. Llc | 0 | −100,00 | 0 | |||||
| 2025-08-06 | 13F | Paladin Advisory Group, LLC | 60 162 | −1,04 | 1 966 | 4,74 | ||||
| 2025-08-13 | 13F | Wellspring Financial Advisors, LLC | 1 647 958 | −4,12 | 53 855 | 1,47 | ||||
| 2025-07-11 | 13F | Bell Bank | 17 268 | 0,00 | 564 | 5,82 | ||||
| 2025-07-16 | 13F | American National Bank | 2 100 | 0,00 | 69 | 6,25 | ||||
| 2025-08-01 | 13F | Envestnet Asset Management Inc | 104 310 | −4,18 | 3 409 | 1,40 | ||||
| 2025-07-15 | 13F | Optima Capital Llc | 111 892 | −2,70 | 3 657 | 2,96 | ||||
| 2025-07-22 | 13F | Marks Group Wealth Management, Inc | 114 140 | 10,93 | 3 730 | 17,41 | ||||
| 2025-08-06 | 13F | Prospera Financial Services Inc | 199 057 | 6 505 | ||||||
| 2025-07-24 | 13F | Horizon Bancorp Inc /in/ | 12 015 | −6,78 | 0 | |||||
| 2025-08-07 | 13F | Allworth Financial LP | 10 140 | 6 571,05 | 331 | 6 520,00 | ||||
| 2025-07-31 | 13F | Strait & Sound Wealth Management LLC | 17 738 | 41,46 | 580 | 49,61 | ||||
| 2025-07-29 | 13F | Tradewinds Capital Management, LLC | 45 | 0,00 | 1 | 0,00 | ||||
| 2025-07-09 | 13F | Harbor Capital Advisors, Inc. | 5 772 | 24,83 | 0 | |||||
| 2025-08-14 | 13F | UBS Group AG | 13 230 | −47,45 | 432 | −44,40 | ||||
| 2025-07-15 | 13F | Retirement Guys Formula Llc | 208 448 | −3,98 | 6 812 | 1,63 | ||||
| 2025-08-13 | 13F | Level Four Advisory Services, Llc | 10 970 | 358 | ||||||
| 2025-07-24 | 13F | Blue Zone Wealth Advisors, LLC | 12 850 | 0,00 | 420 | 5,81 | ||||
| 2025-08-15 | 13F | Courage Capital Management Llc | 184 254 | 0,00 | 6 | 20,00 | ||||
| 2025-07-09 | 13F | Fermata Advisors, LLC | 38 050 | −87,85 | 1 243 | −87,15 | ||||
| 2025-08-11 | 13F | Lcnb Corp | 10 252 | −12,39 | 335 | −7,20 | ||||
| 2025-07-21 | 13F | Mirae Asset Global Investments Co., Ltd. | 458 600 | 29,69 | 14 987 | 39,22 | ||||
| 2025-07-08 | 13F | Nbc Securities, Inc. | 919 | 0 |
Other Listings
| MX:AAAU |