Grundläggande statistik
| Institutionella ägare | 155 total, 154 long only, 1 short only, 0 long/short - change of 6,16% MRQ |
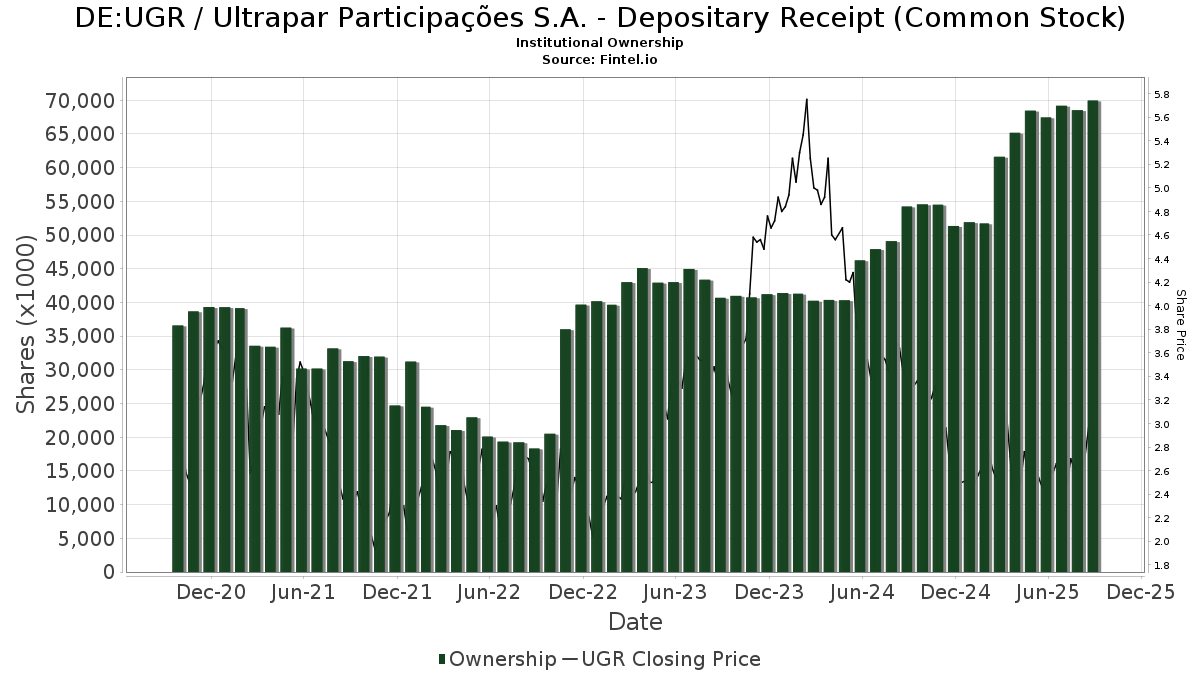
| Aktiepris | 3,02 |
| Genomsnittlig portföljallokering | 0.1487 % - change of −6,54% MRQ |
| Institutionella aktier (lång) | 69 959 846 (ex 13D/G) - change of 2,49MM shares 3,69% MRQ |
| Institutionellt värde (lång) | $ 191 929 USD ($1000) |
Institutionellt ägande och aktieägare
Ultrapar Participações S.A. - Depositary Receipt (Common Stock) (DE:UGR) har 155 Institutionella ägare och aktieägare som har lämnat in 13D/G- eller 13F-formulär till Securities Exchange Commission (SEC). Dessa institut innehar totalt 69,959,846 aktier. Största aktieägare inkluderar Bizma Investimentos Ltda, Polunin Capital Partners Ltd, BlackRock, Inc., Morgan Stanley, American Century Companies Inc, Renaissance Technologies Llc, AVEM - Avantis Emerging Markets Equity ETF, IGF - iShares Global Infrastructure ETF, Jpmorgan Chase & Co, and HFCGX - Hennessy Cornerstone Growth Fund Investor Class .
Ultrapar Participações S.A. - Depositary Receipt (Common Stock) (DB:UGR) Institutionell ägarstruktur visar institutioners och fonders nuvarande positioner i företaget, samt de senaste förändringarna i positionernas storlek. Större aktieägare kan vara enskilda investerare, fonder, hedgefonder eller institutioner. Bilaga 13D visar att investeraren äger (eller ägde) mer än 5% av företaget och avser (eller avsåg) att aktivt eftersträva en förändring av affärsstrategin. Schedule 13G indikerar en passiv investering på över 5%.
The share price as of September 10, 2025 is 3,02 / share. Previously, on September 11, 2024, the share price was 3,50 / share. This represents a decline of 13,71% over that period.
Fondsentimentets poäng
Fondsentimentet poängen(fka Ägarackumulation-poäng) visar vilka aktier som är mest köpta av fonder. Det är resultatet av en sofistikerad kvantitativ flerfaktormodell som identifierar företag med de högsta nivåerna av institutionell ackumulering. Poängsättningsmodellen använder en kombination av den totala ökningen av redovisade ägare, förändringarna i portföljallokeringarna för dessa ägare och andra mått. Siffran sträcker sig från 0 till 100, där högre siffror indikerar en högre nivå av ackumulering i förhållande till sina konkurrenter, och 50 är genomsnittet.
Uppdateringsfrekvens: Dagligen
Se Ownership Explorer, som innehåller en lista över de högst rankade företagen.
13F- och NPORT-arkiveringar
Detaljer om 13F-arkiveringar är gratis. Detaljer om NP-arkiveringar kräver ett premiummedlemskap. Gröna rader indikerar nya positioner. Röda rader indikerar stängda positioner. Klicka på länk symbolen för att se hela transaktionshistoriken.
Uppgradera
för att låsa upp premiumdata och exportera till Excel ![]() .
.
| Fil Datum | Källa | Investerare | Typ | Genomsnittligt pris (beräknat) |
Aktier | Δ Aktier (%) |
Rapporterat värde (1000 USD) |
Δ Värde (%) |
Portföljallokering (%) |
|
|---|---|---|---|---|---|---|---|---|---|---|
| 2025-08-14 | 13F | Wellington Management Group Llp | 582 781 | −1,16 | 1 912 | 5,23 | ||||
| 2025-08-12 | 13F | O'shaughnessy Asset Management, Llc | 295 590 | −7,33 | 970 | −1,32 | ||||
| 2025-07-21 | 13F | Mirae Asset Global Investments Co., Ltd. | 39 333 | 7,46 | 129 | 14,16 | ||||
| 2025-07-24 | 13F | Ronald Blue Trust, Inc. | 16 425 | 27,61 | 54 | 35,90 | ||||
| 2025-06-26 | NP | OWSMX - Old Westbury Small & Mid Cap Strategies Fund | 1 729 047 | 5 446 | ||||||
| 2025-08-11 | 13F | Frank, Rimerman Advisors LLC | 55 105 | 181 | ||||||
| 2025-08-13 | 13F | Hsbc Holdings Plc | 367 357 | 18,81 | 1 203 | 26,50 | ||||
| 2025-08-26 | NP | EMIF - iShares Emerging Markets Infrastructure ETF | 71 595 | −28,19 | 235 | −23,78 | ||||
| 2025-06-26 | NP | DFA INVESTMENT DIMENSIONS GROUP INC - Emerging Markets Sustainability Core 1 Portfolio Institutional Class This fund is a listed as child fund of Dimensional Fund Advisors Lp and if that institution has disclosed ownership in this security, then these positions will not be double counted when calculating total shares and total value | 55 886 | 0,00 | 176 | 11,39 | ||||
| 2025-06-23 | NP | UBPIX - Ultralatin America Profund Investor Class | 14 392 | −6,18 | 45 | 4,65 | ||||
| 2025-07-15 | 13F | Regatta Capital Group, Llc | 12 475 | 41 | ||||||
| 2025-08-14 | 13F | Boston Private Wealth Llc | 0 | −100,00 | 0 | |||||
| 2025-07-11 | 13F | Farther Finance Advisors, LLC | 5 677 | 4,57 | 19 | 12,50 | ||||
| 2025-08-28 | NP | QEMM - SPDR MSCI Emerging Markets StrategicFactors ETF | 2 489 | −3,86 | 8 | 14,29 | ||||
| 2025-05-05 | 13F | Transce3nd, LLC | 0 | −100,00 | 0 | |||||
| 2025-08-14 | 13F/A | Skopos Labs, Inc. | 43 | 0 | ||||||
| 2025-08-14 | 13F | State Street Corp | 860 043 | 0,48 | 2 821 | 6,98 | ||||
| 2025-08-07 | 13F | Connor, Clark & Lunn Investment Management Ltd. | 23 566 | −17,97 | 77 | −12,50 | ||||
| 2025-08-14 | 13F | TCG Advisory Services, LLC | 14 110 | −39,61 | 46 | −35,21 | ||||
| 2025-06-26 | NP | DEXC - Dimensional Emerging Markets ex China Core Equity ETF | 25 200 | 20,57 | 79 | 33,90 | ||||
| 2025-08-12 | 13F | Aigen Investment Management, Lp | 20 043 | 16,81 | 66 | 25,00 | ||||
| 2025-08-08 | 13F | Financial Gravity Companies, Inc. | 41 | −50,00 | 0 | |||||
| 2025-07-16 | 13F | Signaturefd, Llc | 28 719 | 53,61 | 94 | 64,91 | ||||
| 2025-08-14 | 13F | RBF Capital, LLC | 98 800 | 0,00 | 324 | 6,58 | ||||
| 2025-08-13 | 13F | West Family Investments, Inc. | 33 240 | 5,67 | 109 | 13,54 | ||||
| 2025-08-14 | 13F | Qube Research & Technologies Ltd | 1 513 765 | −6,23 | 4 965 | −0,14 | ||||
| 2025-08-13 | 13F | Russell Investments Group, Ltd. | 69 292 | −36,62 | 227 | −32,44 | ||||
| 2025-08-14 | 13F | Wetherby Asset Management Inc | 48 577 | 85,16 | 159 | 133,82 | ||||
| 2025-08-12 | 13F | Wayfinding Financial, LLC | 0 | −100,00 | 0 | |||||
| 2025-08-14 | 13F | Smartleaf Asset Management LLC | 2 608 | 8 | ||||||
| 2025-08-14 | 13F | Bank Of America Corp /de/ | 495 345 | −53,95 | 1 625 | −50,98 | ||||
| 2025-08-26 | NP | IGF - iShares Global Infrastructure ETF | 1 979 877 | −2,76 | 6 494 | 3,54 | ||||
| 2025-07-31 | 13F | R Squared Ltd | 16 500 | 54 | ||||||
| 2025-08-14 | 13F | Point72 Asset Management, L.P. | 595 033 | 12,08 | 1 952 | 19,33 | ||||
| 2025-07-22 | 13F | Simplicity Wealth,LLC | 0 | −100,00 | 0 | |||||
| 2025-08-14 | 13F | Royal Bank Of Canada | 1 182 | 3 376,47 | 4 | |||||
| 2025-06-26 | NP | DFAX - Dimensional World ex U.S. Core Equity 2 ETF | 87 144 | 50,13 | 275 | 67,07 | ||||
| 2025-08-13 | 13F | Northwestern Mutual Wealth Management Co | 1 517 | 5 | ||||||
| 2025-08-14 | 13F | Schonfeld Strategic Advisors LLC | 15 922 | −78,86 | 52 | −77,49 | ||||
| 2025-07-24 | 13F | Us Bancorp \de\ | 20 401 | −19,94 | 67 | −15,38 | ||||
| 2025-08-08 | 13F | Mitsubishi UFJ Trust & Banking Corp | 14 622 | 0,00 | 48 | 4,44 | ||||
| 2025-08-06 | 13F | First Horizon Advisors, Inc. | 213 | −93,17 | 1 | −100,00 | ||||
| 2025-04-30 | 13F | Sofos Investments, Inc. | 82 | 0 | ||||||
| 2025-08-12 | 13F | Pathstone Holdings, LLC | 32 844 | 2,15 | 108 | 8,08 | ||||
| 2025-08-12 | 13F | American Century Companies Inc | 2 695 322 | 42,44 | 8 841 | 51,68 | ||||
| 2025-08-13 | 13F | Wealthquest Corp | 0 | −100,00 | 0 | −100,00 | ||||
| 2025-08-07 | 13F | Sierra Ocean, Llc | 902 | 56,60 | 3 | 100,00 | ||||
| 2025-08-15 | 13F | CI Private Wealth, LLC | 61 535 | 0,31 | 202 | 6,91 | ||||
| 2025-08-13 | 13F | EverSource Wealth Advisors, LLC | 6 586 | 37,61 | 22 | 50,00 | ||||
| 2025-08-12 | 13F | Longfellow Investment Management Co Llc | 616 345 | 39,59 | 2 022 | 48,71 | ||||
| 2025-08-14 | 13F | Atomi Financial Group, Inc. | 18 946 | −8,99 | 62 | −3,12 | ||||
| 2025-08-11 | 13F | EntryPoint Capital, LLC | 29 607 | −3,71 | 97 | 3,19 | ||||
| 2025-08-15 | 13F | Tower Research Capital LLC (TRC) | 0 | −100,00 | 0 | |||||
| 2025-05-05 | 13F | Lindbrook Capital, Llc | 6 635 | 83,69 | 20 | 122,22 | ||||
| 2025-05-14 | 13F | Group One Trading, L.p. | Call | 0 | −100,00 | 0 | −100,00 | |||
| 2025-07-14 | 13F | GAMMA Investing LLC | 18 220 | 4,63 | 60 | 11,32 | ||||
| 2025-07-15 | 13F | Ballentine Partners, LLC | 13 051 | −11,49 | 43 | −6,67 | ||||
| 2025-08-07 | 13F | Acadian Asset Management Llc | 1 139 033 | −17,90 | 4 | −25,00 | ||||
| 2025-07-29 | NP | RBB FUND, INC. - Aquarius International Fund | 8 959 | 0,00 | 26 | 0,00 | ||||
| 2025-08-13 | 13F | Renaissance Technologies Llc | 2 414 700 | 12,22 | 7 920 | 19,51 | ||||
| 2025-08-13 | 13F | Quadrant Capital Group Llc | 497 253 | 1 248,85 | 1 631 | 1 342,48 | ||||
| 2025-08-14 | 13F | Bizma Investimentos Ltda | 14 079 999 | 0,00 | 46 182 | 6,49 | ||||
| 2025-06-18 | NP | RTXAX - Tax-Managed Real Assets Fund Class A | 69 292 | −36,62 | 218 | −29,68 | ||||
| 2025-08-28 | NP | GII - SPDR(R) S&P GLOBAL INFRASTRUCTURE ETF | 147 200 | −12,07 | 483 | −6,41 | ||||
| 2025-08-14 | 13F | VPR Management LLC | 46 700 | 0,00 | 153 | 6,99 | ||||
| 2025-05-14 | 13F | Barometer Capital Management Inc. | 0 | −100,00 | 0 | |||||
| 2025-07-25 | 13F | JustInvest LLC | 77 467 | 115,55 | 254 | 130,91 | ||||
| 2025-05-16 | 13F | Dynamic Technology Lab Private Ltd | 0 | −100,00 | 0 | −100,00 | ||||
| 2025-08-13 | 13F | Marshall Wace, Llp | 915 813 | −65,06 | 3 004 | −62,80 | ||||
| 2025-08-14 | 13F | Group One Trading, L.p. | 0 | −100,00 | 0 | |||||
| 2025-08-13 | 13F | Arrowstreet Capital, Limited Partnership | 0 | −100,00 | 0 | |||||
| 2025-08-29 | NP | Cantor Fitzgerald Sustainable Infrastructure Fund | 89 500 | 0,00 | 294 | 6,55 | ||||
| 2025-05-14 | 13F | Walleye Capital LLC | 0 | −100,00 | 0 | |||||
| 2025-08-14 | 13F | Fmr Llc | 33 708 | −78,09 | 111 | −76,74 | ||||
| 2025-08-14 | 13F | Citadel Advisors Llc | 0 | −100,00 | 0 | −100,00 | ||||
| 2025-08-14 | 13F | Citadel Advisors Llc | Call | 0 | −100,00 | 0 | −100,00 | |||
| 2025-07-24 | 13F | IFP Advisors, Inc | 330 | 0,00 | 1 | 0,00 | ||||
| 2025-08-08 | 13F | Creative Planning | 250 101 | 44,20 | 820 | 53,56 | ||||
| 2025-06-26 | NP | DFEV - Dimensional Emerging Markets Value ETF | 59 695 | −17,32 | 188 | −8,29 | ||||
| 2025-06-26 | NP | DFSE - Dimensional Emerging Markets Sustainability Core 1 ETF | 50 602 | 1 388,29 | 159 | 1 666,67 | ||||
| 2025-04-25 | NP | VCGEX - Emerging Economies Fund | 136 372 | 42,61 | 390 | 38,30 | ||||
| 2025-08-01 | 13F | Envestnet Asset Management Inc | 34 083 | −3,63 | 112 | 2,78 | ||||
| 2025-08-06 | 13F | Metis Global Partners, LLC | 47 378 | 5,62 | 155 | 12,32 | ||||
| 2025-08-14 | 13F | Cubist Systematic Strategies, LLC | 333 307 | −1,19 | 1 093 | 5,30 | ||||
| 2025-08-15 | 13F | Morgan Stanley | 6 332 966 | 40,50 | 20 772 | 49,63 | ||||
| 2025-07-30 | NP | APIE - ActivePassive International Equity ETF | 17 375 | −58,01 | 50 | −59,84 | ||||
| 2025-08-14 | 13F | Ieq Capital, Llc | 24 085 | 53,84 | 79 | 62,50 | ||||
| 2025-05-13 | 13F | Quantbot Technologies LP | 0 | −100,00 | 0 | |||||
| 2025-06-26 | NP | DFEM - Dimensional Emerging Markets Core Equity 2 ETF | 42 882 | 119,91 | 135 | 145,45 | ||||
| 2025-05-16 | 13F | Jones Financial Companies Lllp | 0 | −100,00 | 0 | |||||
| 2025-08-13 | 13F | Quadrature Capital Ltd | 13 660 | 45 | ||||||
| 2025-08-07 | 13F | Profund Advisors Llc | 15 320 | −14,60 | 50 | −9,09 | ||||
| 2025-08-12 | 13F | Jpmorgan Chase & Co | 1 878 904 | 75,20 | 6 163 | 86,56 | ||||
| 2025-08-13 | 13F | Northern Trust Corp | 150 319 | 1,32 | 493 | 8,11 | ||||
| 2025-08-08 | 13F | SG Americas Securities, LLC | 285 874 | 119,43 | 1 | |||||
| 2025-07-14 | 13F | Abound Wealth Management | 64 | 0,00 | 0 | |||||
| 2025-08-14 | 13F | Two Sigma Advisers, Lp | 763 100 | −37,55 | 2 503 | −33,51 | ||||
| 2025-08-14 | 13F | Engineers Gate Manager LP | 27 085 | −49,91 | 89 | −46,99 | ||||
| 2025-08-12 | 13F | Dimensional Fund Advisors Lp | 519 028 | 46,75 | 1 702 | 56,29 | ||||
| 2025-07-18 | 13F | Trust Co Of Vermont | 4 339 | 14 | ||||||
| 2025-07-29 | 13F | Wealthstream Advisors, Inc. | 14 041 | 46 | ||||||
| 2025-08-08 | 13F | Pnc Financial Services Group, Inc. | 71 263 | 33,57 | 234 | 42,07 | ||||
| 2025-05-08 | 13F | XTX Topco Ltd | 0 | −100,00 | 0 | |||||
| 2025-07-28 | NP | AVEEX - Avantis Emerging Markets Equity Fund Institutional Class This fund is a listed as child fund of American Century Companies Inc and if that institution has disclosed ownership in this security, then these positions will not be double counted when calculating total shares and total value | 58 586 | 0,00 | 167 | −0,60 | ||||
| 2025-08-14 | 13F | Aqr Capital Management Llc | 52 803 | −25,46 | 173 | −20,64 | ||||
| 2025-08-15 | 13F | WealthCollab, LLC | 1 097 | 4 | ||||||
| 2025-07-21 | 13F | Hennessy Advisors Inc | 0 | −100,00 | 0 | |||||
| 2025-07-30 | 13F | Bleakley Financial Group, LLC | 167 528 | 9,81 | 549 | 17,06 | ||||
| 2025-08-05 | 13F | Simplex Trading, Llc | 421 | 0 | ||||||
| 2025-08-14 | 13F | Jane Street Group, Llc | 155 483 | 510 | ||||||
| 2025-05-15 | 13F | Wolverine Trading, Llc | 0 | −100,00 | 0 | |||||
| 2025-08-12 | 13F | Virtu Financial LLC | 52 420 | 0 | ||||||
| 2025-05-15 | 13F | Jain Global LLC | 0 | −100,00 | 0 | |||||
| 2025-03-28 | NP | HFCGX - Hennessy Cornerstone Growth Fund Investor Class | 1 840 000 | 7,17 | 5 226 | −15,93 | ||||
| 2025-08-14 | 13F | Mercer Global Advisors Inc /adv | 0 | −100,00 | 0 | |||||
| 2025-07-25 | 13F | Sequoia Financial Advisors, LLC | 59 097 | 12,79 | 194 | 19,88 | ||||
| 2025-08-14 | 13F | Manufacturers Life Insurance Company, The | 17 044 | 56 | ||||||
| 2025-07-24 | 13F | Jfs Wealth Advisors, Llc | 253 | 0,00 | 1 | |||||
| 2025-08-14 | 13F | Goldman Sachs Group Inc | 1 388 506 | −31,74 | 4 554 | −27,30 | ||||
| 2025-08-11 | 13F | Inspire Advisors, LLC | 40 603 | −17,67 | 133 | −11,92 | ||||
| 2025-08-12 | 13F | Deutsche Bank Ag\ | 6 430 | 23,11 | 21 | 31,25 | ||||
| 2025-07-28 | NP | AVEM - Avantis Emerging Markets Equity ETF This fund is a listed as child fund of American Century Companies Inc and if that institution has disclosed ownership in this security, then these positions will not be double counted when calculating total shares and total value | 2 136 119 | 21,31 | 6 088 | 20,89 | ||||
| 2025-08-12 | 13F | Franklin Resources Inc | 22 832 | 100,79 | 75 | 111,43 | ||||
| 2025-07-24 | 13F | PDS Planning, Inc | 32 111 | 22,99 | 105 | 31,25 | ||||
| 2025-08-14 | 13F | Hrt Financial Lp | 0 | −100,00 | 0 | |||||
| 2025-03-26 | NP | BLACKROCK FUNDS - BlackRock Advantage ESG Emerging Markets Equity Fund Institutional This fund is a listed as child fund of BlackRock, Inc. and if that institution has disclosed ownership in this security, then these positions will not be double counted when calculating total shares and total value | 14 630 | 104,99 | 42 | 64,00 | ||||
| 2025-07-31 | 13F | Caitong International Asset Management Co., Ltd | 2 577 | 1 573,38 | 8 | |||||
| 2025-08-14 | 13F | Ubs Asset Management Americas Inc | 460 000 | 15,00 | 1 509 | 22,40 | ||||
| 2025-07-24 | 13F | CWM Advisors, LLC | 18 501 | 6,55 | 61 | 13,21 | ||||
| 2025-08-14 | 13F | Vident Advisory, LLC | 268 982 | 93,64 | 882 | 106,56 | ||||
| 2025-08-18 | 13F | Geneos Wealth Management Inc. | 195 | 1 | ||||||
| 2025-08-12 | 13F | BlackRock, Inc. | 7 328 461 | 12,93 | 24 037 | 20,27 | ||||
| 2025-07-16 | 13F | Beaumont Financial Advisors, LLC | 22 743 | 0,00 | 75 | 5,71 | ||||
| 2025-08-14 | 13F | Millennium Management Llc | 688 119 | −23,93 | 2 257 | −18,99 | ||||
| 2025-08-14 | 13F | Aprio Wealth Management, LLC | 35 365 | −58,57 | 116 | −56,11 | ||||
| 2025-07-25 | 13F | Yousif Capital Management, Llc | 17 210 | 0,00 | 56 | 5,66 | ||||
| 2025-07-25 | 13F | Cwm, Llc | 10 617 | 12,19 | 0 | |||||
| 2025-07-28 | NP | AVES - Avantis Emerging Markets Value ETF This fund is a listed as child fund of American Century Companies Inc and if that institution has disclosed ownership in this security, then these positions will not be double counted when calculating total shares and total value | 113 541 | 2 082,64 | 324 | 2 207,14 | ||||
| 2025-04-21 | 13F | Nelson, Van Denburg & Campbell Wealth Management Group, LLC | 0 | −100,00 | 0 | |||||
| 2025-09-04 | 13F/A | Advisor Group Holdings, Inc. | 3 035 | 1,17 | 10 | 0,00 | ||||
| 2025-06-26 | NP | DFCEX - Emerging Markets Core Equity Portfolio - Institutional Class This fund is a listed as child fund of Dimensional Fund Advisors Lp and if that institution has disclosed ownership in this security, then these positions will not be double counted when calculating total shares and total value | 12 552 | 0,00 | 40 | 11,43 | ||||
| 2025-08-14 | 13F | Wells Fargo & Company/mn | 5 920 | 0,00 | 19 | 5,56 | ||||
| 2025-07-28 | NP | NSI - National Security Emerging Markets Index ETF | 4 966 | 38,48 | 14 | 40,00 | ||||
| 2025-08-05 | 13F | Simplex Trading, Llc | Call | 0 | −100,00 | 0 | ||||
| 2025-05-15 | 13F/A | Orion Portfolio Solutions, LLC | 17 996 | −5,33 | 55 | 12,24 | ||||
| 2025-08-11 | 13F | Citigroup Inc | 60 712 | 4,60 | 199 | 11,80 | ||||
| 2025-08-08 | 13F | Principal Financial Group Inc | 88 709 | 291 | ||||||
| 2025-07-28 | NP | AVXC - Avantis Emerging Markets ex-China Equity ETF | 33 389 | 352,18 | 95 | 352,38 | ||||
| 2025-07-29 | 13F | Private Trust Co Na | 97 | 0,00 | 0 | |||||
| 2025-07-21 | 13F | Qrg Capital Management, Inc. | 12 666 | −7,27 | 42 | −2,38 | ||||
| 2025-08-14 | 13F | Citadel Advisors Llc | Put | 10 200 | 96,15 | 33 | 106,25 | |||
| 2025-07-10 | 13F | Polunin Capital Partners Ltd | 9 457 242 | 8,95 | 31 | 34,78 | ||||
| 2025-08-06 | 13F | True Wealth Design, LLC | 20 | 0,00 | 0 | |||||
| 2025-07-28 | 13F | Ritholtz Wealth Management | 156 042 | 56,65 | 512 | 66,99 | ||||
| 2025-08-12 | 13F | Proequities, Inc. | Put | 0 | 0 | |||||
| 2025-06-26 | NP | DFAE - Dimensional Emerging Core Equity Market ETF | 52 584 | −55,13 | 166 | −50,30 | ||||
| 2025-08-12 | 13F | Proequities, Inc. | Call | 0 | 0 | |||||
| 2025-08-12 | 13F | Proequities, Inc. | 0 | 0 | ||||||
| 2025-08-14 | 13F | UBS Group AG | 1 246 471 | 113,62 | 4 088 | 127,49 | ||||
| 2025-08-12 | 13F | Rhumbline Advisers | 179 412 | 0,78 | 588 | 7,30 | ||||
| 2025-08-18 | 13F/A | National Bank Of Canada /fi/ | 1 150 | 4 | ||||||
| 2025-07-09 | 13F | Sivia Capital Partners, LLC | 21 728 | 1,79 | 71 | 9,23 | ||||
| 2025-08-07 | 13F | Allworth Financial LP | 637 | 7,24 | 2 | 100,00 | ||||
| 2025-08-14 | 13F | Susquehanna International Group, Llp | 53 504 | −51,89 | 175 | −48,83 | ||||
| 2025-08-14 | 13F | Sei Investments Co | 66 997 | 26,56 | 220 | 34,36 | ||||
| 2025-08-14 | 13F/A | Barclays Plc | 104 379 | 34,11 | 0 | |||||
| 2025-08-11 | 13F | Raiffeisen Bank International AG | 411 999 | 54,13 | 1 273 | 53,19 | ||||
| 2025-08-12 | 13F | MAI Capital Management | 4 762 | 16 | ||||||
| 2025-07-15 | 13F | Public Employees Retirement System Of Ohio | 3 903 | 0,00 | 13 | 0,00 | ||||
| 2025-08-12 | 13F | Advisors Asset Management, Inc. | 136 629 | −5,04 | 448 | 1,13 | ||||
| 2025-08-13 | 13F | Invesco Ltd. | 177 847 | 80,88 | 583 | 93,05 | ||||
| 2025-08-12 | 13F | Legal & General Group Plc | 135 500 | 0,00 | 445 | 6,46 | ||||
| 2025-08-12 | 13F | Global Retirement Partners, LLC | 1 209 | 0,00 | 4 | 0,00 | ||||
| 2025-08-14 | 13F | Mariner, LLC | 136 325 | 56,53 | 446 | 66,42 | ||||
| 2025-07-30 | 13F | Ethic Inc. | 32 797 | 42,71 | 102 | 42,25 | ||||
| 2025-07-08 | 13F | Parallel Advisors, LLC | 21 295 | −0,91 | 70 | 4,55 | ||||
| 2025-08-14 | 13F | Axa S.a. | 12 831 | 0,00 | 42 | 7,69 | ||||
| 2025-04-23 | 13F | Pinnacle Bancorp, Inc. | 0 | −100,00 | 0 | |||||
| 2025-08-12 | 13F | Coldstream Capital Management Inc | 0 | −100,00 | 0 | |||||
| 2025-08-13 | 13F | Cerity Partners LLC | 76 297 | −0,59 | 250 | 5,93 | ||||
| 2025-08-13 | 13F | Mackenzie Financial Corp | 45 926 | 151 | ||||||
| 2025-08-14 | 13F | Bnp Paribas Arbitrage, Sa | 374 838 | 434,87 | 1 229 | 471,63 | ||||
| 2025-08-27 | 13F/A | Brinker Capital Investments, LLC | 17 147 | −4,72 | 56 | 1,82 | ||||
| 2025-08-14 | 13F | Two Sigma Investments, Lp | 1 013 235 | −24,48 | 3 323 | −19,58 |