Grundläggande statistik
| Institutionella ägare | 276 total, 276 long only, 0 short only, 0 long/short - change of 13,11% MRQ |
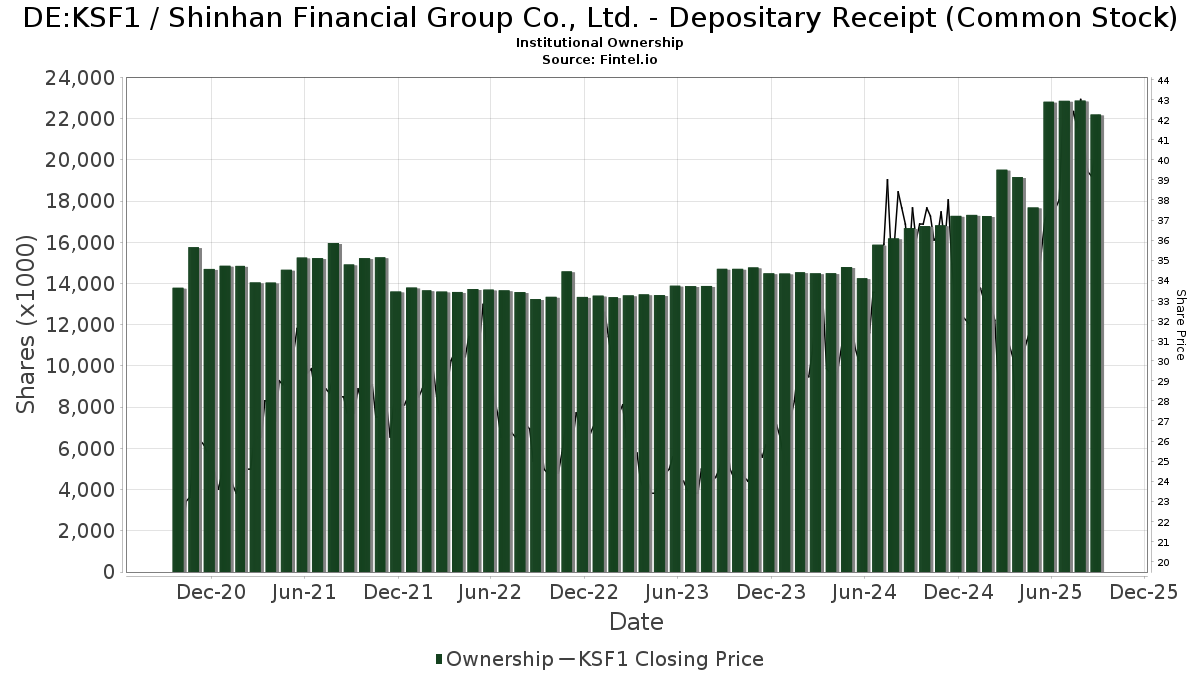
| Aktiepris | 40,80 |
| Genomsnittlig portföljallokering | 0.1383 % - change of 27,07% MRQ |
| Institutionella aktier (lång) | 22 198 624 (ex 13D/G) - change of −0,47MM shares −2,06% MRQ |
| Institutionellt värde (lång) | $ 916 128 USD ($1000) |
Institutionellt ägande och aktieägare
Shinhan Financial Group Co., Ltd. - Depositary Receipt (Common Stock) (DE:KSF1) har 276 Institutionella ägare och aktieägare som har lämnat in 13D/G- eller 13F-formulär till Securities Exchange Commission (SEC). Dessa institut innehar totalt 22,198,624 aktier. Största aktieägare inkluderar BlackRock, Inc., Morgan Stanley, Dimensional Fund Advisors Lp, Lazard Asset Management Llc, Northern Trust Corp, Arrowstreet Capital, Limited Partnership, Pzena Investment Management Llc, American Century Companies Inc, Dimensional Emerging Markets Value Fund - Dimensional Emerging Markets Value Fund, and AVEM - Avantis Emerging Markets Equity ETF .
Shinhan Financial Group Co., Ltd. - Depositary Receipt (Common Stock) (DB:KSF1) Institutionell ägarstruktur visar institutioners och fonders nuvarande positioner i företaget, samt de senaste förändringarna i positionernas storlek. Större aktieägare kan vara enskilda investerare, fonder, hedgefonder eller institutioner. Bilaga 13D visar att investeraren äger (eller ägde) mer än 5% av företaget och avser (eller avsåg) att aktivt eftersträva en förändring av affärsstrategin. Schedule 13G indikerar en passiv investering på över 5%.
The share price as of September 12, 2025 is 40,80 / share. Previously, on September 16, 2024, the share price was 37,20 / share. This represents an increase of 9,68% over that period.
Fondsentimentets poäng
Fondsentimentet poängen(fka Ägarackumulation-poäng) visar vilka aktier som är mest köpta av fonder. Det är resultatet av en sofistikerad kvantitativ flerfaktormodell som identifierar företag med de högsta nivåerna av institutionell ackumulering. Poängsättningsmodellen använder en kombination av den totala ökningen av redovisade ägare, förändringarna i portföljallokeringarna för dessa ägare och andra mått. Siffran sträcker sig från 0 till 100, där högre siffror indikerar en högre nivå av ackumulering i förhållande till sina konkurrenter, och 50 är genomsnittet.
Uppdateringsfrekvens: Dagligen
Se Ownership Explorer, som innehåller en lista över de högst rankade företagen.
13F- och NPORT-arkiveringar
Detaljer om 13F-arkiveringar är gratis. Detaljer om NP-arkiveringar kräver ett premiummedlemskap. Gröna rader indikerar nya positioner. Röda rader indikerar stängda positioner. Klicka på länk symbolen för att se hela transaktionshistoriken.
Uppgradera
för att låsa upp premiumdata och exportera till Excel ![]() .
.
| Fil Datum | Källa | Investerare | Typ | Genomsnittligt pris (beräknat) |
Aktier | Δ Aktier (%) |
Rapporterat värde (1000 USD) |
Δ Värde (%) |
Portföljallokering (%) |
|
|---|---|---|---|---|---|---|---|---|---|---|
| 2025-08-12 | 13F | Franklin Resources Inc | 6 466 | −95,41 | 292 | −93,54 | ||||
| 2025-08-13 | 13F | EverSource Wealth Advisors, LLC | 7 453 | 19,34 | 337 | 68,00 | ||||
| 2025-08-14 | 13F | Axa S.a. | 16 013 | 0,00 | 723 | 40,94 | ||||
| 2025-05-05 | 13F | Creekmur Asset Management LLC | 0 | −100,00 | 0 | |||||
| 2025-07-10 | 13F | Wealth Enhancement Advisory Services, Llc | 12 056 | 20,85 | 558 | 74,38 | ||||
| 2025-06-30 | NP | VT - Vanguard Total World Stock Index Fund ETF Shares | 5 816 | 0,00 | 209 | 2,96 | ||||
| 2025-08-14 | 13F | Aprio Wealth Management, LLC | 17 046 | −7,83 | 770 | 29,85 | ||||
| 2025-07-14 | 13F | GAMMA Investing LLC | 3 301 | 124,86 | 149 | 217,02 | ||||
| 2025-08-13 | 13F | First Trust Advisors Lp | 14 597 | −9,22 | 659 | 27,96 | ||||
| 2025-07-14 | 13F | Abound Wealth Management | 20 | 0,00 | 1 | |||||
| 2025-08-14 | 13F | Mariner, LLC | 35 897 | 19,22 | 1 620 | 67,88 | ||||
| 2025-08-14 | 13F | GWM Advisors LLC | 12 106 | −2,30 | 547 | 37,53 | ||||
| 2025-07-23 | 13F | High Note Wealth, LLC | 5 | 0,00 | 0 | |||||
| 2025-08-01 | 13F | Oversea-Chinese Banking CORP Ltd | 11 209 | −70,94 | 506 | −58,90 | ||||
| 2025-07-09 | 13F | Aaron Wealth Advisors LLC | 8 779 | 11,59 | 397 | 57,14 | ||||
| 2025-08-12 | 13F | Gitterman Wealth Management, LLC | 3 835 | 173 | ||||||
| 2025-08-13 | 13F | Centiva Capital, LP | 0 | −100,00 | 0 | |||||
| 2025-08-14 | 13F | Royal Bank Of Canada | 130 411 | 3,32 | 5 893 | 45,54 | ||||
| 2025-07-01 | 13F | Confluence Investment Management Llc | 5 869 | −6,32 | 265 | 32,50 | ||||
| 2025-08-11 | 13F | Pinnacle Wealth Planning Services, Inc. | 4 435 | 200 | ||||||
| 2025-08-13 | 13F | Causeway Capital Management Llc | 550 138 | 7,91 | 24 855 | 51,98 | ||||
| 2025-08-14 | 13F | Point72 Asset Management, L.P. | 21 075 | 677,10 | 952 | 994,25 | ||||
| 2025-08-14 | 13F/A | Skopos Labs, Inc. | 2 279 | 409,84 | 103 | 628,57 | ||||
| 2025-06-25 | NP | WRAAX - Wilmington Global Alpha Equities Fund Class A Shares | 6 689 | 9,67 | 241 | 12,68 | ||||
| 2025-08-18 | 13F | Geneos Wealth Management Inc. | 440 | 0,00 | 20 | 35,71 | ||||
| 2025-07-11 | 13F | Pinnacle Bancorp, Inc. | 127 | 0,00 | 6 | 25,00 | ||||
| 2025-07-17 | 13F | Catalytic Wealth RIA, LLC | 5 186 | 234 | ||||||
| 2025-07-30 | 13F | Legacy Wealth Asset Management, LLC | 17 924 | −8,34 | 810 | 29,03 | ||||
| 2025-05-13 | 13F | Boston Partners | 0 | −100,00 | 0 | |||||
| 2025-08-07 | 13F | Vise Technologies, Inc. | 27 297 | 43,32 | 1 233 | 96,96 | ||||
| 2025-05-14 | 13F | Itau Unibanco Holding S.A. | 0 | −100,00 | 0 | |||||
| 2025-08-01 | 13F | Bessemer Group Inc | 5 473 | 34,24 | 0 | |||||
| 2025-08-11 | 13F | Citigroup Inc | 18 497 | 16,47 | 836 | 64,05 | ||||
| 2025-06-23 | NP | UUPIX - Ultraemerging Markets Profund Investor Class | 1 947 | 1,35 | 70 | 4,48 | ||||
| 2025-08-27 | 13F/A | Squarepoint Ops LLC | 15 244 | −57,28 | 689 | −39,86 | ||||
| 2025-08-11 | 13F | Principal Securities, Inc. | 168 | 69,70 | 8 | 133,33 | ||||
| 2025-07-11 | 13F | Farther Finance Advisors, LLC | 1 908 | 240,71 | 86 | 377,78 | ||||
| 2025-08-11 | 13F | Frank, Rimerman Advisors LLC | 11 464 | 518 | ||||||
| 2025-07-29 | NP | RBB FUND, INC. - Aquarius International Fund | 9 162 | 0,00 | 380 | 29,79 | ||||
| 2025-05-14 | 13F | Jane Street Group, Llc | 0 | −100,00 | 0 | |||||
| 2025-08-14 | 13F | Aqr Capital Management Llc | 14 803 | 125,90 | 669 | 218,10 | ||||
| 2025-08-07 | 13F | Connor, Clark & Lunn Investment Management Ltd. | 519 670 | −15,80 | 23 479 | 18,58 | ||||
| 2025-08-14 | 13F | UBS Group AG | 23 801 | −29,20 | 1 075 | −0,28 | ||||
| 2025-08-14 | 13F | Balyasny Asset Management Llc | 10 607 | 12,71 | 479 | 59,14 | ||||
| 2025-05-15 | 13F | CAPROCK Group, Inc. | 11 285 | −12,25 | 367 | −13,27 | ||||
| 2025-08-05 | 13F | Bank Of Montreal /can/ | 9 650 | 7,71 | 436 | 51,57 | ||||
| 2025-08-13 | 13F | Marshall Wace, Llp | 273 891 | −14,26 | 12 374 | 20,76 | ||||
| 2025-07-17 | 13F | Greenleaf Trust | 13 907 | 1,01 | 628 | 42,40 | ||||
| 2025-07-30 | 13F | Cullen/frost Bankers, Inc. | 865 | 0,00 | 39 | 44,44 | ||||
| 2025-07-24 | 13F | Callan Family Office, LLC | 7 412 | 335 | ||||||
| 2025-08-14 | 13F | Wetherby Asset Management Inc | 47 069 | −3,12 | 2 127 | 33,12 | ||||
| 2025-08-01 | 13F | Envestnet Asset Management Inc | 217 835 | 10,18 | 9 842 | 55,17 | ||||
| 2025-08-05 | 13F | NewSquare Capital LLC | 337 | 77,37 | 15 | 150,00 | ||||
| 2025-08-04 | 13F | Strs Ohio | 19 106 | 0,00 | 863 | 41,01 | ||||
| 2025-07-28 | NP | AVXC - Avantis Emerging Markets ex-China Equity ETF | 8 199 | 37,41 | 340 | 78,42 | ||||
| 2025-07-16 | 13F | Highline Wealth Partners Llc | 178 | 1 171,43 | 8 | |||||
| 2025-08-13 | 13F | Arrowstreet Capital, Limited Partnership | 1 112 045 | −1,77 | 50 242 | 38,35 | ||||
| 2025-08-14 | 13F | Kovitz Investment Group Partners, LLC | 4 699 | 212 | ||||||
| 2025-08-22 | NP | DEUTSCHE DWS VARIABLE SERIES II - DWS Global Income Builder VIP Class A | 6 100 | 276 | ||||||
| 2025-07-24 | 13F | Standard Life Aberdeen plc | 31 805 | −6,36 | 1 437 | 31,86 | ||||
| 2025-08-14 | 13F | Schonfeld Strategic Advisors LLC | 14 100 | 104,35 | 637 | 188,24 | ||||
| 2025-08-19 | 13F | Asset Dedication, LLC | 29 | 0,00 | 1 | |||||
| 2025-08-13 | 13F | Northern Trust Corp | 1 491 188 | −0,67 | 67 372 | 39,90 | ||||
| 2025-08-14 | 13F | Two Sigma Investments, Lp | 165 425 | −37,12 | 7 474 | −11,45 | ||||
| 2025-07-28 | NP | AVSE - Avantis Responsible Emerging Markets Equity ETF | 9 140 | 13,26 | 379 | 47,08 | ||||
| 2025-08-11 | 13F | WPG Advisers, LLC | 63 | 28,57 | 3 | 100,00 | ||||
| 2025-07-24 | 13F | PDS Planning, Inc | 14 232 | 4,10 | 643 | 46,80 | ||||
| 2025-08-08 | 13F | Creative Planning | 162 873 | 70,28 | 7 359 | 139,83 | ||||
| 2025-07-08 | 13F | Parallel Advisors, LLC | 14 051 | 8,71 | 635 | 53,14 | ||||
| 2025-08-08 | 13F | Pnc Financial Services Group, Inc. | 20 704 | 19,46 | 935 | 68,47 | ||||
| 2025-08-14 | 13F | Arbiter Partners Capital Management LLC | 39 600 | 54,69 | 1 789 | 117,90 | ||||
| 2025-08-12 | 13F | Dimensional Fund Advisors Lp | 1 540 564 | −1,71 | 69 603 | 38,43 | ||||
| 2025-04-21 | 13F | Nelson, Van Denburg & Campbell Wealth Management Group, LLC | 0 | −100,00 | 0 | |||||
| 2025-07-29 | 13F | Private Trust Co Na | 57 | 0,00 | 3 | 100,00 | ||||
| 2025-08-13 | 13F | Kilter Group LLC | 62 | 3 | ||||||
| 2025-08-14 | 13F | Ariadne Wealth Management, LP | 6 834 | −0,84 | 345 | 38,15 | ||||
| 2025-07-30 | 13F | DekaBank Deutsche Girozentrale | 11 779 | 0,00 | 1 | |||||
| 2025-08-08 | 13F | SG Americas Securities, LLC | 4 146 | −38,70 | 0 | |||||
| 2025-08-14 | 13F | Stifel Financial Corp | 27 824 | −4,12 | 1 257 | 35,16 | ||||
| 2025-07-14 | 13F | UMA Financial Services, Inc. | 80 | 116,22 | 4 | 200,00 | ||||
| 2025-08-12 | 13F | Steward Partners Investment Advisory, Llc | 14 | 0,00 | 1 | |||||
| 2025-08-14 | 13F | Raymond James Financial Inc | 23 142 | 11,61 | 1 046 | 57,14 | ||||
| 2025-08-13 | 13F | Russell Investments Group, Ltd. | 34 607 | 57,82 | 1 562 | 122,19 | ||||
| 2025-04-29 | NP | BELSX - Boston Partners Emerging Markets Long/Short Fund Institutional Class | 3 470 | −51,43 | 111 | −60,00 | ||||
| 2025-08-06 | 13F | Vestmark Advisory Solutions, Inc. | 4 731 | 214 | ||||||
| 2025-08-12 | 13F | Coldstream Capital Management Inc | 0 | −100,00 | 0 | |||||
| 2025-08-13 | 13F | Barclays Plc | 0 | −100,00 | 0 | |||||
| 2025-05-12 | 13F | Simplex Trading, Llc | 0 | −100,00 | 0 | |||||
| 2025-08-12 | 13F | BlackRock, Inc. | 1 793 035 | 12,96 | 81 009 | 59,09 | ||||
| 2025-08-08 | 13F | SBI Securities Co., Ltd. | 214 | 5,42 | 10 | 50,00 | ||||
| 2025-08-07 | 13F | Acadian Asset Management Llc | 151 590 | −2,69 | 7 | 50,00 | ||||
| 2025-07-31 | 13F | Whipplewood Advisors, LLC | 165 | 132,39 | 7 | 40,00 | ||||
| 2025-07-30 | NP | APIE - ActivePassive International Equity ETF | 58 420 | −3,94 | 2 422 | 24,72 | ||||
| 2025-08-04 | 13F | Atria Investments Llc | 10 744 | 485 | ||||||
| 2025-05-15 | 13F/A | Orion Portfolio Solutions, LLC | 60 343 | −25,89 | 1 936 | −27,72 | ||||
| 2025-08-11 | 13F | Hexagon Capital Partners LLC | 0 | −100,00 | 0 | |||||
| 2025-05-06 | 13F | Venturi Wealth Management, LLC | 0 | −100,00 | 0 | |||||
| 2025-08-14 | 13F | Two Sigma Advisers, Lp | 92 100 | −21,48 | 4 161 | 10,61 | ||||
| 2025-08-13 | 13F | Gabelli Funds Llc | 37 400 | 2,05 | 1 690 | 43,74 | ||||
| 2025-08-15 | 13F | WealthCollab, LLC | 1 342 | −7,38 | 61 | 30,43 | ||||
| 2025-08-29 | NP | SRIGX - Gabelli ESG Fund, Inc. Class AAA | 2 950 | 0,00 | 133 | 41,49 | ||||
| 2025-08-11 | 13F | Brown Brothers Harriman & Co | 260 | 12 | ||||||
| 2025-05-05 | 13F | Transce3nd, LLC | 0 | −100,00 | 0 | |||||
| 2025-08-14 | 13F | Aspen Grove Capital, LLC | 6 737 | 0,00 | 304 | 39,45 | ||||
| 2025-06-26 | NP | DFSE - Dimensional Emerging Markets Sustainability Core 1 ETF | 2 715 | 0,00 | 98 | 2,11 | ||||
| 2025-08-13 | 13F | Bare Financial Services, Inc | 230 | 223,94 | 10 | 400,00 | ||||
| 2025-08-04 | 13F | Creative Financial Designs Inc /adv | 4 | 0,00 | 0 | |||||
| 2025-08-14 | 13F | Fmr Llc | 115 083 | 121,85 | 5 199 | 212,44 | ||||
| 2025-08-12 | 13F | Wayfinding Financial, LLC | 0 | −100,00 | 0 | |||||
| 2025-05-09 | 13F | R Squared Ltd | 0 | −100,00 | 0 | |||||
| 2025-08-07 | 13F | Sierra Ocean, Llc | 1 193 | −4,41 | 54 | 32,50 | ||||
| 2025-08-12 | 13F | Dynamic Technology Lab Private Ltd | 26 454 | 1 195 | ||||||
| 2025-07-24 | 13F | IFP Advisors, Inc | 27 | −64,00 | 1 | −50,00 | ||||
| 2025-08-13 | 13F | Quantbot Technologies LP | 7 795 | −45,83 | 352 | −23,64 | ||||
| 2025-08-14 | 13F | Sei Investments Co | 115 603 | 10,82 | 5 223 | 56,07 | ||||
| 2025-05-13 | 13F | Mondrian Investment Partners LTD | 3 413 | 5,05 | 109 | −3,54 | ||||
| 2025-07-28 | 13F | Harbour Investments, Inc. | 71 | 0,00 | 3 | 50,00 | ||||
| 2025-05-14 | 13F | Boston Private Wealth Llc | 0 | −100,00 | 0 | |||||
| 2025-08-05 | 13F | Bank of New York Mellon Corp | 9 181 | 2,08 | 415 | 43,75 | ||||
| 2025-08-27 | NP | RYWTX - Emerging Markets 2x Strategy Fund Class A | 2 640 | 160,10 | 119 | 271,88 | ||||
| 2025-07-25 | 13F | Pzena Investment Management Llc | 1 027 646 | −4,73 | 46 429 | 34,17 | ||||
| 2025-08-08 | 13F | Crossmark Global Holdings, Inc. | 34 421 | 47,40 | 1 555 | 107,61 | ||||
| 2025-08-13 | 13F | M&t Bank Corp | 7 121 | 1,35 | 322 | 42,67 | ||||
| 2025-07-24 | 13F | Jfs Wealth Advisors, Llc | 613 | 6,42 | 28 | 50,00 | ||||
| 2025-08-14 | 13F | Smartleaf Asset Management LLC | 48 | −80,95 | 2 | −75,00 | ||||
| 2025-08-14 | 13F | Wells Fargo & Company/mn | 176 336 | 11,95 | 7 967 | 57,65 | ||||
| 2025-05-14 | 13F | Campbell & CO Investment Adviser LLC | 0 | −100,00 | 0 | |||||
| 2025-08-20 | NP | REMG - Emerging Markets Equity Active ETF | 5 531 | 250 | ||||||
| 2025-07-11 | 13F/A | Umb Bank N A/mo | 105 | 5 | ||||||
| 2025-07-09 | 13F | Sivia Capital Partners, LLC | 6 760 | −17,89 | 305 | 15,53 | ||||
| 2025-08-13 | 13F | Renaissance Technologies Llc | 96 800 | −60,00 | 4 373 | −43,67 | ||||
| 2025-07-23 | 13F | Canopy Partners, LLC | 4 735 | 214 | ||||||
| 2025-07-15 | 13F | Fifth Third Bancorp | 3 088 | 0,00 | 140 | 40,40 | ||||
| 2025-08-12 | 13F | Deutsche Bank Ag\ | 40 000 | 1 807 | ||||||
| 2025-07-25 | 13F | Yousif Capital Management, Llc | 50 571 | 7,20 | 2 285 | 50,96 | ||||
| 2025-08-13 | 13F | Townsquare Capital Llc | 0 | −100,00 | 0 | |||||
| 2025-08-12 | 13F | Aigen Investment Management, Lp | 0 | −100,00 | 0 | |||||
| 2025-08-01 | 13F | Y-Intercept (Hong Kong) Ltd | 25 197 | 1 138 | ||||||
| 2025-08-05 | 13F | Bridgewater Advisors Inc. | 9 187 | 1,10 | 451 | 40,50 | ||||
| 2025-08-12 | 13F | CIBC Private Wealth Group, LLC | 168 | −51,72 | 8 | −30,00 | ||||
| 2025-07-24 | 13F | Ramirez Asset Management, Inc. | 218 158 | 1,05 | 9 856 | 42,32 | ||||
| 2025-08-12 | 13F | Proequities, Inc. | 0 | 0 | ||||||
| 2025-08-07 | 13F | Montag A & Associates Inc | 173 | 0,00 | 8 | 40,00 | ||||
| 2025-08-05 | 13F | Carolinas Wealth Consulting Llc | 0 | −100,00 | 0 | |||||
| 2025-07-15 | 13F | Public Employees Retirement System Of Ohio | 60 389 | −8,72 | 2 728 | 28,56 | ||||
| 2025-07-22 | 13F | Boston Common Asset Management, LLC | 5 446 | 246 | ||||||
| 2025-08-04 | 13F | Hantz Financial Services, Inc. | 27 061 | 4,49 | 1 | |||||
| 2025-08-12 | 13F | Trexquant Investment LP | 45 359 | −36,43 | 2 049 | −10,48 | ||||
| 2025-07-15 | 13F | Ballentine Partners, LLC | 27 843 | 20,34 | 1 258 | 69,41 | ||||
| 2025-07-28 | NP | NSI - National Security Emerging Markets Index ETF | 2 581 | 38,69 | 107 | 81,36 | ||||
| 2025-08-12 | 13F | SRS Capital Advisors, Inc. | 1 076 | 631,97 | 93 | 2 200,00 | ||||
| 2025-08-13 | 13F | Grantham, Mayo, Van Otterloo & Co. LLC | 34 439 | 40,95 | 1 556 | 98,60 | ||||
| 2025-08-14 | 13F | Verition Fund Management LLC | 16 307 | −57,01 | 737 | −39,47 | ||||
| 2025-05-14 | 13F | Van Hulzen Asset Management, LLC | 0 | −100,00 | 0 | |||||
| 2025-07-17 | 13F | V-Square Quantitative Management LLC | 0 | −100,00 | 0 | |||||
| 2025-08-08 | 13F | Ranmore Fund Management Ltd | 529 000 | 8,18 | 23 900 | 52,36 | ||||
| 2025-08-04 | 13F | Assetmark, Inc | 270 | −84,20 | 12 | −77,78 | ||||
| 2025-08-13 | 13F | West Family Investments, Inc. | 7 547 | 19,95 | 341 | 69,15 | ||||
| 2025-08-14 | 13F | Mml Investors Services, Llc | 5 721 | 0 | ||||||
| 2025-04-07 | 13F | Summit Global Investments | 0 | −100,00 | 0 | |||||
| 2025-05-16 | 13F/A | Kestra Investment Management, LLC | 0 | −100,00 | 0 | |||||
| 2025-07-30 | 13F | Bleakley Financial Group, LLC | 15 061 | 12,81 | 680 | 58,88 | ||||
| 2025-08-29 | NP | SA FUNDS INVESTMENT TRUST - SA Emerging Markets Value Fund | 3 951 | −26,05 | 179 | 4,09 | ||||
| 2025-06-30 | NP | VEU - Vanguard FTSE All-World ex-US Index Fund ETF Shares | 349 494 | 2,48 | 12 575 | 5,28 | ||||
| 2025-07-28 | NP | AVEEX - Avantis Emerging Markets Equity Fund Institutional Class This fund is a listed as child fund of American Century Companies Inc and if that institution has disclosed ownership in this security, then these positions will not be double counted when calculating total shares and total value | 38 360 | 0,00 | 1 590 | 29,80 | ||||
| 2025-08-14 | 13F | Voloridge Investment Management, Llc | 158 744 | −35,47 | 7 172 | −9,12 | ||||
| 2025-08-14 | 13F | Riggs Asset Managment Co. Inc. | 108 | 5 | ||||||
| 2025-08-07 | 13F | Parkside Financial Bank & Trust | 96 | 4 | ||||||
| 2025-08-12 | 13F | MAI Capital Management | 3 987 | 12 359,38 | 180 | 17 900,00 | ||||
| 2025-08-14 | 13F | Integrated Wealth Concepts LLC | 6 877 | 311 | ||||||
| 2025-08-07 | 13F | Resources Investment Advisors, LLC. | 9 397 | −0,02 | 425 | 40,86 | ||||
| 2025-08-11 | 13F | NewEdge Wealth, LLC | 76 274 | 11,82 | 3 806 | 73,95 | ||||
| 2025-08-07 | 13F | Mitsubishi UFJ Kokusai Asset Management Co., Ltd. | 3 909 | 177 | ||||||
| 2025-08-13 | 13F | Schroder Investment Management Group | 40 336 | 129,38 | 1 822 | 225,36 | ||||
| 2025-08-14 | 13F | State Street Corp | 34 762 | 1 571 | ||||||
| 2025-07-17 | 13F | Oakworth Capital, Inc. | 0 | −100,00 | 0 | |||||
| 2025-08-12 | 13F | LPL Financial LLC | 17 282 | 57,62 | 781 | 122,22 | ||||
| 2025-07-29 | NP | GAAVX - GMO Alternative Allocation Fund Class VI | 4 901 | 203 | ||||||
| 2025-08-05 | 13F | Westside Investment Management, Inc. | 1 031 | 47 | ||||||
| 2025-08-28 | NP | QEMM - SPDR MSCI Emerging Markets StrategicFactors ETF | 1 895 | −3,95 | 86 | 34,92 | ||||
| 2025-08-11 | 13F | Lsv Asset Management | 10 900 | 0,00 | 0 | |||||
| 2025-08-19 | 13F | State of Wyoming | 0 | −100,00 | 0 | |||||
| 2025-08-14 | 13F | Goldman Sachs Group Inc | 216 548 | −33,05 | 9 784 | −5,72 | ||||
| 2025-06-26 | NP | DFEM - Dimensional Emerging Markets Core Equity 2 ETF | 54 429 | 0,00 | 1 958 | 2,73 | ||||
| 2025-07-25 | 13F | Natural Investments, Llc | 28 780 | 6,26 | 1 | |||||
| 2025-07-16 | 13F | Augustine Asset Management Inc | 6 375 | 0,00 | 288 | 41,18 | ||||
| 2025-06-13 | NP | JETIX - abrdn Global Equity Impact Fund Institutional Class | 22 468 | 808 | ||||||
| 2025-08-08 | 13F | D'Orazio & Associates, Inc. | 4 442 | 201 | ||||||
| 2025-08-13 | 13F | Brandes Investment Partners, Lp | 528 135 | 6,58 | 23 862 | 50,11 | ||||
| 2025-08-14 | 13F | Citadel Advisors Llc | Put | 0 | −100,00 | 0 | ||||
| 2025-08-14 | 13F | Evergreen Capital Management Llc | 6 769 | 306 | ||||||
| 2025-08-14 | 13F | Citadel Advisors Llc | Call | 0 | −100,00 | 0 | ||||
| 2025-08-11 | 13F | HighTower Advisors, LLC | 7 045 | −6,44 | 318 | 31,95 | ||||
| 2025-08-13 | 13F | Quadrant Capital Group Llc | 42 695 | 6,57 | 1 929 | 50,04 | ||||
| 2025-08-14 | 13F | Ameriprise Financial Inc | 8 247 | 7,58 | 373 | 51,84 | ||||
| 2025-08-07 | 13F | Profund Advisors Llc | 11 623 | 24,01 | 525 | 75,00 | ||||
| 2025-08-14 | 13F | D. E. Shaw & Co., Inc. | 168 776 | −54,51 | 7 625 | −35,94 | ||||
| 2025-08-11 | 13F | B. Metzler seel. Sohn & Co. AG | 92 459 | −23,60 | 4 177 | 7,60 | ||||
| 2025-08-15 | 13F | Tower Research Capital LLC (TRC) | 8 730 | 9 389,13 | 394 | 19 600,00 | ||||
| 2025-05-29 | NP | JNL SERIES TRUST - JNL Multi-Manager Alternative Fund (A) | 0 | −100,00 | 0 | −100,00 | ||||
| 2025-08-13 | 13F | Northwestern Mutual Wealth Management Co | 908 | 1 465,52 | 41 | 4 000,00 | ||||
| 2025-07-15 | 13F | Maseco Llp | 71 | 3 | ||||||
| 2025-09-04 | 13F/A | Advisor Group Holdings, Inc. | 1 306 | 387,31 | 59 | 625,00 | ||||
| 2025-08-06 | 13F | Savant Capital, LLC | 6 008 | 271 | ||||||
| 2025-08-14 | 13F | Bank Of America Corp /de/ | 682 335 | −1,89 | 30 828 | 38,17 | ||||
| 2025-08-15 | 13F | CI Private Wealth, LLC | 32 710 | 64,68 | 1 478 | 131,87 | ||||
| 2025-06-26 | NP | DFAE - Dimensional Emerging Core Equity Market ETF | 31 683 | 11,12 | 1 140 | 14,13 | ||||
| 2025-04-23 | 13F | Continuum Advisory, LLC | 0 | −100,00 | 0 | −100,00 | ||||
| 2025-08-14 | 13F | Wiley Bros.-aintree Capital, Llc | 5 335 | 241 | ||||||
| 2025-07-14 | 13F | Foster Group, Inc. | 4 449 | 201 | ||||||
| 2025-08-14 | 13F | Ieq Capital, Llc | 17 185 | 776 | ||||||
| 2025-08-08 | 13F | Sanders Capital, LLC | 161 866 | −6,82 | 7 313 | 31,25 | ||||
| 2025-08-29 | NP | Gabelli Equity Trust Inc | 12 200 | 0,00 | 551 | 40,92 | ||||
| 2025-07-08 | 13F | Rise Advisors, LLC | 8 | 300,00 | 0 | |||||
| 2025-08-12 | 13F | XTX Topco Ltd | 0 | −100,00 | 0 | |||||
| 2025-08-26 | NP | BINV - Brandes International ETF | 43 591 | 24,43 | 1 969 | 75,33 | ||||
| 2025-07-28 | 13F | Ritholtz Wealth Management | 71 143 | 4,69 | 3 214 | 47,43 | ||||
| 2025-08-14 | 13F | Bnp Paribas Arbitrage, Sa | 111 474 | −17,83 | 5 036 | 15,72 | ||||
| 2025-07-31 | 13F | ARGA Investment Management, LP | 16 200 | 0,00 | 732 | 40,85 | ||||
| 2025-08-14 | 13F | Citadel Advisors Llc | 100 152 | 307,16 | 4 525 | 473,38 | ||||
| 2025-08-12 | 13F | Clearbridge Investments, LLC | 162 926 | 4,37 | 7 361 | 46,99 | ||||
| 2025-08-14 | 13F | Susquehanna International Group, Llp | Put | 0 | −100,00 | 0 | ||||
| 2025-06-26 | NP | DFAX - Dimensional World ex U.S. Core Equity 2 ETF | 18 999 | 16,33 | 684 | 19,61 | ||||
| 2025-08-13 | 13F | Jones Financial Companies Lllp | 164 | 7 | ||||||
| 2025-08-04 | 13F | AMG National Trust Bank | 52 300 | 0,88 | 2 363 | 42,03 | ||||
| 2025-08-14 | 13F | Susquehanna International Group, Llp | 0 | −100,00 | 0 | |||||
| 2025-08-11 | 13F | United Capital Financial Advisers, Llc | 8 045 | −3,96 | 363 | 35,45 | ||||
| 2025-06-26 | NP | DFEV - Dimensional Emerging Markets Value ETF | 18 359 | 279,95 | 661 | 290,53 | ||||
| 2025-08-13 | 13F | GeoWealth Management, LLC | 6 516 | 294 | ||||||
| 2025-08-06 | 13F | First Horizon Advisors, Inc. | 32 | 1 | ||||||
| 2025-05-05 | 13F | Lindbrook Capital, Llc | 4 207 | 0,12 | 135 | −2,90 | ||||
| 2025-07-21 | 13F | Qrg Capital Management, Inc. | 16 928 | 7,59 | 765 | 51,59 | ||||
| 2025-08-12 | 13F | O'shaughnessy Asset Management, Llc | 162 782 | 2,60 | 7 354 | 44,51 | ||||
| 2025-08-12 | 13F | American Century Companies Inc | 979 011 | 16,52 | 44 232 | 64,10 | ||||
| 2025-06-26 | NP | HFIGX - Hartford Schroders Diversified Growth Fund Class I | 2 436 | 30,06 | 88 | 33,85 | ||||
| 2025-07-30 | 13F | Whittier Trust Co | 253 | 11 | ||||||
| 2025-08-13 | 13F | Guggenheim Capital Llc | 17 131 | −10,75 | 774 | 25,69 | ||||
| 2025-08-26 | NP | Profunds - Profund Vp Emerging Markets | 8 470 | 16,63 | 383 | 64,66 | ||||
| 2025-04-24 | 13F | Trust Co Of Vermont | 0 | −100,00 | 0 | |||||
| 2025-05-15 | 13F | Jain Global LLC | 0 | −100,00 | 0 | |||||
| 2025-08-15 | 13F | Morgan Stanley | 1 672 173 | −2,20 | 75 549 | 37,74 | ||||
| 2025-08-13 | 13F | Federated Hermes, Inc. | 651 | 0,00 | 29 | 45,00 | ||||
| 2025-07-25 | 13F | JustInvest LLC | 75 468 | 30,08 | 3 410 | 83,18 | ||||
| 2025-07-10 | 13F | Kozak & Associates, Inc. | 69 | 0,00 | 3 | 50,00 | ||||
| 2025-07-24 | 13F | Ronald Blue Trust, Inc. | 25 242 | 21,58 | 1 140 | 71,17 | ||||
| 2025-08-05 | 13F | Key FInancial Inc | 149 | 0,00 | 7 | 50,00 | ||||
| 2025-08-08 | 13F/A | Sterling Capital Management LLC | 7 359 | −11,95 | 332 | 23,88 | ||||
| 2025-08-14 | 13F | Lazard Asset Management Llc | 1 497 967 | 2,78 | 68 | 45,65 | ||||
| 2025-08-14 | 13F | Cubist Systematic Strategies, LLC | 64 869 | 104,32 | 2 931 | 187,82 | ||||
| 2025-06-26 | NP | DFCEX - Emerging Markets Core Equity Portfolio - Institutional Class This fund is a listed as child fund of Dimensional Fund Advisors Lp and if that institution has disclosed ownership in this security, then these positions will not be double counted when calculating total shares and total value | 269 770 | 0,00 | 9 706 | 2,74 | ||||
| 2025-06-26 | NP | Dfa Investment Trust Co - The Emerging Markets Series This fund is a listed as child fund of Dimensional Fund Advisors Lp and if that institution has disclosed ownership in this security, then these positions will not be double counted when calculating total shares and total value | 34 854 | −11,19 | 1 254 | −8,73 | ||||
| 2025-07-28 | NP | AVES - Avantis Emerging Markets Value ETF This fund is a listed as child fund of American Century Companies Inc and if that institution has disclosed ownership in this security, then these positions will not be double counted when calculating total shares and total value | 104 377 | 4,76 | 4 327 | 35,94 | ||||
| 2025-08-12 | 13F | Insigneo Advisory Services, Llc | 0 | −100,00 | 0 | |||||
| 2025-08-14 | 13F | Engineers Gate Manager LP | 7 992 | 361 | ||||||
| 2025-07-30 | 13F | Drive Wealth Management, Llc | 4 453 | 201 | ||||||
| 2025-08-08 | NP | QGBLX - Quantified Global Fund Investor Class | 77 059 | 3 482 | ||||||
| 2025-08-07 | 13F | Hosking Partners LLP | 10 640 | 481 | ||||||
| 2025-08-12 | 13F | Atlas Capital Advisors Llc | 2 596 | −16,98 | 117 | 17,00 | ||||
| 2025-08-08 | 13F | Calamos Advisors LLC | 28 416 | 0,06 | 1 284 | 40,83 | ||||
| 2025-08-25 | 13F/A | Neuberger Berman Group LLC | 82 950 | 15,05 | 3 716 | 59,69 | ||||
| 2025-06-26 | NP | DEXC - Dimensional Emerging Markets ex China Core Equity ETF | 8 782 | 21,55 | 316 | 24,51 | ||||
| 2025-08-14 | 13F | CIBC World Markets Inc. | 53 418 | −0,41 | 2 413 | 40,29 | ||||
| 2025-08-06 | 13F | Paradigm Asset Management Co Llc | 1 100 | 0,00 | 50 | 40,00 | ||||
| 2025-08-14 | 13F | Promethos Capital, LLC | 180 666 | −10,72 | 8 173 | 25,91 | ||||
| 2025-08-14 | 13F | Qube Research & Technologies Ltd | 97 512 | −64,54 | 4 406 | −50,07 | ||||
| 2025-08-13 | 13F | Invesco Ltd. | 33 581 | −14,97 | 1 517 | 19,83 | ||||
| 2025-08-14 | 13F | Vident Advisory, LLC | 88 505 | −7,22 | 3 999 | 30,65 | ||||
| 2025-05-02 | 13F | Cable Hill Partners, LLC | 0 | −100,00 | 0 | |||||
| 2025-07-25 | 13F | Cwm, Llc | 3 439 | −6,04 | 0 | |||||
| 2025-08-11 | 13F | Bell Investment Advisors, Inc | 374 | 8,72 | 17 | 45,45 | ||||
| 2025-08-12 | 13F | Global Retirement Partners, LLC | 8 618 | 4 741,57 | 389 | 7 680,00 | ||||
| 2025-08-12 | 13F | Pathstone Holdings, LLC | 89 824 | −2,01 | 4 058 | 38,07 | ||||
| 2025-08-13 | 13F | Natixis Advisors, L.p. | 101 714 | 11,64 | 5 | 100,00 | ||||
| 2025-07-15 | 13F | Financial Management Professionals, Inc. | 22 | 0,00 | 1 | |||||
| 2025-08-14 | 13F | Atomi Financial Group, Inc. | 14 195 | 26,28 | 641 | 78,06 | ||||
| 2025-08-28 | NP | KOMP - SPDR S&P Kensho New Economies Composite ETF This fund is a listed as child fund of State Street Corp and if that institution has disclosed ownership in this security, then these positions will not be double counted when calculating total shares and total value | 32 076 | 1 449 | ||||||
| 2025-06-13 | NP | abrdn Funds - abrdn Emerging Markets Dividend Active ETF | 7 784 | 280 | ||||||
| 2025-05-05 | 13F | Eagle Bay Advisors LLC | 0 | −100,00 | 0 | −100,00 | ||||
| 2025-08-06 | 13F | Golden State Wealth Management, LLC | 42 | 2 | ||||||
| 2025-08-14 | 13F | Glenmede Investment Management, LP | 5 197 | 235 | ||||||
| 2025-08-14 | 13F | Wellington Management Group Llp | 258 157 | −0,40 | 11 664 | 40,28 | ||||
| 2025-08-05 | 13F | Huntington National Bank | 150 | 2,74 | 7 | 50,00 | ||||
| 2025-08-14 | 13F | Mercer Global Advisors Inc /adv | 8 199 | −9,26 | 370 | 28,03 | ||||
| 2025-07-25 | 13F | Sequoia Financial Advisors, LLC | 24 934 | 26,03 | 1 127 | 77,60 | ||||
| 2025-07-28 | 13F | BRYN MAWR TRUST Co | 129 | 0,00 | 6 | 25,00 | ||||
| 2025-08-14 | 13F | Quantinno Capital Management LP | 75 943 | 77,46 | 3 431 | 150,07 | ||||
| 2025-08-12 | 13F | Rhumbline Advisers | 57 190 | −13,68 | 2 584 | 21,55 | ||||
| 2025-08-29 | NP | MPLAX - Praxis International Index Fund Class A | 10 792 | 0,00 | 488 | 40,75 | ||||
| 2025-06-26 | NP | Dimensional Emerging Markets Value Fund - Dimensional Emerging Markets Value Fund This fund is a listed as child fund of Dimensional Fund Advisors Lp and if that institution has disclosed ownership in this security, then these positions will not be double counted when calculating total shares and total value | 960 156 | −3,28 | 34 546 | −0,63 | ||||
| 2025-07-24 | 13F | Us Bancorp \de\ | 30 883 | 7,97 | 1 395 | 52,13 | ||||
| 2025-07-08 | 13F | Nbc Securities, Inc. | 6 980 | −0,68 | 0 | |||||
| 2025-08-27 | 13F/A | Brinker Capital Investments, LLC | 67 241 | 11,43 | 3 038 | 56,95 | ||||
| 2025-08-13 | 13F | Walleye Capital LLC | 13 986 | 37,28 | 632 | 93,56 | ||||
| 2025-08-15 | 13F | Binnacle Investments Inc | 327 | 0,00 | 15 | 40,00 | ||||
| 2025-07-30 | NP | PZINX - Pzena International Value Fund Institutional | 3 710 | 0,00 | 154 | 29,66 | ||||
| 2025-07-17 | 13F | Park Place Capital Corp | 212 | 0,00 | 10 | 50,00 | ||||
| 2025-07-30 | 13F | Ethic Inc. | 29 839 | −48,10 | 1 322 | −29,38 | ||||
| 2025-07-17 | 13F | HB Wealth Management, LLC | 5 841 | −7,61 | 264 | 30,20 | ||||
| 2025-08-13 | 13F | Groupama Asset Managment | 17 525 | 1,92 | 777 | 41,61 | ||||
| 2025-08-07 | 13F | Allworth Financial LP | 2 049 | 7,33 | 93 | 39,39 | ||||
| 2025-08-11 | 13F | Vanguard Group Inc | 297 024 | −24,69 | 13 420 | 6,06 | ||||
| 2025-08-29 | NP | JVANX - International Equity Index Trust NAV | 350 | 0,00 | 16 | 36,36 | ||||
| 2025-07-31 | 13F | Oppenheimer Asset Management Inc. | 27 509 | 1,13 | 1 243 | 42,43 | ||||
| 2025-08-13 | 13F | Cerity Partners LLC | 49 664 | −7,95 | 2 244 | 29,65 | ||||
| 2025-05-01 | 13F | Schechter Investment Advisors, LLC | 22 065 | −19,35 | 708 | −21,36 | ||||
| 2025-08-04 | 13F | Simon Quick Advisors, Llc | 5 080 | 230 | ||||||
| 2025-08-14 | 13F | Millennium Management Llc | 286 383 | −50,84 | 12 939 | −30,77 | ||||
| 2025-07-16 | 13F | Signaturefd, Llc | 28 140 | −9,58 | 1 271 | 27,35 | ||||
| 2025-07-08 | 13F | Arlington Trust Co LLC | 18 | 1 | ||||||
| 2025-08-29 | NP | GFSIX - The Gabelli Global Financial Services Fund CLASS I | 22 250 | 3,49 | 1 005 | 45,86 | ||||
| 2025-08-12 | 13F | Jpmorgan Chase & Co | 362 259 | −26,47 | 16 367 | 3,56 | ||||
| 2025-08-13 | 13F | Twin Peaks Wealth Advisors, LLC | 239 | 12 | ||||||
| 2025-07-28 | NP | AVEM - Avantis Emerging Markets Equity ETF This fund is a listed as child fund of American Century Companies Inc and if that institution has disclosed ownership in this security, then these positions will not be double counted when calculating total shares and total value | 799 489 | 21,23 | 33 147 | 57,31 | ||||
| 2025-08-14 | 13F | Aquatic Capital Management LLC | 2 509 | −88,83 | 113 | −84,31 |