Grundläggande statistik
| Institutionella ägare | 181 total, 175 long only, 0 short only, 6 long/short - change of 7,74% MRQ |
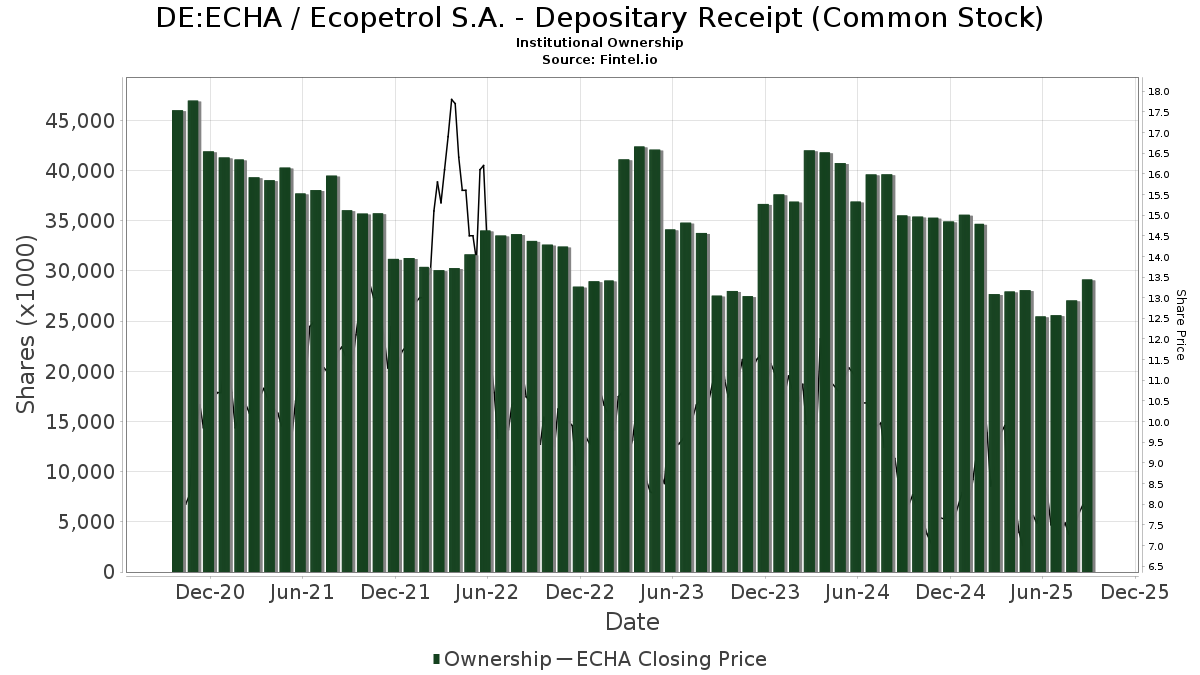
| Aktiepris | 7,68 |
| Genomsnittlig portföljallokering | 0.1433 % - change of −17,02% MRQ |
| Institutionella aktier (lång) | 29 152 457 (ex 13D/G) - change of 3,68MM shares 14,45% MRQ |
| Institutionellt värde (lång) | $ 251 669 USD ($1000) |
Institutionellt ägande och aktieägare
Ecopetrol S.A. - Depositary Receipt (Common Stock) (DE:ECHA) har 181 Institutionella ägare och aktieägare som har lämnat in 13D/G- eller 13F-formulär till Securities Exchange Commission (SEC). Dessa institut innehar totalt 29,152,457 aktier. Största aktieägare inkluderar Oaktree Capital Management Lp, Vanguard Group Inc, Russell Investments Group, Ltd., BlackRock, Inc., MIRAE ASSET GLOBAL ETFS HOLDINGS Ltd., Charles Schwab Investment Management Inc, FNDE - Schwab Fundamental Emerging Markets Large Company Index ETF, VEIEX - Vanguard Emerging Markets Stock Index Fund Investor Shares, ILF - iShares Latin America 40 ETF, and Candriam Luxembourg S.C.A. .
Ecopetrol S.A. - Depositary Receipt (Common Stock) (DB:ECHA) Institutionell ägarstruktur visar institutioners och fonders nuvarande positioner i företaget, samt de senaste förändringarna i positionernas storlek. Större aktieägare kan vara enskilda investerare, fonder, hedgefonder eller institutioner. Bilaga 13D visar att investeraren äger (eller ägde) mer än 5% av företaget och avser (eller avsåg) att aktivt eftersträva en förändring av affärsstrategin. Schedule 13G indikerar en passiv investering på över 5%.
The share price as of September 9, 2025 is 7,68 / share. Previously, on September 10, 2024, the share price was 7,94 / share. This represents a decline of 3,27% over that period.
Fondsentimentets poäng
Fondsentimentet poängen(fka Ägarackumulation-poäng) visar vilka aktier som är mest köpta av fonder. Det är resultatet av en sofistikerad kvantitativ flerfaktormodell som identifierar företag med de högsta nivåerna av institutionell ackumulering. Poängsättningsmodellen använder en kombination av den totala ökningen av redovisade ägare, förändringarna i portföljallokeringarna för dessa ägare och andra mått. Siffran sträcker sig från 0 till 100, där högre siffror indikerar en högre nivå av ackumulering i förhållande till sina konkurrenter, och 50 är genomsnittet.
Uppdateringsfrekvens: Dagligen
Se Ownership Explorer, som innehåller en lista över de högst rankade företagen.
13F- och NPORT-arkiveringar
Detaljer om 13F-arkiveringar är gratis. Detaljer om NP-arkiveringar kräver ett premiummedlemskap. Gröna rader indikerar nya positioner. Röda rader indikerar stängda positioner. Klicka på länk symbolen för att se hela transaktionshistoriken.
Uppgradera
för att låsa upp premiumdata och exportera till Excel ![]() .
.
| Fil Datum | Källa | Investerare | Typ | Genomsnittligt pris (beräknat) |
Aktier | Δ Aktier (%) |
Rapporterat värde (1000 USD) |
Δ Värde (%) |
Portföljallokering (%) |
|
|---|---|---|---|---|---|---|---|---|---|---|
| 2025-08-26 | NP | RPAR - RPAR Risk Parity ETF | 27 176 | −6,27 | 241 | −20,53 | ||||
| 2025-05-15 | 13F | Bayesian Capital Management, LP | 0 | −100,00 | 0 | |||||
| 2025-08-14 | 13F | Hrt Financial Lp | 40 610 | 0 | ||||||
| 2025-08-08 | 13F | Candriam Luxembourg S.C.A. | 841 000 | 7 443 | ||||||
| 2025-08-07 | 13F | Rathbone Brothers plc | 17 575 | −2,23 | 156 | −17,11 | ||||
| 2025-04-23 | 13F | Legacy Advisors, LLC | 0 | −100,00 | 0 | |||||
| 2025-07-14 | 13F | Sowell Financial Services LLC | 11 468 | 3,29 | 101 | −12,17 | ||||
| 2025-08-13 | 13F | Walleye Trading LLC | Call | 228 400 | 2 021 | |||||
| 2025-08-18 | 13F/A | National Bank Of Canada /fi/ | 145 | −99,25 | 1 | −99,50 | ||||
| 2025-08-13 | 13F | Walleye Trading LLC | Put | 20 900 | −83,50 | 185 | −86,08 | |||
| 2025-08-05 | 13F | Simplex Trading, Llc | Put | 47 700 | −51,67 | 0 | −100,00 | |||
| 2025-08-05 | 13F | Simplex Trading, Llc | Call | 97 900 | 21,46 | 1 | ||||
| 2025-08-12 | 13F | O'shaughnessy Asset Management, Llc | 50 363 | 397,90 | 446 | 323,81 | ||||
| 2025-08-29 | NP | LIVR - Intelligent Livermore ETF | 18 077 | 160 | ||||||
| 2025-08-14 | 13F | D. E. Shaw & Co., Inc. | 208 080 | 1 842 | ||||||
| 2025-08-13 | 13F | Walleye Trading LLC | 0 | −100,00 | 0 | −100,00 | ||||
| 2025-08-13 | 13F | Virtus Investment Advisers, Inc. | 17 435 | −11,14 | 154 | −24,51 | ||||
| 2025-08-11 | 13F | Truffle Hound Capital, LLC | 550 000 | 83,33 | 4 868 | 55,40 | ||||
| 2025-07-30 | 13F | DekaBank Deutsche Girozentrale | 20 000 | 0,00 | 0 | |||||
| 2025-08-14 | 13F | Militia Capital Partners, LP | 556 200 | 16,07 | 4 922 | −1,60 | ||||
| 2025-05-09 | 13F | R Squared Ltd | 0 | −100,00 | 0 | |||||
| 2025-08-14 | 13F | Susquehanna International Group, Llp | 34 063 | −85,16 | 301 | −87,44 | ||||
| 2025-08-14 | 13F | Susquehanna International Group, Llp | Call | 163 900 | −16,63 | 1 451 | −29,34 | |||
| 2025-08-14 | 13F | Susquehanna International Group, Llp | Put | 51 700 | −91,38 | 458 | −92,70 | |||
| 2025-07-28 | NP | AVEEX - Avantis Emerging Markets Equity Fund Institutional Class This fund is a listed as child fund of American Century Companies Inc and if that institution has disclosed ownership in this security, then these positions will not be double counted when calculating total shares and total value | 3 730 | 0,00 | 32 | −13,89 | ||||
| 2025-08-11 | 13F | Empirical Finance, LLC | 300 866 | 73,90 | 2 663 | 47,40 | ||||
| 2025-08-13 | 13F | Manning & Napier Advisors Llc | 213 858 | 34,97 | 1 893 | 14,39 | ||||
| 2025-08-14 | 13F | Group One Trading, L.p. | 52 176 | 25,29 | 462 | 6,22 | ||||
| 2025-08-14 | 13F | Group One Trading, L.p. | Put | 58 500 | 5,60 | 518 | −10,55 | |||
| 2025-08-12 | 13F | Legal & General Group Plc | 149 470 | 0,00 | 1 322 | −15,36 | ||||
| 2025-08-14 | 13F | Group One Trading, L.p. | Call | 102 300 | 80,11 | 905 | 52,87 | |||
| 2025-03-17 | NP | ABLD - Donoghue Forlines Yield Enhanced Real Asset ETF | 11 031 | −49,51 | 102 | −39,29 | ||||
| 2025-08-14 | 13F | Gotham Asset Management, LLC | 10 000 | 0,00 | 88 | −15,38 | ||||
| 2025-05-06 | 13F | Cetera Investment Advisers | 0 | −100,00 | 0 | |||||
| 2025-08-13 | 13F | Russell Investments Group, Ltd. | 1 903 377 | −6,86 | 16 845 | −21,05 | ||||
| 2025-08-12 | 13F | CIBC Private Wealth Group, LLC | 251 | 2 | ||||||
| 2025-08-28 | NP | Principal Diversified Select Real Asset Fund | 389 | 0,00 | 3 | −25,00 | ||||
| 2025-06-18 | NP | RAZAX - Multi-Asset Growth Strategy Fund Class A | 13 826 | 0,00 | 112 | −12,50 | ||||
| 2025-06-18 | NP | RMYAX - Multi-Strategy Income Fund Class A | 4 238 | 0,00 | 34 | −12,82 | ||||
| 2025-08-06 | 13F | Metis Global Partners, LLC | 11 773 | 104 | ||||||
| 2025-08-26 | NP | GLBIX - Leuthold Global Fund Institutional Class | 6 745 | 60 | ||||||
| 2025-07-21 | 13F | Ping Capital Management, Inc. | 39 000 | 8,33 | 345 | −8,00 | ||||
| 2025-08-25 | NP | MAINSTAY VP FUNDS TRUST - MainStay VP Emerging Markets Equity Portfolio Initial Class | 120 000 | 42,86 | 1 062 | 16,45 | ||||
| 2025-08-26 | NP | EQ ADVISORS TRUST - EQ/International Core Managed Volatility Portfolio Class IB | 60 372 | −9,14 | 534 | −22,94 | ||||
| 2025-08-13 | 13F | First Trust Advisors Lp | 0 | −100,00 | 0 | |||||
| 2025-08-15 | 13F | Earnest Partners Llc | 443 848 | −3,13 | 3 928 | −17,88 | ||||
| 2025-08-14 | 13F | Balyasny Asset Management Llc | 0 | −100,00 | 0 | |||||
| 2025-09-04 | 13F/A | Advisor Group Holdings, Inc. | 146 072 | 24,36 | 1 293 | 5,38 | ||||
| 2025-08-06 | 13F | Pekin Hardy Strauss, Inc. | 124 573 | 3,75 | 1 102 | −12,05 | ||||
| 2025-08-01 | 13F | Y-Intercept (Hong Kong) Ltd | 252 697 | 2 236 | ||||||
| 2025-08-14 | 13F | Axa S.a. | 30 620 | 271 | ||||||
| 2025-08-11 | 13F | Principal Securities, Inc. | 0 | −100,00 | 0 | |||||
| 2025-08-14 | 13F | Wetherby Asset Management Inc | 12 769 | −12,08 | 113 | −1,74 | ||||
| 2025-08-14 | 13F | Ameriprise Financial Inc | 0 | −100,00 | 0 | |||||
| 2025-08-15 | 13F | Tower Research Capital LLC (TRC) | 2 933 | −45,89 | 26 | −55,36 | ||||
| 2025-08-14 | 13F | Citadel Advisors Llc | 173 200 | −37,57 | 1 533 | −47,10 | ||||
| 2025-06-20 | NP | ABLG - TrimTabs All Cap International Free-Cash-Flow ETF | 0 | −100,00 | 0 | −100,00 | ||||
| 2025-08-14 | 13F | Citadel Advisors Llc | Put | 23 400 | −29,52 | 207 | −40,17 | |||
| 2025-08-14 | 13F | Stifel Financial Corp | 29 586 | 0,33 | 262 | −14,98 | ||||
| 2025-08-26 | NP | ILF - iShares Latin America 40 ETF | 864 786 | 9,35 | 7 653 | −7,30 | ||||
| 2025-08-14 | 13F | Citadel Advisors Llc | Call | 118 600 | 1,37 | 1 050 | −14,09 | |||
| 2025-07-11 | 13F | Farther Finance Advisors, LLC | 1 625 | −5,08 | 14 | −22,22 | ||||
| 2025-08-13 | 13F | Leuthold Group, Llc | 26 071 | 231 | ||||||
| 2025-08-13 | 13F | Northwestern Mutual Wealth Management Co | 0 | −100,00 | 0 | |||||
| 2025-07-25 | NP | FNDE - Schwab Fundamental Emerging Markets Large Company Index ETF This fund is a listed as child fund of Charles Schwab Investment Management Inc and if that institution has disclosed ownership in this security, then these positions will not be double counted when calculating total shares and total value | 927 528 | 46,99 | 7 856 | 26,02 | ||||
| 2025-08-13 | 13F | Marshall Wace, Llp | 37 600 | 333 | ||||||
| 2025-04-22 | 13F | Synergy Financial Management, LLC | 0 | −100,00 | 0 | |||||
| 2025-07-14 | 13F | GAMMA Investing LLC | 20 679 | −20,81 | 183 | −32,72 | ||||
| 2025-08-12 | 13F | Global Retirement Partners, LLC | 498 | 12,42 | 4 | 33,33 | ||||
| 2025-08-13 | 13F | EverSource Wealth Advisors, LLC | 1 707 | 1 023,03 | 15 | 1 400,00 | ||||
| 2025-08-08 | 13F | Avantax Advisory Services, Inc. | 37 856 | 273,22 | 335 | 219,05 | ||||
| 2025-08-13 | 13F | Oaktree Capital Management Lp | 3 549 822 | 12,26 | 31 416 | −4,84 | ||||
| 2025-08-04 | 13F | Spire Wealth Management | 2 500 | −69,51 | 22 | −74,12 | ||||
| 2025-08-05 | 13F | GHP Investment Advisors, Inc. | 0 | −100,00 | 0 | |||||
| 2025-08-26 | NP | OEQAX - Oaktree Emerging Markets Equity Fund Class A | 207 885 | 3,48 | 1 840 | −12,30 | ||||
| 2025-07-18 | 13F | Robeco Institutional Asset Management B.V. | 99 796 | 0,00 | 883 | −15,18 | ||||
| 2025-07-21 | 13F | Patriot Financial Group Insurance Agency, LLC | 19 780 | 175 | ||||||
| 2025-08-14 | 13F | Two Sigma Investments, Lp | 222 160 | 26,24 | 1 966 | 7,02 | ||||
| 2025-08-06 | 13F | Stokes Family Office, LLC | 212 808 | 25,19 | 1 883 | 6,14 | ||||
| 2025-07-25 | NP | PRDAX - Diversified Real Asset Fund Class A | 4 662 | 48,42 | 39 | 25,81 | ||||
| 2025-08-14 | 13F | Goldman Sachs Group Inc | 612 058 | −0,41 | 5 417 | −15,59 | ||||
| 2025-05-14 | 13F | Public Employees Retirement System Of Ohio | 0 | −100,00 | 0 | |||||
| 2025-07-07 | 13F | Thurston, Springer, Miller, Herd & Titak, Inc. | 26 | 0 | ||||||
| 2025-07-24 | 13F | Us Bancorp \de\ | 2 069 | 0,00 | 18 | −14,29 | ||||
| 2025-08-14 | 13F | State Street Corp | 281 818 | 0,27 | 2 494 | −15,00 | ||||
| 2025-07-21 | 13F | Qrg Capital Management, Inc. | 0 | −100,00 | 0 | |||||
| 2025-08-12 | 13F | Proequities, Inc. | Put | 0 | 0 | |||||
| 2025-08-12 | 13F | Proequities, Inc. | Call | 0 | 0 | |||||
| 2025-08-12 | 13F | Proequities, Inc. | 0 | 0 | ||||||
| 2025-08-13 | 13F | Northern Trust Corp | 118 193 | −6,16 | 1 046 | −20,40 | ||||
| 2025-05-13 | 13F | Wealthedge Investment Advisors, Llc | 0 | −100,00 | 0 | |||||
| 2025-05-15 | 13F | D. E. Shaw & Co., Inc. | Put | 0 | −100,00 | 0 | −100,00 | |||
| 2025-08-12 | 13F | Advisors Asset Management, Inc. | 83 564 | −7,52 | 740 | −21,63 | ||||
| 2025-08-14 | 13F/A | Skopos Labs, Inc. | 36 136 | 138,76 | 320 | 101,90 | ||||
| 2025-08-11 | 13F | Citigroup Inc | 217 491 | −0,75 | 1 925 | −15,87 | ||||
| 2025-08-12 | 13F | LPL Financial LLC | 112 205 | 9,91 | 993 | −6,76 | ||||
| 2025-05-12 | 13F | Connor, Clark & Lunn Investment Management Ltd. | 0 | −100,00 | 0 | −100,00 | ||||
| 2025-07-15 | 13F | Compagnie Lombard Odier SCmA | 0 | −100,00 | 0 | −100,00 | ||||
| 2025-05-14 | 13F | FORA Capital, LLC | 0 | −100,00 | 0 | |||||
| 2025-07-28 | NP | NSI - National Security Emerging Markets Index ETF | 2 485 | 38,44 | 21 | 23,53 | ||||
| 2025-08-14 | 13F | Vident Advisory, LLC | 49 191 | −2,57 | 435 | −17,46 | ||||
| 2025-04-15 | 13F | TrimTabs Asset Management, LLC | 0 | −100,00 | 0 | |||||
| 2025-07-31 | 13F | Caitong International Asset Management Co., Ltd | 698 | 35,53 | 6 | 20,00 | ||||
| 2025-08-11 | 13F | Empowered Funds, LLC | 318 943 | 2 823 | ||||||
| 2025-07-29 | NP | SSEAX - SIIT Screened World Equity Ex-US Fund - Class A | 6 263 | 53 | ||||||
| 2025-08-20 | NP | REMG - Emerging Markets Equity Active ETF | 6 895 | 61 | ||||||
| 2025-08-13 | 13F | Fisher Asset Management, LLC | 456 819 | 3,15 | 4 043 | −12,57 | ||||
| 2025-07-16 | 13F | ORG Partners LLC | 375 | −28,98 | 3 | −40,00 | ||||
| 2025-08-14 | 13F | Verition Fund Management LLC | 309 922 | 124,49 | 2 743 | 90,28 | ||||
| 2025-08-26 | NP | UPAR - UPAR Ultra Risk Parity ETF | 4 494 | −11,20 | 40 | −25,00 | ||||
| 2025-08-15 | 13F | Great West Life Assurance Co /can/ | 6 874 | 0,00 | 0 | |||||
| 2025-08-12 | 13F | MAI Capital Management | 491 | 4 | ||||||
| 2025-08-07 | 13F | Sierra Ocean, Llc | 125 | 0,00 | 1 | 0,00 | ||||
| 2025-08-14 | 13F | Sona Asset Management (us) Llc | 200 000 | 100,00 | 1 770 | 69,54 | ||||
| 2025-07-15 | 13F | Ballentine Partners, LLC | 12 483 | −22,60 | 110 | −34,52 | ||||
| 2025-05-05 | 13F | Lindbrook Capital, Llc | 4 746 | −0,79 | 50 | 32,43 | ||||
| 2025-08-14 | 13F | UBS Group AG | 760 367 | 62,38 | 6 729 | 37,66 | ||||
| 2025-08-14 | 13F | Massar Capital Management, LP | 40 000 | 0,00 | 354 | −15,11 | ||||
| 2025-08-04 | 13F | Assetmark, Inc | 71 | 1 | ||||||
| 2025-08-14 | 13F | Aquatic Capital Management LLC | 0 | −100,00 | 0 | |||||
| 2025-06-25 | NP | VRAI - Virtus Real Asset Income ETF | 15 324 | −21,04 | 124 | −31,11 | ||||
| 2025-07-08 | 13F | Parallel Advisors, LLC | 5 440 | −3,68 | 48 | −17,24 | ||||
| 2025-08-14 | 13F | Royal Bank Of Canada | 258 225 | 12 753,41 | 2 285 | 10 780,95 | ||||
| 2025-08-14 | 13F | Barometer Capital Management Inc. | 43 400 | 45,15 | 384 | 36,65 | ||||
| 2025-08-26 | NP | IXC - iShares Global Energy ETF | 164 711 | 1,04 | 1 458 | −14,34 | ||||
| 2025-07-21 | 13F | Platinum Investment Management Ltd | 14 711 | 0,00 | 130 | −15,03 | ||||
| 2025-05-12 | 13F | Simplex Trading, Llc | 0 | −100,00 | 0 | |||||
| 2025-08-12 | 13F | Jpmorgan Chase & Co | 82 728 | −90,68 | 732 | −92,10 | ||||
| 2025-07-28 | 13F | Allianz Asset Management GmbH | 451 674 | 3 997 | ||||||
| 2025-08-14 | 13F | Wealth High Governance Capital Ltda | 186 000 | 0,00 | 1 646 | −15,20 | ||||
| 2025-05-09 | 13F | X-Square Capital, LLC | 0 | −100,00 | 0 | |||||
| 2025-08-14 | 13F | Schonfeld Strategic Advisors LLC | 181 551 | 202,85 | 1 607 | 156,96 | ||||
| 2025-08-14 | 13F | Mariner, LLC | 33 356 | −2,79 | 295 | −17,60 | ||||
| 2025-08-01 | 13F | Envestnet Asset Management Inc | 10 458 | 93 | ||||||
| 2025-08-12 | 13F | XTX Topco Ltd | 0 | −100,00 | 0 | |||||
| 2025-08-14 | 13F | Integrated Wealth Concepts LLC | 31 966 | 283 | ||||||
| 2025-08-11 | 13F | EntryPoint Capital, LLC | 17 568 | 7,25 | 155 | −9,36 | ||||
| 2025-08-11 | 13F | Private Advisor Group, LLC | 25 797 | 9,49 | 228 | −6,94 | ||||
| 2025-08-13 | 13F | Capital Fund Management S.a. | 165 697 | 529,64 | 1 466 | 435,04 | ||||
| 2025-07-21 | 13F | Mirae Asset Global Investments Co., Ltd. | 4 794 | 8,27 | 42 | −6,67 | ||||
| 2025-07-30 | 13F | Blume Capital Management, Inc. | 0 | −100,00 | 0 | |||||
| 2025-08-14 | 13F | Two Sigma Securities, Llc | 29 342 | 50,42 | 260 | 27,59 | ||||
| 2025-06-30 | NP | VIHAX - Vanguard International High Dividend Yield Index Fund Admiral Shares | 161 378 | 11,70 | 1 309 | −2,39 | ||||
| 2025-07-16 | 13F | Signaturefd, Llc | 7 452 | −32,96 | 66 | −43,97 | ||||
| 2025-08-14 | 13F | Graham Capital Management, L.P. | 0 | −100,00 | 0 | |||||
| 2025-08-13 | 13F | Oaktree Fund Advisors, LLC | 207 885 | 3,48 | 1 840 | −12,30 | ||||
| 2025-05-29 | NP | Jnl Series Trust - Jnl/jpmorgan Global Allocation Fund (a) | 14 515 | 0,00 | 152 | 32,46 | ||||
| 2025-06-18 | NP | REMSX - Emerging Markets Fund Class S | 90 383 | 48,38 | 733 | 29,73 | ||||
| 2025-06-30 | NP | VT - Vanguard Total World Stock Index Fund ETF Shares | 108 766 | 30,91 | 882 | 14,40 | ||||
| 2025-08-14 | 13F | Smartleaf Asset Management LLC | 2 759 | 25 | ||||||
| 2025-08-12 | 13F | Charles Schwab Investment Management Inc | 1 180 354 | 16,00 | 10 446 | −1,67 | ||||
| 2025-08-14 | 13F | Bnp Paribas Arbitrage, Sa | 47 918 | −16,54 | 424 | −29,22 | ||||
| 2025-08-13 | 13F | Schroder Investment Management Group | 100 294 | 888 | ||||||
| 2025-08-13 | 13F | Jump Financial, LLC | 36 614 | 324 | ||||||
| 2025-08-13 | 13F | Invesco Ltd. | 74 265 | −9,38 | 657 | −23,16 | ||||
| 2025-06-18 | NP | RTNAX - Tax-Managed International Equity Fund Class A | 263 904 | 97,85 | 2 140 | 73,00 | ||||
| 2025-07-29 | 13F | Straight Path Wealth Management | 0 | −100,00 | 0 | |||||
| 2025-07-25 | 13F | JustInvest LLC | 18 628 | 2,61 | 165 | −13,23 | ||||
| 2025-08-12 | 13F | BlackRock, Inc. | 1 316 556 | −0,89 | 11 652 | −15,99 | ||||
| 2025-08-14 | 13F | Millennium Management Llc | 261 079 | 325,96 | 2 311 | 261,50 | ||||
| 2025-08-14 | 13F | BW Gestao de Investimentos Ltda. | 114 000 | 0,00 | 1 009 | −15,29 | ||||
| 2025-07-31 | 13F | MQS Management LLC | 15 401 | 136 | ||||||
| 2025-08-12 | 13F | Aigen Investment Management, Lp | 13 444 | 119 | ||||||
| 2025-07-30 | NP | APIE - ActivePassive International Equity ETF | 91 498 | 775 | ||||||
| 2025-08-19 | 13F | State of Wyoming | 0 | −100,00 | 0 | |||||
| 2025-08-14 | 13F | Bridgefront Capital, LLC | 18 058 | 160 | ||||||
| 2025-05-14 | 13F | Virtus ETF Advisers LLC | 0 | −100,00 | 0 | |||||
| 2025-08-08 | 13F | JBF Capital, Inc. | 20 000 | 0,00 | 177 | −14,90 | ||||
| 2025-08-08 | 13F | Larson Financial Group LLC | 466 | 27,32 | 4 | 33,33 | ||||
| 2025-07-11 | 13F | Kingstone Capital Partners Texas, LLC | 285 360 | 3 | ||||||
| 2025-05-22 | NP | FTRI - First Trust Indxx Global Natural Resources Income ETF This fund is a listed as child fund of First Trust Advisors Lp and if that institution has disclosed ownership in this security, then these positions will not be double counted when calculating total shares and total value | 400 293 | −28,25 | 4 179 | −5,41 | ||||
| 2025-07-14 | 13F | Ridgewood Investments LLC | 2 479 | 0,00 | 22 | −16,00 | ||||
| 2025-08-14 | 13F | Jane Street Group, Llc | Put | 28 000 | −60,89 | 248 | −66,93 | |||
| 2025-08-14 | 13F | Jane Street Group, Llc | Call | 31 600 | −1,86 | 280 | −16,96 | |||
| 2025-08-14 | 13F | Lazard Asset Management Llc | 256 505 | 39,46 | 2 | 100,00 | ||||
| 2025-08-14 | 13F | Jane Street Group, Llc | 200 125 | 465,34 | 1 771 | 379,95 | ||||
| 2025-08-14 | 13F | Brevan Howard Capital Management LP | 150 000 | 1 330 | ||||||
| 2025-08-06 | 13F | Fox Run Management, L.l.c. | 38 157 | 144,36 | 338 | 106,75 | ||||
| 2025-08-08 | 13F | SBI Securities Co., Ltd. | 221 044 | 1,31 | 1 956 | −14,10 | ||||
| 2025-08-13 | 13F | Arrowstreet Capital, Limited Partnership | 0 | −100,00 | 0 | |||||
| 2025-08-12 | 13F | Rhumbline Advisers | 4 385 | 19,00 | 39 | 0,00 | ||||
| 2025-08-07 | 13F | Allworth Financial LP | 1 432 | −11,99 | 13 | −20,00 | ||||
| 2025-08-13 | 13F | Quadrant Capital Group Llc | 0 | −100,00 | 0 | |||||
| 2025-07-01 | 13F | Confluence Investment Management Llc | 12 947 | −8,04 | 115 | −21,92 | ||||
| 2025-08-12 | 13F | Virtu Financial LLC | 27 935 | 0 | ||||||
| 2025-06-24 | NP | SFENX - Schwab Fundamental Emerging Markets Large Company Index Fund Institutional Shares | 133 853 | 104,63 | 1 086 | 78,75 | ||||
| 2025-08-14 | 13F | Engineers Gate Manager LP | 91 266 | −9,45 | 808 | −23,29 | ||||
| 2025-07-28 | NP | AVEM - Avantis Emerging Markets Equity ETF This fund is a listed as child fund of American Century Companies Inc and if that institution has disclosed ownership in this security, then these positions will not be double counted when calculating total shares and total value | 422 044 | 20,98 | 3 575 | 3,71 | ||||
| 2025-08-14 | 13F | Glenorchy Capital Ltd | 59 391 | 6,04 | 526 | −10,10 | ||||
| 2025-07-18 | 13F | B.O.S.S. Retirement Advisors, LLC | 0 | −100,00 | 0 | |||||
| 2025-06-27 | NP | SDIV - Global X SuperDividend ETF This fund is a listed as child fund of Mirae Asset Global Investments Co., Ltd. and if that institution has disclosed ownership in this security, then these positions will not be double counted when calculating total shares and total value | 773 445 | 3,13 | 6 273 | −9,87 | ||||
| 2025-08-28 | NP | GNR - SPDR(R) S&P(R) Global Natural Resources ETF | 170 004 | 1,73 | 1 505 | −13,76 | ||||
| 2025-08-13 | 13F | Quantbot Technologies LP | 44 580 | −68,09 | 395 | −72,98 | ||||
| 2025-07-29 | NP | WEUSX - Siit World Equity Ex-us Fund - Class A | 215 298 | 1 824 | ||||||
| 2025-07-09 | 13F | St. Louis Financial Planners Asset Management, LLC | 17 508 | −3,89 | 155 | −18,95 | ||||
| 2025-08-12 | 13F | American Century Companies Inc | 448 060 | 22,17 | 3 965 | 3,58 | ||||
| 2025-06-30 | NP | VEU - Vanguard FTSE All-World ex-US Index Fund ETF Shares | 216 425 | 11,27 | 1 755 | −2,72 | ||||
| 2025-07-31 | 13F | Nisa Investment Advisors, Llc | 500 | 0,00 | 4 | −20,00 | ||||
| 2025-08-05 | 13F | Strategic Financial Concepts, LLC | 16 400 | 0,00 | 146 | 0,00 | ||||
| 2025-08-11 | 13F | Anfield Capital Management, LLC | 8 988 | 0,00 | 80 | −15,05 | ||||
| 2025-04-15 | 13F | SG Americas Securities, LLC | 0 | −100,00 | 0 | |||||
| 2025-08-08 | 13F | Creative Planning | 41 975 | −29,19 | 371 | −39,97 | ||||
| 2025-07-25 | 13F | LRI Investments, LLC | 64 | 0,00 | 1 | |||||
| 2025-07-31 | 13F | Brinker Capital Investments, LLC | 0 | −100,00 | 0 | −100,00 | ||||
| 2025-08-14 | 13F | Hilltop Holdings Inc. | 51 186 | 0,13 | 453 | −15,20 | ||||
| 2025-08-11 | 13F | Vanguard Group Inc | 3 206 459 | −0,25 | 28 377 | −15,44 | ||||
| 2025-05-15 | 13F | Qube Research & Technologies Ltd | 0 | −100,00 | 0 | |||||
| 2025-05-15 | 13F | Two Sigma Advisers, Lp | 0 | −100,00 | 0 | |||||
| 2025-03-28 | NP | GAOAX - JPMorgan Global Allocation Fund Class A | 45 289 | 70,59 | 420 | 36,36 | ||||
| 2025-08-15 | 13F | Morgan Stanley | 413 805 | 34,87 | 3 662 | 14,33 | ||||
| 2025-07-30 | NP | ORR - Militia Long/Short Equity ETF | 285 146 | 158,92 | 2 415 | 121,97 | ||||
| 2025-06-23 | NP | UBPIX - Ultralatin America Profund Investor Class | 4 897 | −5,19 | 40 | 0,00 | ||||
| 2025-08-14 | 13F | Wells Fargo & Company/mn | 53 742 | 162,71 | 476 | 123,00 | ||||
| 2025-08-07 | 13F | Parkside Financial Bank & Trust | 136 | 1 | ||||||
| 2025-08-27 | 13F/A | Squarepoint Ops LLC | 21 108 | 26,66 | 187 | 7,51 | ||||
| 2025-07-29 | NP | SEPIX - Energy & Basic Materials Portfolio Energy & Basic Materials Class I | 1 516 | −2,13 | 13 | −20,00 | ||||
| 2025-07-22 | 13F | Sage Investment Counsel LLC | 11 500 | 0,00 | 102 | −15,83 | ||||
| 2025-08-08 | 13F | Pnc Financial Services Group, Inc. | 11 | 0,00 | 0 | |||||
| 2025-07-24 | 13F | IFP Advisors, Inc | 0 | −100,00 | 0 | |||||
| 2025-03-28 | NP | EMRSX - JPMorgan Emerging Markets Research Enhanced Equity Fund Class R6 | 208 881 | −0,41 | 1 938 | 20,00 | ||||
| 2025-08-14 | 13F | Raymond James Financial Inc | 2 648 | 23 | ||||||
| 2025-06-30 | NP | VEIEX - Vanguard Emerging Markets Stock Index Fund Investor Shares | 898 446 | 1,85 | 7 286 | −10,99 | ||||
| 2025-08-14 | 13F | Banco BTG Pactual S.A. | 26 740 | 237 | ||||||
| 2025-08-14 | 13F | Bank Of America Corp /de/ | 257 265 | 14,83 | 2 277 | −2,65 | ||||
| 2025-08-04 | 13F | Hantz Financial Services, Inc. | 28 152 | 1 482,46 | 0 | |||||
| 2025-08-14 | 13F | MIRAE ASSET GLOBAL ETFS HOLDINGS Ltd. | 1 190 268 | 9,42 | 10 534 | −7,25 | ||||
| 2025-08-12 | 13F | Atlas Capital Advisors Llc | 12 417 | 477,00 | 110 | 395,45 | ||||
| 2025-07-24 | 13F | Ronald Blue Trust, Inc. | 1 889 | 120,16 | 17 | 100,00 | ||||
| 2025-08-12 | 13F | SRS Capital Advisors, Inc. | 1 500 | 0,00 | 16 | 6,67 | ||||
| 2025-07-28 | NP | AVXC - Avantis Emerging Markets ex-China Equity ETF | 5 164 | 218,18 | 44 | 168,75 | ||||
| 2025-05-09 | 13F | Headlands Technologies LLC | 0 | −100,00 | 0 | |||||
| 2025-08-14 | 13F | Kerrisdale Advisers, LLC | 67 555 | 0,00 | 598 | −15,32 | ||||
| 2025-08-06 | 13F | Prospera Financial Services Inc | 0 | −100,00 | 0 | −100,00 | ||||
| 2025-08-14 | 13F | Toroso Investments, LLC | 31 670 | −7,00 | 280 | −21,13 | ||||
| 2025-08-13 | 13F | Amundi | 0 | −100,00 | 0 |