Grundläggande statistik
| Institutionella ägare | 101 total, 94 long only, 0 short only, 7 long/short - change of 1,00% MRQ |
| Aktiepris | 58,00 |
| Genomsnittlig portföljallokering | 0.4821 % - change of 65,18% MRQ |
| Institutionella aktier (lång) | 9 281 970 (ex 13D/G) - change of 1,03MM shares 12,51% MRQ |
| Institutionellt värde (lång) | $ 653 415 USD ($1000) |
Institutionellt ägande och aktieägare
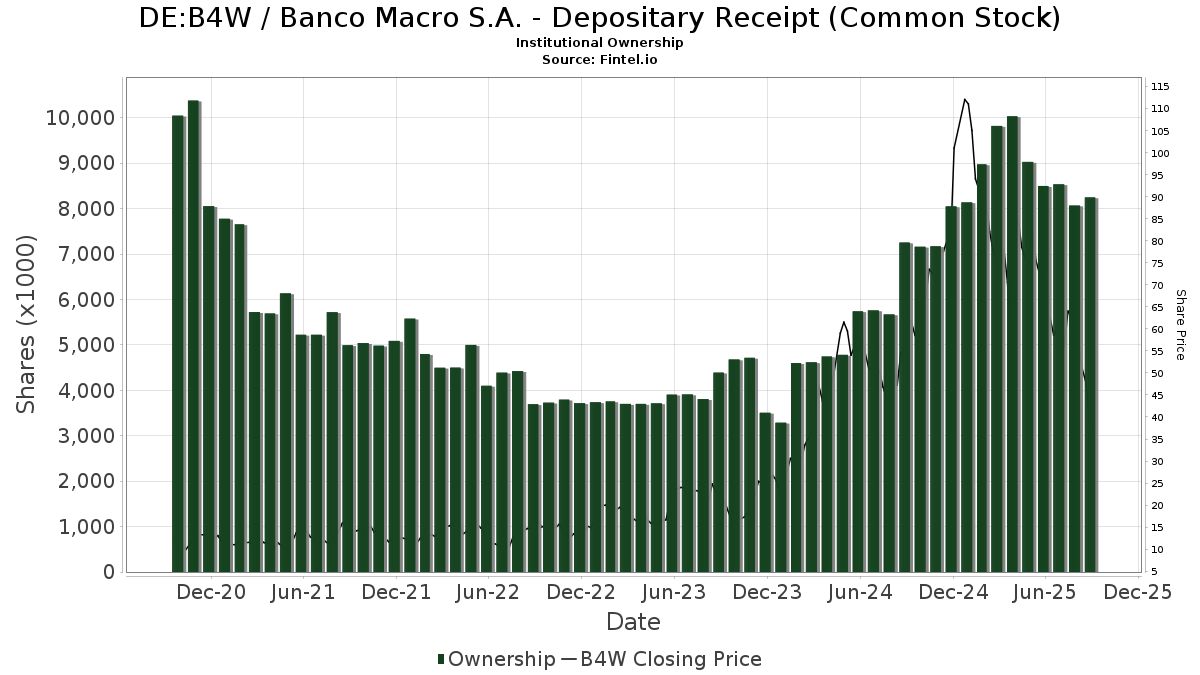
Banco Macro S.A. - Depositary Receipt (Common Stock) (DE:B4W) har 101 Institutionella ägare och aktieägare som har lämnat in 13D/G- eller 13F-formulär till Securities Exchange Commission (SEC). Dessa institut innehar totalt 9,281,970 aktier. Största aktieägare inkluderar AIM INVESTMENT FUNDS (INVESCO INVESTMENT FUNDS) - Invesco Oppenheimer International Bond Fund Class R6, PointState Capital LP, Samlyn Capital, Llc, BlackRock, Inc., Aquamarine Financial (Cayman) Ltd, AIM INVESTMENT FUNDS (INVESCO INVESTMENT FUNDS) - Invesco Oppenheimer Global Strategic Income Fund Class R6, ARGT - Global X MSCI Argentina ETF, Cape Ann Asset Management Ltd, TT International Asset Management LTD, and Morgan Stanley .
Banco Macro S.A. - Depositary Receipt (Common Stock) (DB:B4W) Institutionell ägarstruktur visar institutioners och fonders nuvarande positioner i företaget, samt de senaste förändringarna i positionernas storlek. Större aktieägare kan vara enskilda investerare, fonder, hedgefonder eller institutioner. Bilaga 13D visar att investeraren äger (eller ägde) mer än 5% av företaget och avser (eller avsåg) att aktivt eftersträva en förändring av affärsstrategin. Schedule 13G indikerar en passiv investering på över 5%.
The share price as of March 18, 2026 is 58,00 / share. Previously, on March 24, 2025, the share price was 76,50 / share. This represents a decline of 24,18% over that period.
Fondsentimentets poäng
Fondsentimentet poängen(fka Ägarackumulation-poäng) visar vilka aktier som är mest köpta av fonder. Det är resultatet av en sofistikerad kvantitativ flerfaktormodell som identifierar företag med de högsta nivåerna av institutionell ackumulering. Poängsättningsmodellen använder en kombination av den totala ökningen av redovisade ägare, förändringarna i portföljallokeringarna för dessa ägare och andra mått. Siffran sträcker sig från 0 till 100, där högre siffror indikerar en högre nivå av ackumulering i förhållande till sina konkurrenter, och 50 är genomsnittet.
Uppdateringsfrekvens: Dagligen
Se Ownership Explorer, som innehåller en lista över de högst rankade företagen.
AI+ Ask Fintel’s AI assistant about Banco Macro S.A. - Depositary Receipt (Common Stock).
Select a question to share a public post with an AI-crafted answer.
Thinking of good questions…
13F- och NPORT-arkiveringar
Detaljer om 13F-arkiveringar är gratis. Detaljer om NP-arkiveringar kräver ett premiummedlemskap. Gröna rader indikerar nya positioner. Röda rader indikerar stängda positioner. Klicka på länk symbolen för att se hela transaktionshistoriken.
Uppgradera
för att låsa upp premiumdata och exportera till Excel ![]() .
.
| Fil Datum | Källa | Investerare | Typ | Genomsnittligt pris (beräknat) |
Aktier | Δ Aktier (%) |
Rapporterat värde (1000 USD) |
Δ Värde (%) |
Portföljallokering (%) |
|
|---|---|---|---|---|---|---|---|---|---|---|
| 2026-01-15 | 13F | Scharf Investments, Llc | 0 | −100,00 | 0 | |||||
| 2026-02-17 | 13F | State Of Wisconsin Investment Board | 12 940 | 1 167 | ||||||
| 2025-11-14 | 13F | Duquesne Family Office LLC | 0 | −100,00 | 0 | −100,00 | ||||
| 2026-02-02 | 13F | Ping Capital Management, Inc. | 119 604 | −2,84 | 10 783 | 107,13 | ||||
| 2025-11-14 | 13F | D. E. Shaw & Co., Inc. | Call | 0 | −100,00 | 0 | ||||
| 2025-11-12 | 13F | LPL Financial LLC | 0 | −100,00 | 0 | −100,00 | ||||
| 2026-02-12 | 13F | Lansforsakringar Fondforvaltning AB (publ) | 3 384 | 305 | ||||||
| 2025-11-10 | 13F | Beverly Hills Private Wealth, LLC | 0 | −100,00 | 0 | |||||
| 2026-02-17 | 13F | Bank Of America Corp /de/ | 1 574 | −87,98 | 142 | −74,50 | ||||
| 2026-02-12 | 13F | Marex Group plc | 8 906 | −44,09 | 803 | 19,17 | ||||
| 2026-02-17 | 13F | Advisor Group Holdings, Inc. | 571 | −68,44 | 52 | −46,87 | ||||
| 2026-02-13 | 13F | Mariner, LLC | 2 369 | 214 | ||||||
| 2026-02-17 | 13F | Susquehanna International Group, Llp | 19 752 | −94,06 | 1 781 | −87,34 | ||||
| 2026-02-17 | 13F | Two Sigma Investments, Lp | 0 | −100,00 | 0 | |||||
| 2026-01-30 | 13F | Glenorchy Capital Ltd | 46 101 | −4,31 | 4 157 | 104,03 | ||||
| 2026-02-13 | 13F | Marshall Wace, Llp | 0 | −100,00 | 0 | |||||
| 2026-02-13 | 13F | Van Eck Associates Corp | 3 438 | 103,19 | 0 | |||||
| 2026-02-11 | 13F | Fox Run Management, L.l.c. | 6 696 | 604 | ||||||
| 2025-09-29 | NP | ARGT - Global X MSCI Argentina ETF This fund is a listed as child fund of Mirae Asset Global Investments Co., Ltd. and if that institution has disclosed ownership in this security, then these positions will not be double counted when calculating total shares and total value | 495 353 | −12,66 | 34 625 | −31,03 | ||||
| 2026-02-13 | 13F | Itau Unibanco Holding S.A. | 6 030 | 541 | ||||||
| 2026-02-17 | 13F | Susquehanna International Group, Llp | Put | 384 100 | −30,10 | 34 630 | 49,02 | |||
| 2025-12-09 | 13F/A | Tudor Investment Corp Et Al | Call | 0 | −100,00 | 0 | −100,00 | |||
| 2026-02-17 | 13F | Susquehanna International Group, Llp | Call | 156 300 | 435,27 | 14 092 | 1 041,98 | |||
| 2025-09-25 | NP | VMMSX - Vanguard Emerging Markets Select Stock Fund Investor Shares | 2 275 | −81,95 | 159 | −44,79 | ||||
| 2026-01-30 | 13F | Us Bancorp \de\ | 4 350 | 0,00 | 392 | 114,21 | ||||
| 2025-11-13 | 13F/A | Peak6 Llc | Put | 0 | −100,00 | 0 | ||||
| 2025-11-12 | 13F | Stifel Financial Corp | 0 | −100,00 | 0 | −100,00 | ||||
| 2026-02-17 | 13F | Graham Capital Management, L.P. | 0 | −100,00 | 0 | |||||
| 2025-11-14 | 13F | Northwestern Mutual Wealth Management Co | 0 | −100,00 | 0 | |||||
| 2025-09-29 | NP | AIM INVESTMENT FUNDS (INVESCO INVESTMENT FUNDS) - Invesco Oppenheimer International Bond Fund Class R6 | 950 000 | 0,00 | 6 525 | −23,28 | ||||
| 2026-02-02 | 13F | Advisors Preferred, LLC | 2 770 | −4,61 | 246 | 109,40 | ||||
| 2026-02-19 | 13F | Invesco Ltd. | 10 327 | −0,48 | 931 | 112,56 | ||||
| 2026-02-13 | 13F | Morgan Stanley | 425 316 | 17,81 | 38 346 | 151,19 | ||||
| 2026-02-10 | 13F | Goldman Sachs Group Inc | 164 217 | 19,41 | 14 806 | 154,60 | ||||
| 2026-02-17 | 13F | MIRAE ASSET GLOBAL ETFS HOLDINGS Ltd. | 392 224 | −19,13 | 35 363 | 72,40 | ||||
| 2026-02-09 | 13F | Hantz Financial Services, Inc. | 63 | −87,65 | 0 | |||||
| 2026-02-17 | 13F | Amundi | 9 740 | 878 | ||||||
| 2026-02-13 | 13F | Cape Ann Asset Management Ltd | 465 016 | 0,82 | 41 926 | 114,96 | ||||
| 2026-02-17 | 13F | Millennium Management Llc | 275 421 | −52,12 | 24 832 | 2,08 | ||||
| 2026-02-17 | 13F | Point72 Asset Management, L.P. | 0 | −100,00 | 0 | |||||
| 2026-02-17 | 13F | Tower Research Capital LLC (TRC) | 8 | −88,41 | 1 | −100,00 | ||||
| 2025-11-14 | 13F | Integrated Wealth Concepts LLC | 0 | −100,00 | 0 | −100,00 | ||||
| 2025-11-14 | 13F | Caption Management, LLC | Put | 0 | −100,00 | 0 | −100,00 | |||
| 2026-02-11 | 13F | Capital Wealth Planning, LLC | 116 905 | 10 378 | ||||||
| 2026-02-17 | 13F | Samlyn Capital, Llc | 646 741 | 58 310 | ||||||
| 2025-11-13 | 13F/A | Peak6 Llc | 0 | −100,00 | 0 | |||||
| 2025-11-12 | 13F | Gemsstock Ltd. | 0 | −100,00 | 0 | −100,00 | ||||
| 2025-11-14 | 13F | Jane Street Group, Llc | 0 | −100,00 | 0 | −100,00 | ||||
| 2025-11-14 | 13F | Caption Management, LLC | 0 | −100,00 | 0 | −100,00 | ||||
| 2026-01-15 | 13F | Allspring Global Investments Holdings, LLC | 43 958 | −22,29 | 3 963 | 65,68 | ||||
| 2025-11-10 | 13F | Wrapmanager Inc | 0 | −100,00 | 0 | −100,00 | ||||
| 2025-09-26 | NP | Global Macro Capital Opportunities Portfolio - Global Macro Capital Opportunities Portfolio | 159 490 | 105,12 | 11 148 | 61,99 | ||||
| 2026-01-29 | 13F | UBS Group AG | 85 556 | 59,94 | 7 714 | 240,98 | ||||
| 2025-11-12 | 13F | Erste Asset Management GmbH | 0 | −100,00 | 0 | −100,00 | ||||
| 2026-02-11 | 13F | Group One Trading, L.p. | Call | 34 700 | 2,66 | 3 129 | 118,89 | |||
| 2026-02-17 | 13F | Citadel Advisors Llc | Call | 91 700 | −11,23 | 8 268 | 89,26 | |||
| 2026-02-17 | 13F | Alphadyne Asset Management, LLC | 10 100 | 1,00 | 911 | 115,64 | ||||
| 2026-02-11 | 13F | Group One Trading, L.p. | 26 134 | −67,35 | 2 356 | −30,38 | ||||
| 2026-02-17 | 13F | Citadel Advisors Llc | 28 151 | 2 538 | ||||||
| 2025-11-12 | 13F | Headlands Technologies LLC | 0 | −100,00 | 0 | −100,00 | ||||
| 2026-02-17 | 13F | Citadel Advisors Llc | Put | 80 700 | 27,09 | 7 276 | 170,95 | |||
| 2026-02-13 | 13F | Toroso Investments, LLC | 0 | −100,00 | 0 | |||||
| 2026-02-10 | 13F | Bnp Paribas Arbitrage, Sa | 7 544 | −65,94 | 680 | −27,35 | ||||
| 2026-02-17 | 13F | Aquatic Capital Management LLC | 0 | −100,00 | 0 | |||||
| 2026-01-29 | 13F | Deltec Asset Management Llc | 8 300 | 27,69 | 748 | 172,99 | ||||
| 2025-11-14 | 13F | Walleye Trading LLC | 0 | −100,00 | 0 | −100,00 | ||||
| 2026-02-13 | 13F | Verition Fund Management LLC | 138 760 | 1 060,59 | 12 511 | 2 377,23 | ||||
| 2026-02-13 | 13F | Wells Fargo & Company/mn | 1 865 | −65,14 | 168 | −25,66 | ||||
| 2026-02-17 | 13F | Mirabella Financial Services Llp | 8 389 | 756 | ||||||
| 2026-01-30 | 13F | Sigma Planning Corp | 6 289 | 1,27 | 567 | 116,41 | ||||
| 2026-02-13 | 13F | Candriam Luxembourg S.C.A. | 283 920 | −11,99 | 25 599 | 87,65 | ||||
| 2026-02-03 | 13F | Diversify Wealth Management, Llc | 0 | −100,00 | 0 | |||||
| 2026-02-17 | 13F | Raymond James Financial Inc | 3 359 | 303 | ||||||
| 2026-02-17 | 13F | Advisory Services Network, LLC | 0 | −100,00 | 0 | |||||
| 2025-11-12 | 13F | Ci Investments Inc. | 0 | −100,00 | 0 | −100,00 | ||||
| 2025-10-09 | 13F | Harbour Capital Advisors, LLC | 0 | −100,00 | 0 | −100,00 | ||||
| 2026-01-26 | 13F | JGP Global Gestao de Recursos Ltda. | 3 700 | 334 | ||||||
| 2025-11-07 | 13F | Fiera Capital Corp | 0 | −100,00 | 0 | −100,00 | ||||
| 2025-11-12 | 13F | SPX Equities Gestao de Recursos Ltda | 0 | −100,00 | 0 | |||||
| 2026-01-30 | 13F | Activest Wealth Management | 4 440 | −45,75 | 400 | 15,61 | ||||
| 2026-02-17 | 13F | Royal Bank Of Canada | 550 | −56,07 | 49 | −7,55 | ||||
| 2025-11-14 | 13F | Cetera Investment Advisers | 0 | −100,00 | 0 | |||||
| 2025-10-20 | 13F | Shilanski & Associates, Inc. | 0 | −100,00 | 0 | −100,00 | ||||
| 2025-09-29 | NP | APITX - Yorktown Growth Fund Class L Shares | 0 | −100,00 | 0 | −100,00 | ||||
| 2025-09-26 | NP | UBPIX - Ultralatin America Profund Investor Class | 0 | −100,00 | 0 | −100,00 | ||||
| 2026-01-28 | 13F | Kapitalo Investimentos Ltda | 0 | −100,00 | 0 | |||||
| 2025-11-14 | 13F | Turim 21 Investimentos Ltda. | 0 | −100,00 | 0 | −100,00 | ||||
| 2026-02-12 | 13F | Jane Street Group, Llc | Call | 17 000 | 1 533 | |||||
| 2025-10-29 | 13F | Yorktown Management & Research Co Inc | 0 | −100,00 | 0 | −100,00 | ||||
| 2026-02-12 | 13F | Jane Street Group, Llc | Put | 8 000 | 45,45 | 721 | 210,78 | |||
| 2026-01-28 | 13F | CAPROCK Group, Inc. | 20 000 | 1 803 | ||||||
| 2026-02-12 | 13F | Barometer Capital Management Inc. | 0 | −100,00 | 0 | |||||
| 2026-02-11 | 13F | Group One Trading, L.p. | Put | 42 100 | −49,46 | 3 796 | 7,75 | |||
| 2026-01-27 | 13F | Fundamenta Capital S.A. | 190 000 | 17 130 | ||||||
| 2026-02-17 | 13F | PointState Capital LP | 857 488 | 266,87 | 77 311 | 682,18 | ||||
| 2026-02-13 | 13F | Y-Intercept (Hong Kong) Ltd | 0 | −100,00 | 0 | |||||
| 2026-02-12 | 13F | Banco BTG Pactual S.A. | 47 477 | 58,60 | 4 281 | 238,34 | ||||
| 2025-10-24 | 13F | Bayforest Capital Ltd | 0 | −100,00 | 0 | |||||
| 2026-01-23 | 13F | TT International Asset Management LTD | 456 718 | −38,31 | 41 | −99,87 | ||||
| 2025-11-05 | 13F | AdvisorShares Investments LLC | 0 | −100,00 | 0 | −100,00 | ||||
| 2026-02-17 | 13F | Engineers Gate Manager LP | 0 | −100,00 | 0 | |||||
| 2025-11-06 | 13F | Atria Investments Llc | 0 | −100,00 | 0 | −100,00 | ||||
| 2026-02-17 | 13F | Brevan Howard Capital Management LP | 67 300 | 318,79 | 6 045 | 790,13 | ||||
| 2025-10-24 | 13F | ORG Partners LLC | 0 | −100,00 | 0 | −100,00 | ||||
| 2025-11-14 | 13F | Wolverine Trading, Llc | Put | 0 | −100,00 | 0 | −100,00 | |||
| 2026-03-06 | 13F | Hsbc Holdings Plc | 37 228 | 85,74 | 3 315 | 292,65 | ||||
| 2025-11-14 | 13F/A | Skopos Labs, Inc. | 0 | −100,00 | 0 | −100,00 | ||||
| 2026-02-14 | 13F | Militia Capital Partners, LP | 33 400 | −20,48 | 3 011 | 69,54 | ||||
| 2026-02-13 | 13F | Arrowstreet Capital, Limited Partnership | 78 326 | 7 062 | ||||||
| 2026-02-11 | 13F | Simplex Trading, Llc | Put | 32 100 | −10,08 | 2 894 | 289 300,00 | |||
| 2026-02-10 | 13F | Eurizon Capital SGR S.p.A. | 42 715 | 3 851 | ||||||
| 2026-02-11 | 13F | Simplex Trading, Llc | 13 731 | −60,33 | 1 238 | 123 600,00 | ||||
| 2026-02-11 | 13F | Jpmorgan Chase & Co | 6 431 | −94,36 | 580 | −87,99 | ||||
| 2026-02-06 | 13F | EverSource Wealth Advisors, LLC | 429 | −45,97 | 39 | 15,15 | ||||
| 2026-02-11 | 13F | X-Square Capital, LLC | 11 556 | −83,85 | 1 | −66,67 | ||||
| 2026-02-11 | 13F | Simplex Trading, Llc | Call | 12 500 | 204,88 | 1 127 | ||||
| 2025-09-26 | NP | Global Macro Portfolio - Global Macro Portfolio | 24 000 | 151,23 | 1 678 | 98,46 | ||||
| 2026-02-02 | 13F | Benjamin Edwards Inc | 5 389 | −10,12 | 486 | 92,09 | ||||
| 2026-02-10 | 13F | Titan Global Capital Management Usa Llc | 12 586 | 56,56 | 1 135 | 234,51 | ||||
| 2026-02-12 | 13F | Insigneo Advisory Services, Llc | 4 741 | −54,73 | 427 | −3,39 | ||||
| 2025-11-12 | 13F | TCG Advisory Services, LLC | 0 | −100,00 | 0 | −100,00 | ||||
| 2026-02-17 | 13F | Wellington Management Group Llp | 24 764 | −7,53 | 2 233 | 97,17 | ||||
| 2026-02-13 | 13F | Walleye Trading LLC | Put | 1 500 | 135 | |||||
| 2025-10-24 | 13F | ORG Wealth Partners, LLC | 0 | −100,00 | 0 | −100,00 | ||||
| 2026-01-27 | 13F | TD Waterhouse Canada Inc. | 1 | 0,00 | 0 | |||||
| 2025-09-29 | NP | AIM INVESTMENT FUNDS (INVESCO INVESTMENT FUNDS) - Invesco Oppenheimer Global Strategic Income Fund Class R6 | 530 000 | 0,00 | 3 640 | −23,29 | ||||
| 2026-02-11 | 13F | Compass Rose Asset Management, LP | 71 390 | 6 437 | ||||||
| 2026-01-09 | 13F | Crocodile Capital Partners GmbH | 0 | −100,00 | 0 | |||||
| 2026-02-05 | 13F | Baader Bank INC | 25 000 | 149,18 | 2 254 | 432,86 | ||||
| 2026-02-13 | 13F | Walleye Trading LLC | Call | 2 000 | 180 | |||||
| 2026-02-03 | 13F | Credit Industriel Et Commercial | 355 | 32 | ||||||
| 2026-02-03 | 13F | Credit Industriel Et Commercial | Put | 1 000 | 90 | |||||
| 2026-02-13 | 13F | Laurion Capital Management LP | 3 000 | 270 | ||||||
| 2026-02-17 | 13F | NorthRock Partners, LLC | 6 000 | 0,00 | 541 | 113,44 | ||||
| 2026-02-17 | 13F | GAM Holding AG | 4 292 | −71,44 | 387 | −39,21 | ||||
| 2025-11-14 | 13F | Walleye Capital LLC | 0 | −100,00 | 0 | |||||
| 2025-11-05 | 13F | Envestnet Asset Management Inc | 0 | −100,00 | 0 | |||||
| 2026-02-17 | 13F | Alpine Global Management, LLC | 75 000 | 6 762 | ||||||
| 2026-01-28 | 13F | Aquamarine Financial (Cayman) Ltd | 564 501 | 23,80 | 50 895 | 163,95 | ||||
| 2025-10-21 | 13F | Global Retirement Partners, LLC | 0 | −100,00 | 0 | −100,00 | ||||
| 2026-01-05 | 13F | GAMMA Investing LLC | 271 | −4,24 | 24 | 118,18 | ||||
| 2026-02-12 | 13F | BlackRock, Inc. | 584 763 | −33,17 | 52 722 | 42,48 | ||||
| 2026-02-17 | 13F | Discovery Capital Management, Llc / Ct | 49 000 | 4 418 | ||||||
| 2025-10-23 | 13F | SG Americas Securities, LLC | 0 | −100,00 | 0 | |||||
| 2026-02-13 | 13F | Caitong International Asset Management Co., Ltd | 0 | −100,00 | 0 | |||||
| 2026-02-10 | 13F | Measured Wealth Private Client Group, LLC | 742 | −54,87 | 67 | −4,35 | ||||
| 2026-02-17 | 13F | XTX Topco Ltd | 6 556 | 591 | ||||||
| 2025-11-13 | 13F | Oaktree Capital Management Lp | 0 | −100,00 | 0 | |||||
| 2026-01-08 | 13F | Chesapeake Asset Management Llc | 15 916 | 34,84 | 1 435 | 187,37 | ||||
| 2025-11-17 | 13F | GWM Advisors LLC | 0 | −100,00 | 0 | |||||
| 2026-02-17 | 13F | Voleon Capital Management Lp | 0 | −100,00 | 0 | |||||
| 2025-11-14 | 13F | Rokos Capital Management LLP | 0 | −100,00 | 0 | −100,00 | ||||
| 2026-01-23 | 13F | Deprince Race & Zollo Inc | 42 526 | 3 834 | ||||||
| 2026-02-10 | 13F | CIBC World Markets Inc. | 2 789 | 251 | ||||||
| 2025-09-26 | NP | Global Macro Absolute Return Advantage Portfolio - Global Macro Absolute Return Advantage Portfolio | 84 400 | 124,05 | 5 900 | 76,93 | ||||
| 2025-11-14 | 13F | Cubist Systematic Strategies, LLC | 34 622 | −70,60 | 1 464 | −82,29 | ||||
| 2026-02-11 | 13F | Ramirez Asset Management, Inc. | 56 746 | 5 116 | ||||||
| 2026-02-12 | 13F | Hrt Financial Lp | 2 631 | 0 | ||||||
| 2026-01-23 | 13F | Farther Finance Advisors, LLC | 328 | −8,38 | 30 | 93,33 | ||||
| 2026-02-13 | 13F | Citigroup Inc | 68 592 | 6 184 | ||||||
| 2025-11-14 | 13F | Point72 Asia (Singapore) Pte. Ltd. | 0 | −100,00 | 0 | |||||
| 2026-02-13 | 13F | Atlas Capital Advisors Llc | 1 802 | −62,51 | 162 | −51,93 | ||||
| 2026-02-17 | 13F | Voloridge Investment Management, Llc | 17 600 | −86,71 | 1 587 | −71,67 | ||||
| 2025-11-13 | 13F/A | Peak6 Llc | Call | 0 | −100,00 | 0 | ||||
| 2025-10-20 | 13F | Legal Advantage Investments, Inc. | 0 | −100,00 | 0 | −100,00 | ||||
| 2026-02-17 | 13F | Northern Trust Corp | 2 584 | 233 | ||||||
| 2026-01-16 | 13F | Ronald Blue Trust, Inc. | 490 | 0,00 | 44 | 120,00 | ||||
| 2026-02-17 | 13F | PharVision Advisers, LLC | 2 870 | 259 | ||||||
| 2026-01-30 | 13F | ABS Direct Equity Fund LLC | 16 300 | −46,64 | 1 470 | 13,79 | ||||
| 2025-10-16 | 13F | Burns Matteson Capital Management, LLC | 0 | −100,00 | 0 | −100,00 | ||||
| 2025-11-18 | 13F | Dorsey Wright & Associates | 0 | −100,00 | 0 | −100,00 | ||||
| 2025-11-14 | 13F | Larson Financial Group LLC | 0 | −100,00 | 0 | −100,00 | ||||
| 2025-11-06 | 13F | Ameritas Advisory Services, LLC | 0 | −100,00 | 0 | |||||
| 2026-02-10 | 13F | Monaco Asset Management SAM | 5 900 | −92,87 | 532 | −84,82 | ||||
| 2026-01-23 | 13F | Assetmark, Inc | 11 | 1 | ||||||
| 2026-02-17 | 13F | Balyasny Asset Management Llc | 0 | −100,00 | 0 | |||||
| 2026-02-13 | 13F | Barclays Plc | 5 006 | −71,76 | 451 | −39,79 | ||||
| 2026-01-29 | 13F | Pictet Asset Management Holding SA | 52 408 | −57,43 | 4 725 | −9,24 | ||||
| 2026-02-03 | 13F | SBI Securities Co., Ltd. | 703 | 43,76 | 63 | 215,00 | ||||
| 2026-02-17 | 13F | Qube Research & Technologies Ltd | 0 | −100,00 | 0 | |||||
| 2026-02-10 | 13F | Quantbot Technologies LP | 0 | −100,00 | 0 | |||||
| 2025-11-13 | 13F | Sagil Capital Llp | 0 | −100,00 | 0 | −100,00 |
Other Listings
| US:BMA | 67,69 US$ |