Grundläggande statistik
| Institutionella ägare | 184 total, 174 long only, 6 short only, 4 long/short - change of 6,29% MRQ |
| Genomsnittlig portföljallokering | 0.2734 % - change of 13,71% MRQ |
| Institutionella aktier (lång) | 2 828 299 (ex 13D/G) - change of 0,08MM shares 3,03% MRQ |
| Institutionellt värde (lång) | $ 654 834 USD ($1000) |
Institutionellt ägande och aktieägare
SPDR Series Trust - SPDR NYSE Technology ETF (US:XNTK) har 184 Institutionella ägare och aktieägare som har lämnat in 13D/G- eller 13F-formulär till Securities Exchange Commission (SEC). Dessa institut innehar totalt 2,828,299 aktier. Största aktieägare inkluderar Simplex Trading, Llc, Optiver Holding B.V., Jpmorgan Chase & Co, Auto-Owners Insurance Co, IMC-Chicago, LLC, Group One Trading, L.p., Garda Capital Partners Lp, Jpmorgan Chase & Co, Silverarc Capital Management, Llc, and Maven Securities LTD .
SPDR Series Trust - SPDR NYSE Technology ETF (ARCA:XNTK) Institutionell ägarstruktur visar institutioners och fonders nuvarande positioner i företaget, samt de senaste förändringarna i positionernas storlek. Större aktieägare kan vara enskilda investerare, fonder, hedgefonder eller institutioner. Bilaga 13D visar att investeraren äger (eller ägde) mer än 5% av företaget och avser (eller avsåg) att aktivt eftersträva en förändring av affärsstrategin. Schedule 13G indikerar en passiv investering på över 5%.
The share price as of September 12, 2025 is 257,43 / share. Previously, on September 13, 2024, the share price was 188,19 / share. This represents an increase of 36,80% over that period.

Fondsentimentets poäng
Fondsentimentet poängen(fka Ägarackumulation-poäng) visar vilka aktier som är mest köpta av fonder. Det är resultatet av en sofistikerad kvantitativ flerfaktormodell som identifierar företag med de högsta nivåerna av institutionell ackumulering. Poängsättningsmodellen använder en kombination av den totala ökningen av redovisade ägare, förändringarna i portföljallokeringarna för dessa ägare och andra mått. Siffran sträcker sig från 0 till 100, där högre siffror indikerar en högre nivå av ackumulering i förhållande till sina konkurrenter, och 50 är genomsnittet.
Uppdateringsfrekvens: Dagligen
Se Ownership Explorer, som innehåller en lista över de högst rankade företagen.
Institutionell sälj/köp-kvot
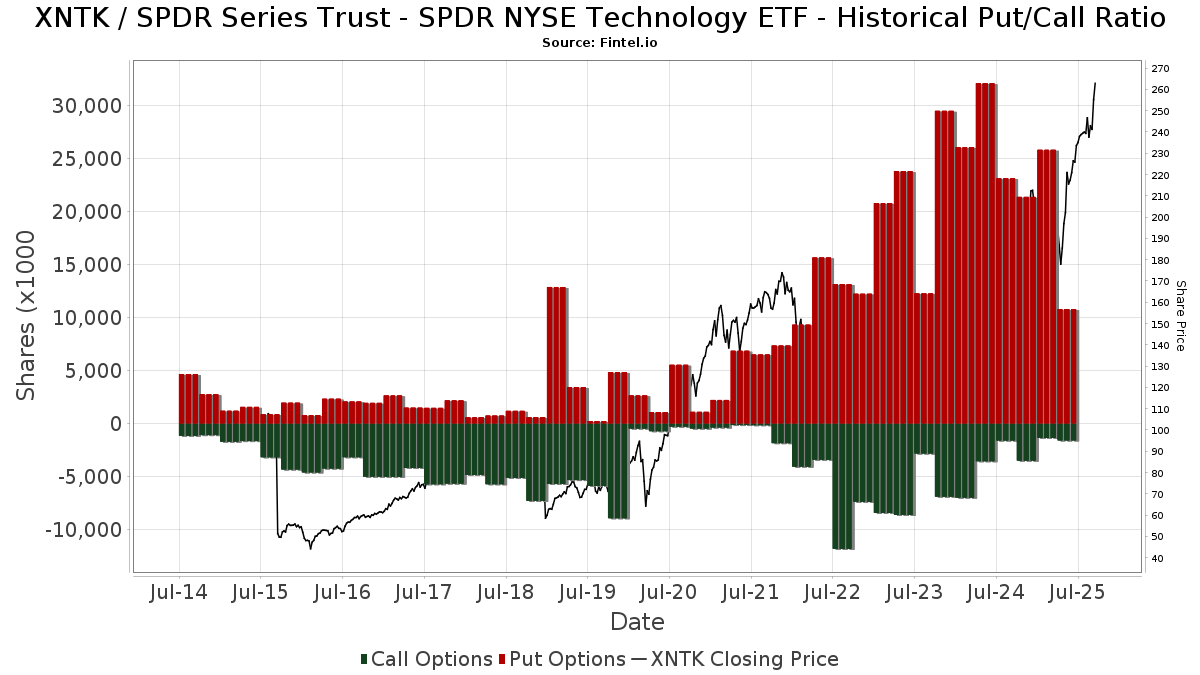
Förutom att rapportera vanliga eget kapital- och skuldemissioner måste institutioner med mer än 100MM tillgångar under förvaltning också avslöja sina innehav av sälj- och köpoptioner. Eftersom säljoptioner i allmänhet indikerar ett negativt sentiment och köpoptioner indikerar ett positivt sentiment, kan vi få en uppfattning om det övergripande institutionella sentimentet genom att plotta förhållandet mellan säljoptioner och köpoptioner. Diagrammet till höger visar det historiska förhållandet mellan sälj- och köpoptioner för detta instrument.
Genom att använda sälj/köp-kvoten som en indikator på aktieägarnas sentiment undviker man en av de största bristerna med att använda det totala institutionella ägandet, nämligen att en betydande del av de förvaltade tillgångarna investeras passivt för att följa index. Passivt förvaltade fonder köper vanligtvis inte optioner, så indikatorn för sälj/köp-kvoten ger en bättre bild av stämningen i aktivt förvaltade fonder.
13F- och NPORT-arkiveringar
Detaljer om 13F-arkiveringar är gratis. Detaljer om NP-arkiveringar kräver ett premiummedlemskap. Gröna rader indikerar nya positioner. Röda rader indikerar stängda positioner. Klicka på länk symbolen för att se hela transaktionshistoriken.
Uppgradera
för att låsa upp premiumdata och exportera till Excel ![]() .
.
| Fil Datum | Källa | Investerare | Typ | Genomsnittligt pris (beräknat) |
Aktier | Δ Aktier (%) |
Rapporterat värde (1000 USD) |
Δ Värde (%) |
Portföljallokering (%) |
|
|---|---|---|---|---|---|---|---|---|---|---|
| 2025-07-18 | 13F | Parsons Capital Management Inc/ri | 14 580 | −5,75 | 3 460 | 16,58 | ||||
| 2025-07-30 | 13F | Cavalier Investments, LLC | 13 110 | −1,04 | 3 111 | 22,39 | ||||
| 2025-04-23 | 13F | Aspetuck Financial Management LLC | 0 | −100,00 | 0 | −100,00 | ||||
| 2025-08-12 | 13F | Eldridge Investment Advisors, Inc. | 3 631 | −2,78 | 862 | 20,25 | ||||
| 2025-05-15 | 13F | Hrt Financial Lp | 0 | −100,00 | 0 | |||||
| 2025-07-28 | 13F | Harbour Investments, Inc. | 172 | 0,00 | 41 | 25,00 | ||||
| 2025-08-07 | 13F | Garda Capital Partners Lp | Put | 224 500 | 75,39 | 12 518 | 84,69 | |||
| 2025-08-14 | 13F | Fund 1 Investments, LLC | Put | 0 | −100,00 | 0 | ||||
| 2025-08-07 | 13F | Apeiron RIA LLC | 1 684 | 0,00 | 400 | 23,53 | ||||
| 2025-07-18 | 13F | Truist Financial Corp | 4 424 | −0,41 | 1 050 | 23,12 | ||||
| 2025-08-12 | 13F | Steward Partners Investment Advisory, Llc | 1 771 | 5,73 | 420 | 30,84 | ||||
| 2025-07-29 | 13F | Ballast, Inc. | 4 009 | 951 | ||||||
| 2025-08-12 | 13F | 17 Capital Partners, Llc | 3 723 | 20,21 | 883 | 48,65 | ||||
| 2025-07-22 | 13F | VAUGHAN & Co SECURITIES, INC. | 1 000 | 237 | ||||||
| 2025-08-14 | 13F | Stifel Financial Corp | 1 349 | 320 | ||||||
| 2025-08-13 | 13F | Bank Of Nova Scotia | 17 178 | 34,13 | 4 077 | 66,03 | ||||
| 2025-08-14 | 13F | Geneva Partners, LLC | 8 302 | 2,19 | 1 970 | 26,44 | ||||
| 2025-07-22 | 13F | IMC-Chicago, LLC | Call | 753 400 | 44,80 | 62 479 | 48,07 | |||
| 2025-07-22 | 13F | IMC-Chicago, LLC | Put | 59 900 | −97,40 | 3 340 | −97,58 | |||
| 2025-08-13 | 13F | Providence Capital Advisors, LLC | 6 | 1 | ||||||
| 2025-07-28 | 13F | Aries Wealth Management | 1 600 | 0,00 | 380 | 23,86 | ||||
| 2025-08-01 | 13F | Biltmore Family Office, LLC | 2 702 | 0,00 | 641 | 23,75 | ||||
| 2025-08-13 | 13F | Green Harvest Asset Management LLC | 1 023 | 243 | ||||||
| 2025-08-14 | 13F | Goldman Sachs Group Inc | 4 199 | 0,00 | 996 | 23,73 | ||||
| 2025-08-12 | 13F | Jpmorgan Chase & Co | 674 | −6,91 | 160 | 15,11 | ||||
| 2025-08-26 | 13F/A | Thrivent Financial For Lutherans | 3 148 | 1 | ||||||
| 2025-08-14 | 13F | Colony Group, LLC | 2 404 | 113,50 | 570 | 165,12 | ||||
| 2025-08-14 | 13F | Smartleaf Asset Management LLC | 20 | 0,00 | 5 | 33,33 | ||||
| 2025-07-29 | 13F | Kraft, Davis & Associates, LLC | 2 950 | −6,76 | 713 | 26,24 | ||||
| 2025-07-18 | 13F | Institute for Wealth Management, LLC. | 5 210 | 0,00 | 1 236 | 23,72 | ||||
| 2025-08-07 | 13F | Allworth Financial LP | 155 | 37 | ||||||
| 2025-07-09 | 13F | Central Valley Advisors, Llc | 1 088 | 0,00 | 258 | 24,04 | ||||
| 2025-08-06 | 13F | Atlantic Union Bankshares Corp | 950 | 225 | ||||||
| 2025-07-22 | 13F | Beacon Financial Advisory LLC | 851 | 202 | ||||||
| 2025-04-21 | 13F | Citizens & Northern Corp | 0 | −100,00 | 0 | |||||
| 2025-08-14 | 13F | Boston Private Wealth Llc | 0 | −100,00 | 0 | |||||
| 2025-05-09 | 13F | GeoWealth Management, LLC | 0 | −100,00 | 0 | |||||
| 2025-08-14 | 13F | Peapack Gladstone Financial Corp | 6 517 | 0,00 | 2 | 0,00 | ||||
| 2025-07-28 | 13F | Acorn Financial Advisory Services Inc /adv | 1 155 | −0,69 | 274 | 22,42 | ||||
| 2025-08-06 | 13F | Kcm Investment Advisors Llc | 4 950 | 0,00 | 1 175 | 23,71 | ||||
| 2025-08-13 | 13F | Keystone Financial Group | 1 970 | 0,00 | 467 | 23,87 | ||||
| 2025-08-14 | 13F | Bnp Paribas Arbitrage, Sa | 0 | −100,00 | 0 | |||||
| 2025-07-21 | 13F | Ameritas Advisory Services, LLC | 68 | 16 | ||||||
| 2025-07-07 | 13F | Thurston, Springer, Miller, Herd & Titak, Inc. | 138 | 1 050,00 | 33 | 1 500,00 | ||||
| 2025-08-04 | 13F | REDW Wealth LLC | 1 277 | 0,00 | 303 | 24,18 | ||||
| 2025-08-14 | 13F | Qube Research & Technologies Ltd | 149 | 351,52 | 35 | 483,33 | ||||
| 2025-08-11 | 13F | Persistent Asset Partners Ltd | Call | 230 | 91 | |||||
| 2025-07-07 | 13F | Wesbanco Bank Inc | 1 021 | 242 | ||||||
| 2025-08-11 | 13F | Western Wealth Management, LLC | 1 143 | 8,14 | 271 | 34,16 | ||||
| 2025-08-14 | 13F | Mariner, LLC | 1 879 | −2,19 | 446 | 20,92 | ||||
| 2025-08-14 | 13F | Ameriprise Financial Inc | 39 182 | 3,58 | 9 295 | 28,61 | ||||
| 2025-08-14 | 13F | GWM Advisors LLC | 160 | 23,08 | 38 | 54,17 | ||||
| 2025-08-04 | 13F | Creative Financial Designs Inc /adv | 307 | 0,33 | 73 | 24,14 | ||||
| 2025-08-13 | 13F | Kayne Anderson Rudnick Investment Management Llc | 1 057 | 0,19 | 250 | 23,76 | ||||
| 2025-08-12 | 13F | CIBC Private Wealth Group, LLC | 0 | −100,00 | 0 | |||||
| 2025-09-04 | 13F/A | Advisor Group Holdings, Inc. | 6 955 | 3,40 | 1 651 | 27,98 | ||||
| 2025-08-14 | 13F | Constant Guidance Financial LLC | 6 723 | −1,10 | 503 | 8,87 | ||||
| 2025-07-23 | 13F | Detalus Advisors, LLC | 975 | 231 | ||||||
| 2025-07-14 | 13F | GAMMA Investing LLC | 2 205 | 0,00 | 523 | 23,93 | ||||
| 2025-08-12 | 13F | Jpmorgan Chase & Co | Call | 200 000 | −0,60 | 16 586 | 1,65 | |||
| 2025-07-30 | 13F/A | KPP Advisory Services LLC | 3 326 | 789 | ||||||
| 2025-08-14 | 13F | Great Valley Advisor Group, Inc. | 2 889 | −0,45 | 686 | 23,20 | ||||
| 2025-05-14 | 13F | Van Hulzen Asset Management, LLC | 0 | −100,00 | 0 | |||||
| 2025-08-13 | 13F | Brown Advisory Inc | 4 168 | 0,00 | 989 | 23,65 | ||||
| 2025-08-07 | 13F | Mayport, Llc | 960 | 228 | ||||||
| 2025-08-11 | 13F | Aptus Capital Advisors, LLC | 219 | 0,00 | 52 | 21,43 | ||||
| 2025-07-16 | 13F | Badgley Phelps Wealth Managers, LLC | 1 130 | 0,00 | 268 | 24,07 | ||||
| 2025-08-15 | 13F | Equitable Holdings, Inc. | 928 | 220 | ||||||
| 2025-08-12 | 13F | Jpmorgan Chase & Co | Put | 2 166 400 | −78,38 | 128 662 | −78,07 | |||
| 2025-07-08 | 13F | Parallel Advisors, LLC | 50 | 0,00 | 12 | 22,22 | ||||
| 2025-08-14 | 13F | Militia Capital Partners, LP | Call | 0 | −100,00 | 0 | −100,00 | |||
| 2025-07-23 | 13F | Country Club Bank /gfn | 15 331 | −0,67 | 3 602 | 21,20 | ||||
| 2025-07-29 | 13F | Stanley-Laman Group, Ltd. | 1 953 | 0,00 | 495 | 22,58 | ||||
| 2025-07-11 | 13F | Farther Finance Advisors, LLC | 80 | 0,00 | 19 | 20,00 | ||||
| 2025-05-15 | 13F | Old Mission Capital Llc | 0 | −100,00 | 0 | −100,00 | ||||
| 2025-08-12 | 13F | Richard W. Paul & Associates, LLC | 551 | 0,00 | 131 | 23,81 | ||||
| 2025-07-16 | 13F/A | CX Institutional | 473 | −32,04 | 0 | |||||
| 2025-08-12 | 13F | Global Retirement Partners, LLC | 105 | 0,00 | 25 | 14,29 | ||||
| 2025-08-07 | 13F | Marathon Trading Investment Management LLC | Put | 100 | 6 | |||||
| 2025-08-19 | 13F | Advisory Services Network, LLC | 1 671 | 0,00 | 395 | 23,44 | ||||
| 2025-07-14 | 13F | Toth Financial Advisory Corp | 0 | −100,00 | 0 | |||||
| 2025-07-28 | 13F | SFG Wealth Management, LLC. | 11 705 | 3,63 | 2 777 | 28,21 | ||||
| 2025-04-30 | 13F | Sofos Investments, Inc. | 146 | 0,00 | 28 | 0,00 | ||||
| 2025-08-14 | 13F | Federation des caisses Desjardins du Quebec | 45 | 0,00 | 11 | 25,00 | ||||
| 2025-07-25 | 13F | Atria Wealth Solutions, Inc. | 0 | −100,00 | 0 | |||||
| 2025-07-24 | 13F | Blair William & Co/il | 2 019 | 0,00 | 479 | 23,77 | ||||
| 2025-08-11 | 13F | Private Advisor Group, LLC | Put | 14 000 | 19 | |||||
| 2025-08-13 | 13F | Jones Financial Companies Lllp | 2 784 | 80,78 | 654 | 120,61 | ||||
| 2025-07-08 | 13F | Zrc Wealth Management, Llc | 73 | 0,00 | 17 | 30,77 | ||||
| 2025-08-05 | 13F | Bank Of Montreal /can/ | 550 | 71,34 | 131 | 113,11 | ||||
| 2025-07-17 | 13F | Chatham Capital Group, Inc. | 1 150 | 0,00 | 273 | 23,64 | ||||
| 2025-05-14 | 13F | Rosalind Advisors, Inc. | Call | 0 | −100,00 | 0 | ||||
| 2025-08-11 | 13F | Private Advisor Group, LLC | 14 962 | −9,36 | 3 550 | 12,13 | ||||
| 2025-08-13 | 13F | Capital Analysts, Inc. | 0 | −100,00 | 0 | |||||
| 2025-08-14 | 13F | Group One Trading, L.p. | Call | 392 500 | 96,25 | 32 550 | 100,68 | |||
| 2025-08-14 | 13F | Group One Trading, L.p. | Put | 23 400 | 17,59 | 1 305 | 23,84 | |||
| 2025-08-07 | 13F | Midwest Trust Co | 2 200 | 522 | ||||||
| 2025-08-04 | 13F | Spire Wealth Management | 409 | 97 | ||||||
| 2025-08-08 | 13F | Capital Investment Advisory Services, LLC | 1 | 0,00 | 0 | |||||
| 2025-08-14 | 13F | Susquehanna International Group, Llp | 8 837 | −48,33 | 2 097 | −36,10 | ||||
| 2025-08-15 | 13F | Oracle Investment Management Inc | Call | 0 | −100,00 | 0 | ||||
| 2025-05-12 | 13F | Sandy Spring Bank | 950 | 0,00 | 182 | −4,71 | ||||
| 2025-07-29 | 13F | Activest Wealth Management | 602 | 0,00 | 143 | 23,48 | ||||
| 2025-08-14 | 13F | Maven Securities LTD | Call | 0 | −100,00 | 0 | −100,00 | |||
| 2025-07-24 | 13F | Aurora Private Wealth, Inc. | 3 594 | 0,00 | 1 | |||||
| 2025-07-25 | 13F | Envestnet Portfolio Solutions, Inc. | 0 | −100,00 | 0 | |||||
| 2025-08-05 | 13F | Prosperity Wealth Management, Inc. | 896 | −24,71 | 213 | −7,02 | ||||
| 2025-08-14 | 13F | Jane Street Group, Llc | 0 | −100,00 | 0 | |||||
| 2025-08-14 | 13F | IHT Wealth Management, LLC | 4 422 | −0,38 | 1 049 | 23,27 | ||||
| 2025-08-14 | 13F | Wiley Bros.-aintree Capital, Llc | 1 169 | 0,00 | 277 | 23,11 | ||||
| 2025-07-28 | 13F | Mutual Advisors, LLC | 7 519 | −0,27 | 1 803 | 22,67 | ||||
| 2025-05-15 | 13F | Ancora Advisors, LLC | 0 | −100,00 | 0 | |||||
| 2025-07-24 | 13F | Us Bancorp \de\ | 217 | 0,00 | 51 | 24,39 | ||||
| 2025-04-25 | 13F | PMC FIG Opportunities LLC | 0 | −100,00 | 0 | |||||
| 2025-08-14 | 13F | Citadel Advisors Llc | 4 411 | 137,28 | 1 047 | 193,82 | ||||
| 2025-08-07 | 13F | Commerce Bank | 1 880 | 0,00 | 446 | 23,89 | ||||
| 2025-08-08 | 13F | WASHINGTON TRUST Co | 1 005 | 0,00 | 238 | 23,96 | ||||
| 2025-08-13 | 13F | Northwestern Mutual Wealth Management Co | 67 124 | −26,92 | 15 927 | −9,59 | ||||
| 2025-07-22 | 13F | Fortitude Advisory Group L.L.C. | 1 742 | 413 | ||||||
| 2025-08-14 | 13F | Royal Bank Of Canada | 16 807 | −14,85 | 3 988 | 5,34 | ||||
| 2025-07-30 | 13F | Syntegra Private Wealth Group, LLC | 1 116 | 0,00 | 265 | 23,36 | ||||
| 2025-07-11 | 13F | Adirondack Trust Co | 255 | 0,00 | 61 | 25,00 | ||||
| 2025-08-06 | 13F | Commonwealth Equity Services, Llc | 9 070 | 8,22 | 2 | 100,00 | ||||
| 2025-08-01 | 13F | Envestnet Asset Management Inc | 9 343 | 2,85 | 2 217 | 27,27 | ||||
| 2025-08-14 | 13F | EP Wealth Advisors, Inc. | 4 646 | −8,29 | 1 102 | 13,49 | ||||
| 2025-07-22 | 13F | IMC-Chicago, LLC | 0 | −100,00 | 0 | −100,00 | ||||
| 2025-08-12 | 13F | O'shaughnessy Asset Management, Llc | 71 | 0,00 | 17 | 23,08 | ||||
| 2025-07-22 | 13F | Private Wealth Group, LLC | 3 874 | 58,97 | 919 | 96,79 | ||||
| 2025-08-05 | 13F | Simplex Trading, Llc | Put | 5 213 800 | −11,24 | 311 | −10,37 | |||
| 2025-08-12 | 13F | Proequities, Inc. | Call | 0 | 0 | |||||
| 2025-08-13 | 13F | New Harbor Financial Group, LLC | 99 932 | 72,73 | 23 712 | 113,69 | ||||
| 2025-08-13 | 13F | Vermillion & White Wealth Management Group, LLC | 34 | 0,00 | 8 | 33,33 | ||||
| 2025-07-07 | 13F | Lwm Advisors Inc | 1 434 | 0,00 | 340 | 16,04 | ||||
| 2025-04-21 | 13F | Nelson, Van Denburg & Campbell Wealth Management Group, LLC | 0 | −100,00 | 0 | |||||
| 2025-07-17 | 13F | Janney Montgomery Scott LLC | 2 754 | 6,79 | 1 | |||||
| 2025-05-13 | 13F | Clear Street Markets Llc | Put | 0 | −100,00 | 0 | ||||
| 2025-07-21 | 13F | CenterStar Asset Management, LLC | Put | 4 000 | −81,13 | 238 | −78,88 | |||
| 2025-08-11 | 13F | HighTower Advisors, LLC | 12 912 | 2,42 | 3 064 | 26,67 | ||||
| 2025-07-08 | 13F | Nbc Securities, Inc. | 53 | 0,00 | 0 | |||||
| 2025-08-14 | 13F | UBS Group AG | 38 880 | 4,68 | 9 225 | 29,49 | ||||
| 2025-08-01 | 13F | Financial Counselors Inc | 0 | −100,00 | 0 | |||||
| 2025-07-23 | 13F | Madden Advisory Services, Inc. | 1 259 | 0,00 | 299 | 23,65 | ||||
| 2025-08-12 | 13F | Proequities, Inc. | Put | 0 | 0 | |||||
| 2025-08-05 | 13F | Huntington National Bank | 24 | 26,32 | ||||||
| 2025-08-14 | 13F | CoreCap Advisors, LLC | 361 | 0,00 | 86 | 23,19 | ||||
| 2025-08-12 | 13F | Quadcap Wealth Management, LLC | 3 990 | 0,35 | 947 | 24,15 | ||||
| 2025-08-08 | 13F | Financial Gravity Companies, Inc. | 146 | 0,00 | 35 | 17,24 | ||||
| 2025-07-28 | 13F | Axxcess Wealth Management, Llc | 3 675 | −1,34 | 872 | 22,13 | ||||
| 2025-07-25 | 13F | Apollon Financial, LLC | 2 600 | 4,42 | 617 | 29,14 | ||||
| 2025-05-12 | 13F | Advisor Group Holdings, Inc. | Call | 0 | −100,00 | 0 | ||||
| 2025-07-28 | 13F | Kiker Wealth Management, LLC | 0 | −100,00 | 0 | |||||
| 2025-08-13 | 13F | SCS Capital Management LLC | 1 000 | 237 | ||||||
| 2025-07-09 | 13F | Westmount Partners, LLC | 1 033 | 245 | ||||||
| 2025-07-18 | 13F | Client 1st Advisory Group, Llc | 1 109 | 0,00 | 263 | 24,06 | ||||
| 2025-08-06 | 13F | RFG - Bristol Wealth Advisors, LLC | 4 243 | 1 007 | ||||||
| 2025-08-12 | 13F | Proequities, Inc. | 0 | 0 | ||||||
| 2025-08-13 | 13F | BCJ Capital Management, LLC | 1 204 | 0,08 | 286 | 23,91 | ||||
| 2025-08-14 | 13F | Pennington Partners & Co., Llc | 1 185 | 0,00 | 281 | 23,79 | ||||
| 2025-08-07 | 13F | Garda Capital Partners Lp | Call | 0 | −100,00 | 0 | −100,00 | |||
| 2025-04-22 | 13F | Bright Futures Wealth Management, LLC. | 1 354 | 0,07 | 235 | −17,25 | ||||
| 2025-07-10 | 13F | Wealth Enhancement Advisory Services, Llc | 1 462 | −0,75 | 347 | 22,70 | ||||
| 2025-07-25 | 13F | Cwm, Llc | 836 | 0,00 | 0 | |||||
| 2025-07-15 | 13F | North Star Investment Management Corp. | 51 | 0,00 | 12 | 33,33 | ||||
| 2025-08-08 | 13F | Cetera Investment Advisers | 3 199 | 72,83 | 759 | 113,80 | ||||
| 2025-05-15 | 13F | Permian Investment Partners, LP | Put | 0 | −100,00 | 0 | ||||
| 2025-08-14 | 13F | McIlrath & Eck, LLC | 425 | 0,00 | 101 | 23,46 | ||||
| 2025-08-12 | 13F | Atlas Capital Advisors Llc | 99 | 0,00 | 24 | 21,05 | ||||
| 2025-08-08 | 13F | Creative Planning | 2 420 | 56,43 | 574 | 93,92 | ||||
| 2025-07-24 | 13F | KC Investment Advisors, LLC | 12 976 | −51,48 | 3 079 | −40,00 | ||||
| 2025-08-07 | 13F | Alpha Cubed Investments, LLC | 1 124 | −7,41 | 267 | 14,66 | ||||
| 2025-08-04 | 13F | Arkadios Wealth Advisors | 3 400 | 7,49 | 807 | 33,00 | ||||
| 2025-08-15 | 13F | CI Private Wealth, LLC | 3 148 | 101,02 | 747 | 149,00 | ||||
| 2025-07-15 | 13F | Fortitude Family Office, LLC | 1 000 | 0,00 | 237 | 24,08 | ||||
| 2025-08-06 | 13F | AE Wealth Management LLC | 0 | −100,00 | 0 | |||||
| 2025-08-12 | 13F | LPL Financial LLC | 185 547 | 19,95 | 44 027 | 48,39 | ||||
| 2025-08-06 | 13F | Savant Capital, LLC | 1 754 | −29,36 | 416 | −12,61 | ||||
| 2025-07-07 | 13F | Good Steward Wealth Advisors,LLC | 1 000 | 237 | ||||||
| 2025-08-14 | 13F | Quantinno Capital Management LP | 1 277 | 303 | ||||||
| 2025-08-14 | 13F | Maven Securities LTD | Put | 198 000 | 83,33 | 13 358 | 107,92 | |||
| 2025-07-23 | 13F | Gentry Private Wealth, Llc | 9 363 | −0,82 | 2 222 | 22,71 | ||||
| 2025-08-13 | 13F | Avestar Capital, LLC | 2 559 | 0,00 | 607 | 23,88 | ||||
| 2025-08-13 | 13F | IAG Wealth Partners, LLC | 155 | 0,00 | 37 | 24,14 | ||||
| 2025-08-12 | 13F | MAI Capital Management | 421 | 0,00 | 100 | 23,75 | ||||
| 2025-08-14 | 13F | Optiver Holding B.V. | Put | 2 927 100 | 1,64 | 173 840 | 6,18 | |||
| 2025-07-14 | 13F | Park Avenue Securities Llc | 0 | −100,00 | 0 | |||||
| 2025-07-22 | 13F | Cedar Mountain Advisors, LLC | 0 | 0 | ||||||
| 2025-07-07 | 13F | Global Wealth Strategies & Associates | 2 000 | 0,00 | 475 | 23,76 | ||||
| 2025-08-13 | 13F | Beacon Pointe Advisors, LLC | 1 820 | 0,00 | 432 | 23,50 | ||||
| 2025-08-18 | 13F | Goodman Advisory Group, LLC | 3 267 | −1,39 | 775 | 22,05 | ||||
| 2025-08-14 | 13F | Bank Of America Corp /de/ | 51 449 | 1,65 | 12 208 | 25,74 | ||||
| 2025-08-08 | 13F | Pnc Financial Services Group, Inc. | 15 142 | 0,00 | 3 593 | 23,69 | ||||
| 2025-03-24 | 13F | Mascagni Wealth Management, Inc. | 461 | 93 | ||||||
| 2025-07-22 | 13F | Gsa Capital Partners Llp | 995 | −58,73 | 0 | |||||
| 2025-08-13 | 13F | Cerity Partners LLC | 5 839 | −3,79 | 1 385 | 18,99 | ||||
| 2025-08-14 | 13F | Comerica Bank | 250 | 0,00 | 59 | 25,53 | ||||
| 2025-08-15 | 13F | Kestra Advisory Services, LLC | 57 581 | −1,47 | 13 663 | 154,89 | ||||
| 2025-07-15 | 13F | Sheets Smith Wealth Management | 1 763 | 0,17 | 418 | 24,04 | ||||
| 2025-05-13 | 13F | Bokf, Na | 0 | −100,00 | 0 | |||||
| 2025-07-28 | NP | RHRX - RH Tactical Rotation ETF | 13 110 | 2 831 | ||||||
| 2025-08-05 | 13F | Tsfg, Llc | 70 | 0,00 | 0 | |||||
| 2025-08-14 | 13F | Raymond James Financial Inc | 8 899 | 17,62 | 2 112 | 45,49 | ||||
| 2025-08-01 | 13F | Auto-Owners Insurance Co | 1 520 500 | 2,66 | 360 784 | 345,02 | ||||
| 2025-08-14 | 13F | Marshall Investment Management, Llc | 0 | −100,00 | 0 | |||||
| 2025-05-12 | 13F | Independent Advisor Alliance | 0 | −100,00 | 0 | |||||
| 2025-08-14 | 13F | Mml Investors Services, Llc | 3 088 | 1,48 | 1 | |||||
| 2025-07-08 | 13F/A | Salem Investment Counselors Inc | 120 | 0,00 | 28 | 21,74 | ||||
| 2025-07-30 | 13F | Phillips Financial Management, Llc | 72 | 22,03 | 17 | 54,55 | ||||
| 2025-08-08 | 13F | Tortoise Investment Management, LLC | 191 | 0,00 | 45 | 25,00 | ||||
| 2025-08-14 | 13F | Wells Fargo & Company/mn | 118 264 | 2,68 | 28 062 | 27,02 | ||||
| 2025-07-02 | 13F | Lvm Capital Management Ltd/mi | 2 799 | 141,71 | 1 | |||||
| 2025-07-17 | 13F | Independence Bank of Kentucky | 915 | 0,00 | 217 | 24,00 | ||||
| 2025-08-12 | 13F | Archer Investment Corp | 73 | 0,00 | 17 | 21,43 | ||||
| 2025-08-13 | 13F | Congress Wealth Management LLC / DE / | 1 364 | 324 | ||||||
| 2025-07-29 | 13F | Stratos Wealth Partners, LTD. | 1 194 | −0,42 | 283 | 23,58 | ||||
| 2025-07-24 | 13F | Strengthening Families & Communities, LLC | 139 | 0,00 | 33 | 26,92 | ||||
| 2025-08-15 | 13F | Morgan Stanley | 129 705 | −14,09 | 30 777 | 6,28 | ||||
| 2025-08-01 | 13F | GoalVest Advisory LLC | 27 156 | −0,48 | 6 444 | 23,12 | ||||
| 2025-07-31 | 13F | Cambridge Investment Research Advisors, Inc. | 27 241 | 101,38 | 6 | 200,00 | ||||
| 2025-08-05 | 13F | Flynn Zito Capital Management, Llc | 1 307 | 0,00 | 310 | 24,00 | ||||
| 2025-08-08 | 13F | Foundations Investment Advisors, LLC | 0 | −100,00 | 0 | |||||
| 2025-08-29 | 13F | Centaurus Financial, Inc. | 1 290 | 0 | ||||||
| 2025-07-29 | 13F | Koshinski Asset Management, Inc. | 7 411 | 0,00 | 1 759 | 23,72 | ||||
| 2025-08-14 | 13F | Fmr Llc | 1 996 | 25,22 | 474 | 55,08 | ||||
| 2025-08-14 | 13F | Silverarc Capital Management, Llc | Call | 200 000 | 16 586 | |||||
| 2025-08-04 | 13F | Joseph P. Lucia & Associates, LLC | 4 009 | 2,06 | 951 | 26,29 | ||||
| 2025-08-07 | 13F | Hughes Financial Services, LLC | 46 | 0,00 | 11 | 37,50 | ||||
| 2025-07-22 | 13F | Coastal Investment Advisors, Inc. | 120 | 0,00 | 28 | 21,74 | ||||
| 2025-07-15 | 13F | Td Private Client Wealth Llc | 300 | 0,00 | 71 | 24,56 | ||||
| 2025-08-15 | 13F | Captrust Financial Advisors | 5 807 | 1,01 | 1 378 | 24,95 |
Other Listings
| MX:XNTK |