Grundläggande statistik
| Institutionella ägare | 116 total, 116 long only, 0 short only, 0 long/short - change of 2,63% MRQ |
| Genomsnittlig portföljallokering | 0.4819 % - change of −8,86% MRQ |
| Institutionella aktier (lång) | 9 346 878 (ex 13D/G) - change of 0,71MM shares 8,25% MRQ |
| Institutionellt värde (lång) | $ 698 387 USD ($1000) |
Institutionellt ägande och aktieägare
Vanguard Scottsdale Funds - Vanguard Total Corporate Bond ETF (US:VTC) har 116 Institutionella ägare och aktieägare som har lämnat in 13D/G- eller 13F-formulär till Securities Exchange Commission (SEC). Dessa institut innehar totalt 9,346,878 aktier. Största aktieägare inkluderar Nepc Llc, Wedmont Private Capital, Mill Creek Capital Advisors, LLC, Capital Asset Advisory Services LLC, Axxcess Wealth Management, Llc, Bank Of America Corp /de/, Morgan Stanley, HCXSX - The U.S. Corporate Fixed Income Securities Portfolio HC Strategic Shares, Mml Investors Services, Llc, and UBS Group AG .
Vanguard Scottsdale Funds - Vanguard Total Corporate Bond ETF (NasdaqGM:VTC) Institutionell ägarstruktur visar institutioners och fonders nuvarande positioner i företaget, samt de senaste förändringarna i positionernas storlek. Större aktieägare kan vara enskilda investerare, fonder, hedgefonder eller institutioner. Bilaga 13D visar att investeraren äger (eller ägde) mer än 5% av företaget och avser (eller avsåg) att aktivt eftersträva en förändring av affärsstrategin. Schedule 13G indikerar en passiv investering på över 5%.
The share price as of September 12, 2025 is 78,65 / share. Previously, on September 16, 2024, the share price was 79,73 / share. This represents a decline of 1,35% over that period.

Fondsentimentets poäng
Fondsentimentet poängen(fka Ägarackumulation-poäng) visar vilka aktier som är mest köpta av fonder. Det är resultatet av en sofistikerad kvantitativ flerfaktormodell som identifierar företag med de högsta nivåerna av institutionell ackumulering. Poängsättningsmodellen använder en kombination av den totala ökningen av redovisade ägare, förändringarna i portföljallokeringarna för dessa ägare och andra mått. Siffran sträcker sig från 0 till 100, där högre siffror indikerar en högre nivå av ackumulering i förhållande till sina konkurrenter, och 50 är genomsnittet.
Uppdateringsfrekvens: Dagligen
Se Ownership Explorer, som innehåller en lista över de högst rankade företagen.
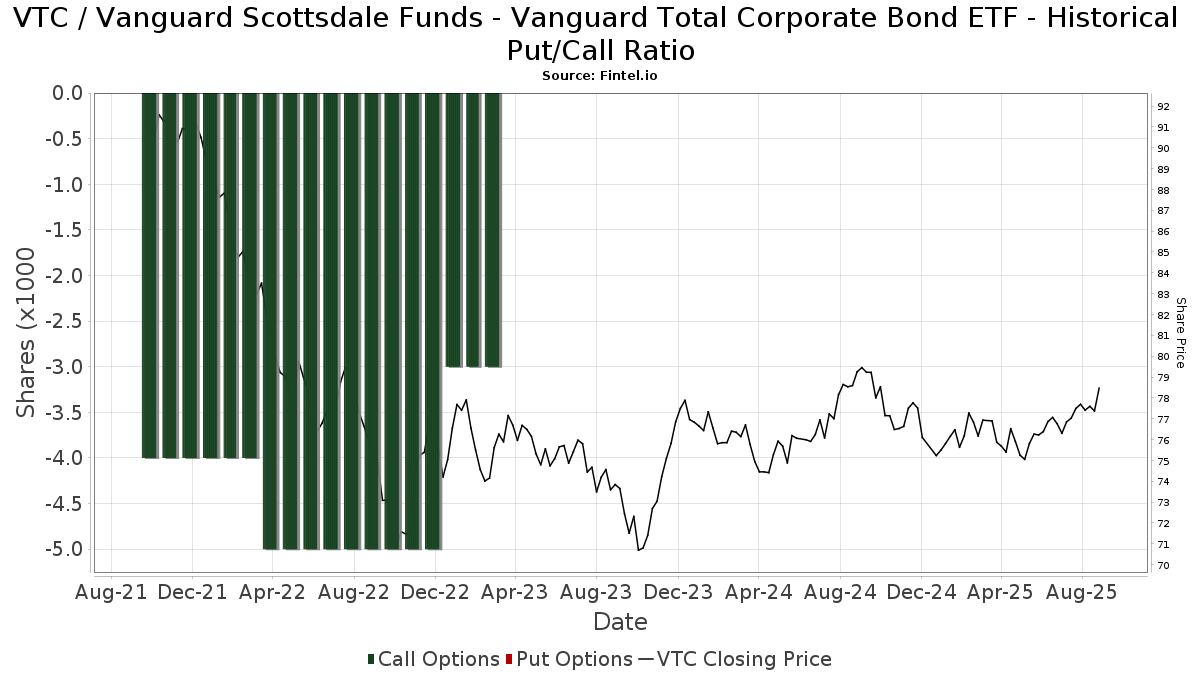
Institutionell sälj/köp-kvot
Förutom att rapportera vanliga eget kapital- och skuldemissioner måste institutioner med mer än 100MM tillgångar under förvaltning också avslöja sina innehav av sälj- och köpoptioner. Eftersom säljoptioner i allmänhet indikerar ett negativt sentiment och köpoptioner indikerar ett positivt sentiment, kan vi få en uppfattning om det övergripande institutionella sentimentet genom att plotta förhållandet mellan säljoptioner och köpoptioner. Diagrammet till höger visar det historiska förhållandet mellan sälj- och köpoptioner för detta instrument.
Genom att använda sälj/köp-kvoten som en indikator på aktieägarnas sentiment undviker man en av de största bristerna med att använda det totala institutionella ägandet, nämligen att en betydande del av de förvaltade tillgångarna investeras passivt för att följa index. Passivt förvaltade fonder köper vanligtvis inte optioner, så indikatorn för sälj/köp-kvoten ger en bättre bild av stämningen i aktivt förvaltade fonder.
13F- och NPORT-arkiveringar
Detaljer om 13F-arkiveringar är gratis. Detaljer om NP-arkiveringar kräver ett premiummedlemskap. Gröna rader indikerar nya positioner. Röda rader indikerar stängda positioner. Klicka på länk symbolen för att se hela transaktionshistoriken.
Uppgradera
för att låsa upp premiumdata och exportera till Excel ![]() .
.
| Fil Datum | Källa | Investerare | Typ | Genomsnittligt pris (beräknat) |
Aktier | Δ Aktier (%) |
Rapporterat värde (1000 USD) |
Δ Värde (%) |
Portföljallokering (%) |
|
|---|---|---|---|---|---|---|---|---|---|---|
| 2025-08-13 | 13F | Flow Traders U.s. Llc | 3 839 | 0 | ||||||
| 2025-08-04 | 13F | Savvy Advisors, Inc. | 9 257 | −1,46 | 716 | −0,83 | ||||
| 2025-07-03 | 13F | Garde Capital, Inc. | 50 | 0,00 | 4 | 0,00 | ||||
| 2025-07-15 | 13F | Bfsg, Llc | 31 297 | 1,21 | 2 420 | 1,94 | ||||
| 2025-08-06 | 13F | OneAscent Wealth Management LLC | 4 679 | 12,39 | 0 | |||||
| 2025-08-14 | 13F | Raymond James Financial Inc | 13 437 | −9,42 | 1 039 | −8,78 | ||||
| 2025-08-07 | 13F | CENTRAL TRUST Co | 233 | 0,00 | 18 | 5,88 | ||||
| 2025-08-15 | 13F | Kestra Advisory Services, LLC | 4 171 | 323 | ||||||
| 2025-07-29 | 13F | Stephens Inc /ar/ | 5 450 | 0,00 | 421 | 0,72 | ||||
| 2025-08-07 | 13F | Kestra Private Wealth Services, Llc | 8 394 | −24,64 | 649 | −24,09 | ||||
| 2025-07-07 | 13F | Capital Asset Advisory Services LLC | 712 370 | 0,83 | 54 902 | 1,07 | ||||
| 2025-09-04 | 13F/A | Advisor Group Holdings, Inc. | 27 546 | 37,91 | 2 131 | 38,92 | ||||
| 2025-08-14 | 13F | Bank Of America Corp /de/ | 499 380 | 4,73 | 38 617 | 5,46 | ||||
| 2025-08-04 | 13F | Bristlecone Advisors, LLC | 0 | −100,00 | 0 | |||||
| 2025-08-13 | 13F | Vermillion & White Wealth Management Group, LLC | 705 | 0,00 | 55 | 0,00 | ||||
| 2025-07-22 | 13F | Warwick Investment Management, Inc. | 4 849 | 375 | ||||||
| 2025-07-11 | 13F | Busey Wealth Management | 3 825 | 0,00 | 296 | 0,68 | ||||
| 2025-07-23 | 13F | Ameliora Wealth Management Ltd. | 200 | 0,00 | 15 | 0,00 | ||||
| 2025-07-24 | 13F | Wealthstar Advisors, Llc | 85 399 | 20,17 | 6 604 | 20,98 | ||||
| 2025-08-07 | 13F | King Luther Capital Management Corp | 812 | −6,45 | ||||||
| 2025-08-12 | 13F | Proequities, Inc. | 0 | 0 | ||||||
| 2025-08-14 | 13F | Integrated Wealth Concepts LLC | 11 834 | −57,15 | 915 | −56,86 | ||||
| 2025-07-30 | 13F | Phillips Financial Management, Llc | 16 | 1 | ||||||
| 2025-08-13 | 13F | Townsquare Capital Llc | 0 | −100,00 | 0 | |||||
| 2025-08-19 | 13F | Advisory Services Network, LLC | 6 745 | 520 | ||||||
| 2025-08-14 | 13F | Wells Fargo & Company/mn | 634 | 49 | ||||||
| 2025-08-15 | 13F | Morgan Stanley | 457 852 | 576,81 | 35 406 | 581,52 | ||||
| 2025-05-05 | 13F | Partners in Financial Planning | 0 | −100,00 | 0 | −100,00 | ||||
| 2025-07-16 | 13F | Perigon Wealth Management, LLC | 35 415 | 0,65 | 2 739 | 1,33 | ||||
| 2025-08-14 | 13F | Susquehanna International Group, Llp | 25 129 | 125,80 | 1 943 | 127,52 | ||||
| 2025-08-11 | 13F | Aptus Capital Advisors, LLC | 0 | −100,00 | 0 | |||||
| 2025-08-12 | 13F | Jpmorgan Chase & Co | 30 220 | −11,56 | 2 337 | −10,98 | ||||
| 2025-07-25 | 13F | Envestnet Portfolio Solutions, Inc. | 0 | −100,00 | 0 | |||||
| 2025-04-11 | 13F | Davis Capital Management | 515 | 0,00 | 40 | 2,63 | ||||
| 2025-05-15 | 13F | Hilltop Holdings Inc. | 0 | −100,00 | 0 | |||||
| 2025-07-09 | 13F | Towerpoint Wealth, LLC | 4 770 | 369 | ||||||
| 2025-08-11 | 13F | TD Waterhouse Canada Inc. | 31 575 | 0,03 | 2 433 | 0,33 | ||||
| 2025-05-13 | 13F | O'shaughnessy Asset Management, Llc | 0 | −100,00 | 0 | |||||
| 2025-07-14 | 13F | Ridgewood Investments LLC | 500 | 0,00 | 39 | 0,00 | ||||
| 2025-07-23 | 13F | Elevate Wealth Advisory, Inc | 185 | 0,00 | 14 | 0,00 | ||||
| 2025-08-14 | 13F | Ameriprise Financial Inc | 21 489 | −1,55 | 1 661 | −0,89 | ||||
| 2025-07-22 | 13F | Valpey Financial Services, LLC | 34 580 | 2 674 | ||||||
| 2025-08-27 | NP | HCXSX - The U.S. Corporate Fixed Income Securities Portfolio HC Strategic Shares | 456 255 | 589,26 | 35 282 | 594,12 | ||||
| 2025-08-08 | 13F | Altfest L J & Co Inc | 4 654 | 2,40 | 360 | 2,87 | ||||
| 2025-08-12 | 13F | Archer Investment Corp | 1 065 | 0,00 | 82 | 1,23 | ||||
| 2025-07-23 | 13F | Proffitt & Goodson Inc | 1 567 | 0,00 | 121 | 0,83 | ||||
| 2025-05-13 | 13F | EverSource Wealth Advisors, LLC | 0 | −100,00 | 0 | |||||
| 2025-05-14 | 13F | Jane Street Group, Llc | 0 | −100,00 | 0 | |||||
| 2025-08-11 | 13F | Mill Creek Capital Advisors, LLC | 830 467 | −11,30 | 64 220 | −10,68 | ||||
| 2025-07-24 | 13F | Drucker Wealth 3.0, LLC | 109 251 | −1,64 | 8 385 | −1,69 | ||||
| 2025-07-29 | 13F | Private Trust Co Na | 175 | 29,63 | 14 | 30,00 | ||||
| 2025-07-18 | 13F | PFG Investments, LLC | 13 546 | 16,72 | 1 048 | 17,51 | ||||
| 2025-07-24 | 13F | Leo Wealth, LLC | 5 415 | 419 | ||||||
| 2025-07-28 | 13F | Harbour Investments, Inc. | 2 352 | 0,00 | 182 | 0,56 | ||||
| 2025-08-05 | 13F | Bank Of Montreal /can/ | 1 430 | 3,17 | 111 | 3,77 | ||||
| 2025-08-08 | 13F | Creative Planning | 7 127 | −5,86 | 551 | −5,16 | ||||
| 2025-08-12 | 13F | MAI Capital Management | 255 | 0,00 | 20 | 0,00 | ||||
| 2025-07-18 | 13F | Consolidated Portfolio Review Corp | 5 766 | 20,55 | 446 | 21,25 | ||||
| 2025-08-08 | 13F | Cetera Investment Advisers | 10 205 | −13,60 | 789 | −13,01 | ||||
| 2025-08-12 | 13F | Change Path, LLC | 33 829 | 41,28 | 2 616 | 42,27 | ||||
| 2025-08-14 | 13F | Fort Point Capital Partners LLC | 22 893 | 7,78 | 1 770 | 8,52 | ||||
| 2025-08-14 | 13F | Mariner, LLC | 12 358 | 3,73 | 956 | 4,49 | ||||
| 2025-08-15 | 13F | Semmax Financial Advisors Inc. | 27 | −70,33 | 2 | −66,67 | ||||
| 2025-05-06 | 13F | Atria Investments Llc | 0 | −100,00 | 0 | |||||
| 2025-07-09 | 13F | Christopher J. Hasenberg, Inc | 1 779 | 138 | ||||||
| 2025-08-14 | 13F | Citadel Advisors Llc | 18 202 | 347,33 | 1 408 | 350,96 | ||||
| 2025-08-12 | 13F | Titleist Asset Management, Llc | 58 212 | −0,23 | 4 502 | 0,47 | ||||
| 2025-08-18 | 13F/A | National Bank Of Canada /fi/ | 20 791 | 2,09 | 1 608 | 2,75 | ||||
| 2025-07-25 | 13F | Atria Wealth Solutions, Inc. | 0 | −100,00 | 0 | |||||
| 2025-07-14 | 13F | Caitlin John, LLC | 2 674 | −13,85 | 207 | −13,45 | ||||
| 2025-04-22 | 13F/A | NorthRock Partners, LLC | 0 | −100,00 | 0 | −100,00 | ||||
| 2025-08-04 | 13F | Creative Financial Designs Inc /adv | 1 170 | 0,00 | 90 | 1,12 | ||||
| 2025-07-28 | 13F | Mutual Advisors, LLC | 4 480 | 1,40 | 345 | 2,08 | ||||
| 2025-07-28 | 13F | Axxcess Wealth Management, Llc | 701 724 | −0,47 | 54 264 | 0,22 | ||||
| 2025-07-21 | 13F | Ameritas Advisory Services, LLC | 796 | 62 | ||||||
| 2025-07-09 | 13F | Breakwater Investment Management | 14 400 | −3,47 | 1 114 | −2,79 | ||||
| 2025-07-10 | 13F | Wedmont Private Capital | 1 002 796 | 0,33 | 76 965 | 3,07 | ||||
| 2025-08-14 | 13F | Qube Research & Technologies Ltd | 35 | 0,00 | 3 | 0,00 | ||||
| 2025-08-08 | 13F | Sensible Financial Planning & Management, LLC. | 143 651 | −5,64 | 11 109 | −4,99 | ||||
| 2025-07-18 | 13F | Truist Financial Corp | 44 937 | 3,44 | 3 475 | 4,14 | ||||
| 2025-07-17 | 13F | Vermillion Wealth Management, Inc. | 1 125 | −36,04 | 87 | −35,56 | ||||
| 2025-07-18 | 13F | Trust Co Of Vermont | 2 095 | 0,00 | 162 | 1,25 | ||||
| 2025-08-06 | 13F | Adviser Investments LLC | 33 872 | −28,50 | 2 619 | −28,01 | ||||
| 2025-04-24 | 13F | Canvas Wealth Advisors, LLC | 0 | −100,00 | 0 | |||||
| 2025-04-28 | 13F | Redmont Wealth Advisors Llc | 745 | 57 | ||||||
| 2025-07-23 | 13F | Seamount Financial Group Inc | 3 932 | −0,08 | 304 | 0,66 | ||||
| 2025-07-22 | 13F | Bay Harbor Wealth Management, LLC | 438 | 0,00 | 34 | 0,00 | ||||
| 2025-08-07 | 13F | Addison Advisors LLC | 1 053 | −50,00 | 81 | −49,69 | ||||
| 2025-08-06 | 13F | AE Wealth Management LLC | 5 298 | −2,98 | 410 | −2,39 | ||||
| 2025-08-14 | 13F | Fmr Llc | 35 | −37,50 | 3 | −50,00 | ||||
| 2025-07-11 | 13F | Pinnacle Bancorp, Inc. | 7 650 | 0,00 | 592 | 0,68 | ||||
| 2025-08-11 | 13F | Citigroup Inc | 200 | 0,00 | 15 | 0,00 | ||||
| 2025-07-11 | 13F | Farther Finance Advisors, LLC | 4 140 | −0,43 | 320 | 0,31 | ||||
| 2025-08-18 | 13F | Geneos Wealth Management Inc. | 200 | 100,00 | 15 | 114,29 | ||||
| 2025-07-24 | 13F | Us Bancorp \de\ | 843 | 0,00 | 65 | 1,56 | ||||
| 2025-08-14 | 13F | Bnp Paribas | 9 307 | −1,89 | 720 | −1,24 | ||||
| 2025-07-28 | 13F | RFG Advisory, LLC | 16 893 | 3,54 | 1 306 | 4,23 | ||||
| 2025-08-12 | 13F | Global Retirement Partners, LLC | 118 | 2,61 | 9 | 12,50 | ||||
| 2025-08-14 | 13F | Financial Engines Advisors L.L.C. | 5 293 | −65,60 | 409 | −65,40 | ||||
| 2025-08-11 | 13F | Pinnacle Financial Group, LLC / IL | 5 538 | 0,00 | 428 | 0,71 | ||||
| 2025-07-31 | 13F | Cambridge Investment Research Advisors, Inc. | 13 282 | −9,02 | 1 | 0,00 | ||||
| 2025-08-06 | 13F | Wedbush Securities Inc | 2 605 | 0,00 | 0 | |||||
| 2025-05-14 | 13F | Van Hulzen Asset Management, LLC | 0 | −100,00 | 0 | −100,00 | ||||
| 2025-07-15 | 13F | Mather Group, Llc. | 0 | −100,00 | 0 | |||||
| 2025-07-29 | 13F | Chicago Partners Investment Group LLC | 19 496 | 0,84 | 1 498 | 2,11 | ||||
| 2025-08-14 | 13F | Two Sigma Securities, Llc | 0 | −100,00 | 0 | |||||
| 2025-08-14 | 13F | Nepc Llc | 2 455 525 | 0,00 | 189 886 | 0,69 | ||||
| 2025-08-12 | 13F | LPL Financial LLC | 140 097 | 35,12 | 10 834 | 36,06 | ||||
| 2025-08-14 | 13F | CoreCap Advisors, LLC | 98 452 | 8,18 | 7 613 | 8,93 | ||||
| 2025-08-08 | 13F | Larson Financial Group LLC | 1 027 | 1,18 | 79 | 2,60 | ||||
| 2025-08-14 | 13F | Betterment LLC | 4 798 | 9,74 | 0 | |||||
| 2025-08-12 | 13F | GDS Wealth Management | 24 134 | −20,56 | 1 866 | −20,02 | ||||
| 2025-08-06 | 13F | Golden State Wealth Management, LLC | 5 013 | 1,21 | 388 | 1,84 | ||||
| 2025-08-15 | 13F | CI Private Wealth, LLC | 75 606 | 5 847 | ||||||
| 2025-07-08 | 13F | Nbc Securities, Inc. | 474 | 0,00 | 0 | |||||
| 2025-07-07 | 13F | Retirement Wealth Solutions LLC | 1 | 0,00 | 0 | |||||
| 2025-08-08 | 13F | Fiera Capital Corp | 5 868 | 0,65 | 454 | 1,34 | ||||
| 2025-08-13 | 13F | Loomis Sayles & Co L P | 68 000 | −28,08 | 5 258 | 75 014,29 | ||||
| 2025-08-14 | 13F | Goldman Sachs Group Inc | 14 680 | 0,00 | 1 135 | 0,71 | ||||
| 2025-04-17 | 13F | Sound Income Strategies, LLC | 0 | −100,00 | 0 | |||||
| 2025-08-14 | 13F | Raine Group LLC | 37 537 | −40,70 | 2 903 | −40,30 | ||||
| 2025-08-12 | 13F | Peachtree Investment Partners, LLC | 3 632 | 0,00 | 281 | 0,72 | ||||
| 2025-07-15 | 13F | Oregon Pacific Wealth Management, LLC | 3 212 | −3,08 | 248 | −2,36 | ||||
| 2025-08-14 | 13F | Stifel Financial Corp | 40 242 | 0,64 | 3 112 | 1,34 | ||||
| 2025-08-11 | 13F | Private Advisor Group, LLC | 15 119 | −2,37 | 1 169 | −1,68 | ||||
| 2025-07-15 | 13F | Axis Wealth Partners, LLC | 7 601 | 13,01 | 588 | 13,76 | ||||
| 2025-08-01 | 13F | Envestnet Asset Management Inc | 49 884 | −3,94 | 3 858 | −3,28 | ||||
| 2025-08-07 | 13F | Winthrop Capital Management, LLC | 1 951 | −3,94 | 0 | |||||
| 2025-08-14 | 13F | UBS Group AG | 148 163 | 6,02 | 11 457 | 6,76 | ||||
| 2025-05-09 | 13F | Ogorek Anthony Joseph /ny/ /adv | 0 | −100,00 | 0 | |||||
| 2025-07-31 | 13F | Topsail Wealth Management, LLC | 14 427 | −0,31 | 1 116 | 0,36 | ||||
| 2025-08-14 | 13F | Mml Investors Services, Llc | 269 456 | 63,61 | 21 | 66,67 | ||||
| 2025-08-06 | 13F | Commonwealth Equity Services, Llc | 3 128 | −6,38 | 0 | |||||
| 2025-08-14 | 13F | Note Advisors, LLC | 9 310 | 0,00 | 720 | 0,56 | ||||
| 2025-08-01 | 13F | First Command Advisory Services, Inc. | 55 | 4 | ||||||
| 2025-08-14 | 13F | Royal Bank Of Canada | 104 504 | 5,59 | 8 082 | 6,34 |
Other Listings
| MX:VTC |