Grundläggande statistik
| Institutionella ägare | 284 total, 283 long only, 0 short only, 1 long/short - change of 0,71% MRQ |
| Genomsnittlig portföljallokering | 0.0659 % - change of 14,53% MRQ |
| Institutionella aktier (lång) | 72 285 655 (ex 13D/G) - change of −5,38MM shares −6,93% MRQ |
| Institutionellt värde (lång) | $ 371 965 USD ($1000) |
Institutionellt ägande och aktieägare
Telefónica, S.A. - Depositary Receipt (Common Stock) (US:TEF) har 284 Institutionella ägare och aktieägare som har lämnat in 13D/G- eller 13F-formulär till Securities Exchange Commission (SEC). Dessa institut innehar totalt 72,285,655 aktier. Största aktieägare inkluderar Morgan Stanley, Goldman Sachs Group Inc, Bank Of America Corp /de/, BlackRock, Inc., Northern Trust Corp, PPYIX - PIMCO RAE International Fund Institutional Class, Royal Bank Of Canada, Fmr Llc, Dimensional Fund Advisors Lp, and American Century Companies Inc .
Telefónica, S.A. - Depositary Receipt (Common Stock) (NYSE:TEF) Institutionell ägarstruktur visar institutioners och fonders nuvarande positioner i företaget, samt de senaste förändringarna i positionernas storlek. Större aktieägare kan vara enskilda investerare, fonder, hedgefonder eller institutioner. Bilaga 13D visar att investeraren äger (eller ägde) mer än 5% av företaget och avser (eller avsåg) att aktivt eftersträva en förändring av affärsstrategin. Schedule 13G indikerar en passiv investering på över 5%.
The share price as of September 11, 2025 is 5,38 / share. Previously, on September 12, 2024, the share price was 4,69 / share. This represents an increase of 14,71% over that period.

Fondsentimentets poäng
Fondsentimentet poängen(fka Ägarackumulation-poäng) visar vilka aktier som är mest köpta av fonder. Det är resultatet av en sofistikerad kvantitativ flerfaktormodell som identifierar företag med de högsta nivåerna av institutionell ackumulering. Poängsättningsmodellen använder en kombination av den totala ökningen av redovisade ägare, förändringarna i portföljallokeringarna för dessa ägare och andra mått. Siffran sträcker sig från 0 till 100, där högre siffror indikerar en högre nivå av ackumulering i förhållande till sina konkurrenter, och 50 är genomsnittet.
Uppdateringsfrekvens: Dagligen
Se Ownership Explorer, som innehåller en lista över de högst rankade företagen.
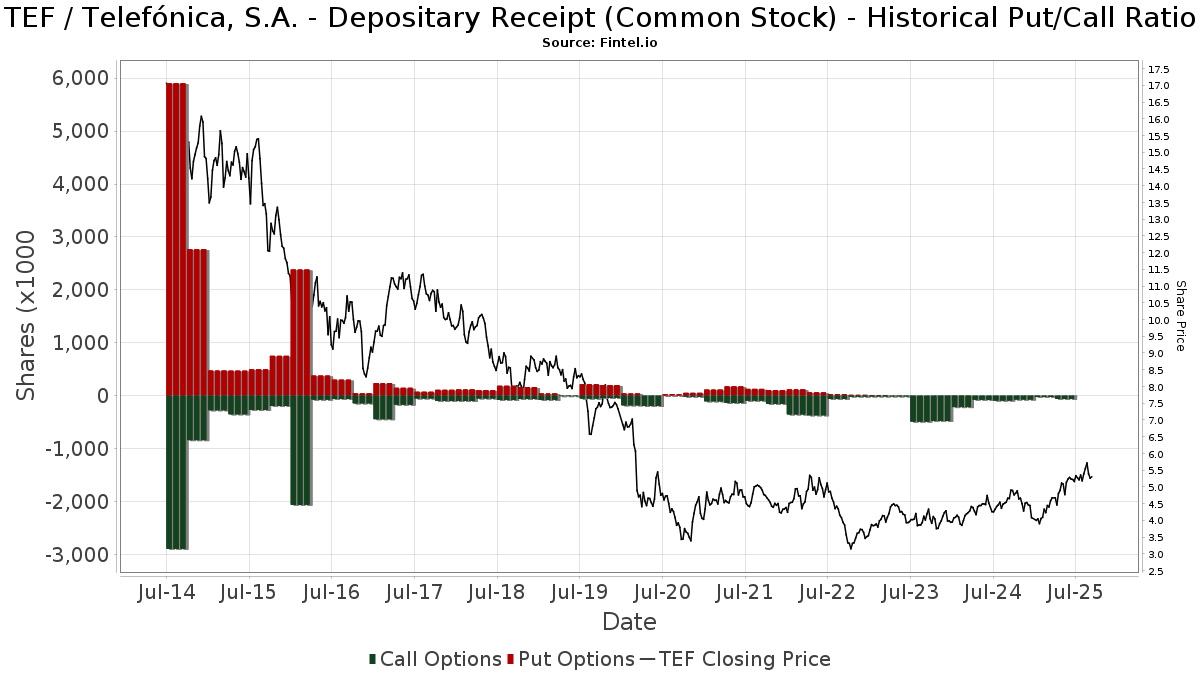
Institutionell sälj/köp-kvot
Förutom att rapportera vanliga eget kapital- och skuldemissioner måste institutioner med mer än 100MM tillgångar under förvaltning också avslöja sina innehav av sälj- och köpoptioner. Eftersom säljoptioner i allmänhet indikerar ett negativt sentiment och köpoptioner indikerar ett positivt sentiment, kan vi få en uppfattning om det övergripande institutionella sentimentet genom att plotta förhållandet mellan säljoptioner och köpoptioner. Diagrammet till höger visar det historiska förhållandet mellan sälj- och köpoptioner för detta instrument.
Genom att använda sälj/köp-kvoten som en indikator på aktieägarnas sentiment undviker man en av de största bristerna med att använda det totala institutionella ägandet, nämligen att en betydande del av de förvaltade tillgångarna investeras passivt för att följa index. Passivt förvaltade fonder köper vanligtvis inte optioner, så indikatorn för sälj/köp-kvoten ger en bättre bild av stämningen i aktivt förvaltade fonder.
13F- och NPORT-arkiveringar
Detaljer om 13F-arkiveringar är gratis. Detaljer om NP-arkiveringar kräver ett premiummedlemskap. Gröna rader indikerar nya positioner. Röda rader indikerar stängda positioner. Klicka på länk symbolen för att se hela transaktionshistoriken.
Uppgradera
för att låsa upp premiumdata och exportera till Excel ![]() .
.
| Fil Datum | Källa | Investerare | Typ | Genomsnittligt pris (beräknat) |
Aktier | Δ Aktier (%) |
Rapporterat värde (1000 USD) |
Δ Värde (%) |
Portföljallokering (%) |
|
|---|---|---|---|---|---|---|---|---|---|---|
| 2025-07-17 | 13F | Sage Rhino Capital Llc | 17 863 | −0,79 | 93 | 12,05 | ||||
| 2025-08-06 | 13F | Moors & Cabot, Inc. | 11 362 | 0,00 | 59 | 13,46 | ||||
| 2025-07-15 | 13F | Financial Management Professionals, Inc. | 1 097 | 6 | ||||||
| 2025-07-29 | 13F | Salomon & Ludwin, LLC | 59 | 0 | ||||||
| 2025-08-14 | 13F | Vident Advisory, LLC | 349 608 | −3,39 | 1 828 | 8,42 | ||||
| 2025-09-04 | 13F/A | Advisor Group Holdings, Inc. | 29 272 | 47,90 | 153 | 66,30 | ||||
| 2025-08-13 | 13F/A | StoneX Group Inc. | 0 | −100,00 | 0 | −100,00 | ||||
| 2025-07-25 | 13F | JustInvest LLC | 182 149 | 46,79 | 953 | 64,71 | ||||
| 2025-08-14 | 13F | Optiver Holding B.V. | 386 683 | −50,99 | 2 022 | −44,99 | ||||
| 2025-08-14 | 13F | Wetherby Asset Management Inc | 184 010 | −10,44 | 962 | 16,61 | ||||
| 2025-05-15 | 13F | CAPROCK Group, Inc. | 34 666 | 5,68 | 162 | 18,38 | ||||
| 2025-08-12 | 13F | Gitterman Wealth Management, LLC | 40 773 | −1,88 | 213 | 10,36 | ||||
| 2025-08-12 | 13F | BlackRock, Inc. | 4 491 806 | −4,12 | 23 492 | 7,61 | ||||
| 2025-08-14 | 13F | Corient IA LLC | 44 000 | 25,71 | 230 | 41,10 | ||||
| 2025-08-14 | 13F | CIBC World Markets Inc. | 750 806 | −3,02 | 3 927 | 8,84 | ||||
| 2025-06-26 | NP | DFAX - Dimensional World ex U.S. Core Equity 2 ETF | 111 179 | 0,00 | 568 | 26,50 | ||||
| 2025-07-22 | 13F | Checchi Capital Advisers, LLC | 31 581 | −13,06 | 165 | −2,37 | ||||
| 2025-05-09 | 13F | Blair William & Co/il | 0 | −100,00 | 0 | |||||
| 2025-05-15 | 13F/A | Orion Portfolio Solutions, LLC | 95 513 | 73,39 | 445 | 101,36 | ||||
| 2025-03-26 | NP | TDVI - FT Vest Technology Dividend Target Income ETF | 17 867 | 67,50 | 72 | 46,94 | ||||
| 2025-07-25 | 13F | Allspring Global Investments Holdings, LLC | 43 652 | −2,60 | 232 | 11,00 | ||||
| 2025-07-15 | 13F | Drum Hill Capital, LLC | 479 971 | −2,52 | 2 510 | 9,42 | ||||
| 2025-08-12 | 13F | Providence Wealth Advisors, LLC | 24 548 | 132 | ||||||
| 2025-08-13 | 13F | Cerity Partners LLC | 453 571 | −0,28 | 2 372 | 11,94 | ||||
| 2025-08-12 | 13F | Pathstone Holdings, LLC | 175 597 | 1,34 | 925 | 14,50 | ||||
| 2025-08-05 | 13F | Bank of New York Mellon Corp | 142 190 | 1,31 | 744 | 13,61 | ||||
| 2025-08-04 | 13F | Assetmark, Inc | 61 705 | 162,44 | 323 | 195,41 | ||||
| 2025-08-11 | 13F | Bell Investment Advisors, Inc | 1 203 | 36,09 | 6 | 50,00 | ||||
| 2025-08-08 | 13F | Larson Financial Group LLC | 1 628 | 121,20 | 9 | 166,67 | ||||
| 2025-08-15 | 13F | Tower Research Capital LLC (TRC) | 17 804 | 110,35 | 93 | 138,46 | ||||
| 2025-04-24 | 13F | Trust Co Of Vermont | 0 | −100,00 | 0 | |||||
| 2025-07-29 | 13F | Koshinski Asset Management, Inc. | 53 027 | 0,05 | 277 | 12,60 | ||||
| 2025-07-10 | 13F | Wedmont Private Capital | 15 810 | −0,11 | 83 | 15,28 | ||||
| 2025-08-08 | 13F | Hartland & Co., LLC | 0 | −100,00 | 0 | |||||
| 2025-08-05 | 13F | Key FInancial Inc | 4 084 | 0,00 | 21 | 10,53 | ||||
| 2025-08-11 | 13F | Avantax Planning Partners, Inc. | 10 563 | −8,65 | 55 | 3,77 | ||||
| 2025-08-14 | 13F | DRW Securities, LLC | 40 966 | 0,00 | 214 | 12,63 | ||||
| 2025-07-16 | 13F/A | CX Institutional | 1 352 | 0,00 | 0 | |||||
| 2025-08-14 | 13F | ICONIQ Capital, LLC | 12 913 | 9,03 | 68 | −34,95 | ||||
| 2025-08-12 | 13F | Horizon Kinetics Asset Management Llc | 367 796 | −5,83 | 1 924 | 5,66 | ||||
| 2025-08-29 | NP | Gabelli Equity Trust Inc | 285 000 | 0,00 | 1 491 | 12,20 | ||||
| 2025-08-29 | NP | Gabelli Multimedia Trust Inc. | 195 000 | 0,00 | 1 020 | 12,22 | ||||
| 2025-08-27 | 13F/A | Brinker Capital Investments, LLC | 104 396 | 9,30 | 546 | 22,47 | ||||
| 2025-08-11 | 13F | TD Waterhouse Canada Inc. | 500 | 0,00 | 3 | 0,00 | ||||
| 2025-08-25 | 13F/A | Neuberger Berman Group LLC | 64 229 | 31,11 | 336 | 46,93 | ||||
| 2025-05-05 | 13F | Lindbrook Capital, Llc | 20 012 | −11,00 | 93 | 3,33 | ||||
| 2025-08-11 | 13F | HighTower Advisors, LLC | 32 184 | −10,11 | 168 | 1,20 | ||||
| 2025-08-14 | 13F | Fmr Llc | 2 288 825 | 12,95 | 11 971 | 26,76 | ||||
| 2025-08-26 | NP | AUXAX - Auxier Focus Fund A Shares | 34 119 | 0,00 | 178 | 12,66 | ||||
| 2025-05-21 | NP | MBEQX - M International Equity Fund | 5 440 | 0,00 | 25 | 19,05 | ||||
| 2025-08-13 | 13F | Northwestern Mutual Wealth Management Co | 57 442 | −7,54 | 300 | 3,81 | ||||
| 2025-07-07 | 13F | Investors Research Corp | 92 986 | 0,00 | 486 | 12,24 | ||||
| 2025-08-29 | NP | SA FUNDS INVESTMENT TRUST - SA International Value Fund | 6 496 | 0,00 | 34 | 10,00 | ||||
| 2025-08-29 | NP | Gabelli Utility Trust | 250 000 | 0,00 | 1 308 | 12,19 | ||||
| 2025-08-14 | 13F | Bnp Paribas Arbitrage, Sa | 13 | 0,00 | 0 | |||||
| 2025-07-16 | 13F | Five Oceans Advisors | 23 057 | 0,00 | 121 | 12,15 | ||||
| 2025-08-14 | 13F | Mml Investors Services, Llc | 52 490 | 13,10 | 0 | |||||
| 2025-07-10 | 13F | Wealth Enhancement Advisory Services, Llc | 28 358 | −10,91 | 150 | 1,35 | ||||
| 2025-08-05 | 13F | Welch & Forbes Llc | 67 720 | 0,00 | 354 | 12,38 | ||||
| 2025-08-14 | 13F | Pingora Partners LLC | 200 | 0,00 | 1 | |||||
| 2025-08-13 | 13F | Centiva Capital, LP | 0 | −100,00 | 0 | |||||
| 2025-08-11 | 13F | GW&K Investment Management, LLC | 452 | 0,00 | 0 | |||||
| 2025-08-11 | 13F | Rothschild Investment Llc | 4 485 | 70,99 | 23 | 91,67 | ||||
| 2025-07-09 | 13F | Aaron Wealth Advisors LLC | 54 230 | −4,20 | 284 | 7,60 | ||||
| 2025-08-08 | 13F | Cetera Investment Advisers | 56 540 | 170,62 | 296 | 204,12 | ||||
| 2025-07-30 | NP | APIE - ActivePassive International Equity ETF | 615 070 | −12,03 | 3 266 | 6,18 | ||||
| 2025-07-25 | 13F | GFS Advisors, LLC | 12 666 | 0,00 | 66 | 11,86 | ||||
| 2025-05-16 | 13F | Coppell Advisory Solutions LLC | 0 | −100,00 | 0 | |||||
| 2025-07-17 | 13F | BayBridge Capital Group, LLC | 27 971 | 0,00 | 146 | 12,31 | ||||
| 2025-07-31 | 13F | Carrera Capital Advisors | 1 007 166 | 5 440 | ||||||
| 2025-08-14 | 13F | Ameriprise Financial Inc | 343 064 | 7,07 | 1 800 | 18,98 | ||||
| 2025-08-11 | 13F | VSM Wealth Advisory, LLC | 13 209 | 0,00 | 69 | 13,11 | ||||
| 2025-08-05 | 13F | GPS Wealth Strategies Group, LLC | 18 | 0,00 | 0 | |||||
| 2025-08-29 | NP | GAUAX - The Gabelli Utilities Fund Class A | 215 000 | 0,00 | 1 124 | 12,29 | ||||
| 2025-03-18 | NP | Bmc Fund Inc | 377 | 0,00 | 2 | 0,00 | ||||
| 2025-08-13 | 13F | EverSource Wealth Advisors, LLC | 20 909 | 108,05 | 109 | 136,96 | ||||
| 2025-07-08 | 13F | Gallacher Capital Management LLC | 105 560 | 4,04 | 552 | 16,95 | ||||
| 2025-06-26 | NP | DFAI - Dimensional International Core Equity Market ETF | 293 622 | 0,00 | 1 500 | 26,48 | ||||
| 2025-08-12 | 13F | Putnam Fl Investment Management Co | 11 181 | 58 | ||||||
| 2025-08-14 | 13F | Peapack Gladstone Financial Corp | 10 320 | 0,00 | 0 | |||||
| 2025-08-14 | 13F | Two Sigma Securities, Llc | 0 | −100,00 | 0 | |||||
| 2025-07-25 | 13F | Sequoia Financial Advisors, LLC | 17 425 | 0,90 | 91 | 13,75 | ||||
| 2025-08-15 | 13F | Captrust Financial Advisors | 28 671 | −21,82 | 150 | −12,35 | ||||
| 2025-08-07 | 13F | CENTRAL TRUST Co | 1 | 0,00 | 0 | |||||
| 2025-08-13 | 13F | Capital Analysts, Inc. | 3 415 | −14,37 | 0 | |||||
| 2025-08-12 | 13F | MAI Capital Management | 4 144 | 1 097,69 | 22 | 2 000,00 | ||||
| 2025-08-13 | 13F | Quadrant Capital Group Llc | 75 339 | −2,37 | 394 | 9,75 | ||||
| 2025-08-12 | 13F | Coldstream Capital Management Inc | 0 | −100,00 | 0 | |||||
| 2025-08-14 | 13F | Royal Bank Of Canada | 2 457 010 | 0,11 | 12 849 | 12,35 | ||||
| 2025-08-06 | 13F | Zevin Asset Management Llc | 53 575 | 0,00 | 0 | |||||
| 2025-07-24 | 13F | Mainstay Capital Management Llc /adv | 780 285 | 99,54 | 4 081 | 123,93 | ||||
| 2025-07-24 | 13F | Us Bancorp \de\ | 157 997 | −3,91 | 826 | 7,83 | ||||
| 2025-08-14 | 13F | Mercer Global Advisors Inc /adv | 82 800 | −8,73 | 433 | 2,61 | ||||
| 2025-05-15 | 13F | Sonoma Private Wealth LLC | 0 | −100,00 | 0 | |||||
| 2025-08-08 | 13F | Avantax Advisory Services, Inc. | 27 141 | 20,08 | 142 | 34,29 | ||||
| 2025-08-05 | 13F | Ellevest, Inc. | 51 092 | −4,94 | 267 | 6,80 | ||||
| 2025-08-11 | 13F | Principal Securities, Inc. | 3 989 | 6,74 | 21 | 33,33 | ||||
| 2025-07-25 | 13F | Concord Wealth Partners | 100 | 0,00 | 1 | |||||
| 2025-08-18 | 13F | Geneos Wealth Management Inc. | 3 057 | −8,17 | 16 | 0,00 | ||||
| 2025-08-29 | NP | Gabelli Global Utility & Income Trust | 80 000 | 0,00 | 418 | 12,37 | ||||
| 2025-07-24 | 13F | PDS Planning, Inc | 12 350 | −1,53 | 65 | 10,34 | ||||
| 2025-07-28 | NP | AVIV - Avantis International Large Cap Value ETF This fund is a listed as child fund of American Century Companies Inc and if that institution has disclosed ownership in this security, then these positions will not be double counted when calculating total shares and total value | 106 980 | −3,26 | 568 | 25,66 | ||||
| 2025-07-24 | 13F | Callan Family Office, LLC | 51 939 | 272 | ||||||
| 2025-07-23 | 13F | Optas, LLC | 15 199 | −26,04 | 79 | −16,84 | ||||
| 2025-08-12 | 13F | Proequities, Inc. | Put | 0 | 0 | |||||
| 2025-08-12 | 13F | Proequities, Inc. | Call | 0 | 0 | |||||
| 2025-08-14 | 13F | Nia Impact Advisors, Llc | 967 830 | −0,90 | 5 062 | 11,21 | ||||
| 2025-08-12 | 13F | Proequities, Inc. | 0 | 0 | ||||||
| 2025-07-17 | 13F | Greenleaf Trust | 83 295 | −1,05 | 436 | 10,97 | ||||
| 2025-05-14 | 13F | SPX Equities Gestao de Recursos Ltda | 0 | −100,00 | 0 | |||||
| 2025-08-14 | 13F | Modern Wealth Management, LLC | 17 808 | −32,22 | 93 | −23,77 | ||||
| 2025-08-04 | 13F | Capital Performance Advisors Llp | 10 700 | 56 | ||||||
| 2025-04-17 | 13F | Trust Point Inc. | 0 | −100,00 | 0 | |||||
| 2025-07-29 | 13F | Private Trust Co Na | 3 192 | 2,60 | 17 | 14,29 | ||||
| 2025-08-14 | 13F | Group One Trading, L.p. | Call | 12 300 | 1 018,18 | 64 | 1 180,00 | |||
| 2025-08-14 | 13F | Group One Trading, L.p. | 3 399 | 18 | ||||||
| 2025-08-13 | 13F | First Trust Advisors Lp | 186 505 | −7,36 | 975 | 3,94 | ||||
| 2025-07-11 | 13F | Seacrest Wealth Management, Llc | 11 169 | 0,00 | 58 | 11,54 | ||||
| 2025-08-08 | 13F | Creative Planning | 146 570 | −1,28 | 767 | 10,85 | ||||
| 2025-07-11 | 13F | Mitchell & Pahl Private Wealth, Llc | 154 853 | 4,78 | 810 | 17,59 | ||||
| 2025-07-31 | 13F | CVA Family Office, LLC | 510 | 0,00 | 3 | 0,00 | ||||
| 2025-08-12 | 13F | LPL Financial LLC | 267 300 | 1,12 | 1 398 | 13,48 | ||||
| 2025-07-16 | 13F | St Germain D J Co Inc | 21 | 0 | ||||||
| 2025-05-08 | 13F | Bank of Jackson Hole Trust | 0 | −100,00 | 0 | |||||
| 2025-08-08 | 13F | Wrapmanager Inc | 10 123 | 53 | ||||||
| 2025-07-28 | 13F | BRYN MAWR TRUST Co | 18 049 | 44,09 | 94 | 62,07 | ||||
| 2025-08-14 | 13F | BTG Pactual Asset Management US LLC | 17 404 | 6,56 | 91 | 19,74 | ||||
| 2025-07-16 | 13F | Highline Wealth Partners Llc | 0 | −100,00 | 0 | |||||
| 2025-08-13 | 13F | Twin Peaks Wealth Advisors, LLC | 1 539 | 8 | ||||||
| 2025-08-14 | 13F | Jain Global LLC | 0 | −100,00 | 0 | |||||
| 2025-05-15 | 13F | Principal Street Partners, LLC | 0 | −100,00 | 0 | |||||
| 2025-07-25 | 13F | Cwm, Llc | 3 354 | 2,38 | 0 | |||||
| 2025-08-05 | 13F | Huntington National Bank | 1 | 0,00 | 0 | |||||
| 2025-08-07 | 13F | Winthrop Capital Management, LLC | 84 445 | 0,00 | 0 | |||||
| 2025-04-21 | 13F | Nelson, Van Denburg & Campbell Wealth Management Group, LLC | 0 | −100,00 | 0 | |||||
| 2025-06-26 | NP | DFIC - Dimensional International Core Equity 2 ETF | 772 357 | 0,00 | 3 947 | 26,47 | ||||
| 2025-08-14 | 13F | Wells Fargo & Company/mn | 109 271 | −1,81 | 571 | 10,23 | ||||
| 2025-08-18 | 13F/A | National Bank Of Canada /fi/ | 1 047 | −71,42 | 5 | −68,75 | ||||
| 2025-08-14 | 13F | Raymond James Financial Inc | 193 892 | −23,83 | 1 014 | −14,50 | ||||
| 2025-07-18 | 13F | BSW Wealth Partners | 15 498 | −14,86 | 81 | −3,57 | ||||
| 2025-07-16 | 13F | Signaturefd, Llc | 79 905 | −1,04 | 418 | 10,90 | ||||
| 2025-08-13 | 13F | Arrowstreet Capital, Limited Partnership | 302 281 | 2 896,44 | 1 581 | 3 261,70 | ||||
| 2025-07-31 | 13F | Cambridge Investment Research Advisors, Inc. | 140 727 | 255,03 | 1 | |||||
| 2025-08-13 | 13F | Rsm Us Wealth Management Llc | 31 287 | 9,96 | 169 | 28,03 | ||||
| 2025-08-06 | 13F | Vestmark Advisory Solutions, Inc. | 83 788 | 438 | ||||||
| 2025-05-14 | 13F | Healthcare Of Ontario Pension Plan Trust Fund | 0 | −100,00 | 0 | |||||
| 2025-08-07 | 13F | HighPoint Advisor Group LLC | 10 531 | 0,45 | 55 | 3,77 | ||||
| 2025-08-13 | 13F | Gamco Investors, Inc. Et Al | 10 000 | 0,00 | 52 | 13,04 | ||||
| 2025-08-14 | 13F | State Street Corp | 10 413 | 0,00 | 56 | 16,67 | ||||
| 2025-08-14 | 13F | Colony Group, LLC | 25 959 | −1,47 | 137 | 12,30 | ||||
| 2025-08-14 | 13F | Cubist Systematic Strategies, LLC | 46 354 | −77,51 | 242 | −74,79 | ||||
| 2025-07-14 | 13F | AdvisorNet Financial, Inc | 500 | 0,00 | 3 | 0,00 | ||||
| 2025-07-31 | 13F | Whipplewood Advisors, LLC | 234 | −8,59 | 1 | 0,00 | ||||
| 2025-07-24 | NP | FWRLX - Wireless Portfolio This fund is a listed as child fund of Fmr Llc and if that institution has disclosed ownership in this security, then these positions will not be double counted when calculating total shares and total value | 731 849 | 0,00 | 3 886 | 20,68 | ||||
| 2025-08-29 | NP | MFDX - PIMCO RAFI Dynamic Multi-Factor International Equity ETF | 276 743 | −0,34 | 1 457 | 11,31 | ||||
| 2025-08-14 | 13F | UBS Group AG | 138 148 | 267,87 | 723 | 314,94 | ||||
| 2025-07-24 | 13F | Ronald Blue Trust, Inc. | 16 552 | −19,05 | 87 | −9,47 | ||||
| 2025-06-26 | NP | DFA INVESTMENT DIMENSIONS GROUP INC - World ex U.S. Core Equity Portfolio Institutional Class Shares | 31 697 | 0,00 | 162 | 25,78 | ||||
| 2025-07-25 | 13F | Yousif Capital Management, Llc | 93 346 | 5,83 | 488 | 18,73 | ||||
| 2025-08-15 | 13F | CI Private Wealth, LLC | 86 231 | 65,25 | 451 | 85,19 | ||||
| 2025-07-25 | 13F | Concurrent Investment Advisors, LLC | 19 543 | −44,55 | 102 | −37,80 | ||||
| 2025-08-14 | 13F | Bank Of America Corp /de/ | 5 166 876 | −33,22 | 27 023 | −25,05 | ||||
| 2025-08-08 | 13F | Crossmark Global Holdings, Inc. | 398 378 | −0,03 | 2 084 | 12,17 | ||||
| 2025-08-06 | 13F | Valued Wealth Advisors LLC | 1 558 | 0,00 | 8 | 14,29 | ||||
| 2025-08-11 | 13F | Citigroup Inc | 14 784 | 1,71 | 77 | 14,93 | ||||
| 2025-08-07 | 13F | Sierra Ocean, Llc | 1 924 | 0,00 | 10 | 25,00 | ||||
| 2025-08-13 | 13F | BCJ Capital Management, LLC | 16 909 | 88 | ||||||
| 2025-08-14 | 13F | American Trust Investment Advisors, LLC | 75 984 | 0,00 | 397 | 12,15 | ||||
| 2025-08-14 | 13F | Mariner, LLC | 559 940 | 26,21 | 2 928 | 41,65 | ||||
| 2025-07-28 | 13F | Naviter Wealth, LLC | 83 094 | 207,76 | 440 | 252,00 | ||||
| 2025-08-14 | 13F | Syon Capital Llc | 46 669 | −1,67 | 244 | 10,41 | ||||
| 2025-08-15 | 13F | Morgan Stanley | 16 929 665 | −17,68 | 88 542 | −7,61 | ||||
| 2025-08-07 | 13F | Allworth Financial LP | 2 447 | 173,41 | 13 | 200,00 | ||||
| 2025-07-28 | NP | AVSD - Avantis Responsible International Equity ETF | 39 408 | 0,00 | 209 | 20,81 | ||||
| 2025-08-12 | 13F | Manchester Capital Management LLC | 3 083 | 7,20 | 16 | 23,08 | ||||
| 2025-08-05 | 13F | NewSquare Capital LLC | 1 123 | 317,47 | 6 | 400,00 | ||||
| 2025-07-18 | 13F | Truist Financial Corp | 14 945 | 26,11 | 78 | 41,82 | ||||
| 2025-08-12 | 13F | Rhumbline Advisers | 93 374 | −6,86 | 488 | 4,50 | ||||
| 2025-07-11 | 13F | Perpetual Ltd | 10 393 | 0,00 | 54 | 12,50 | ||||
| 2025-07-15 | 13F | Cordant, Inc. | 2 | 0,00 | 0 | |||||
| 2025-08-14 | 13F | Millennium Management Llc | 336 269 | −33,27 | 1 759 | −25,13 | ||||
| 2025-08-08 | 13F | Pnc Financial Services Group, Inc. | 38 632 | −2,73 | 202 | 9,19 | ||||
| 2025-07-21 | 13F | Ascent Group, LLC | 37 547 | 19,06 | 196 | 34,25 | ||||
| 2025-04-11 | 13F | CBOE Vest Financial, LLC | 0 | −100,00 | 0 | −100,00 | ||||
| 2025-08-12 | 13F | Dimensional Fund Advisors Lp | 1 856 381 | −1,52 | 9 708 | 10,52 | ||||
| 2025-08-14 | 13F | Susquehanna International Group, Llp | Call | 19 500 | 9,55 | 102 | 23,17 | |||
| 2025-08-13 | 13F | WCG Wealth Advisors LLC | 47 394 | 5,88 | 248 | 18,75 | ||||
| 2025-08-14 | 13F | Susquehanna International Group, Llp | 19 588 | −32,41 | 102 | −24,44 | ||||
| 2025-04-30 | 13F | Silverlake Wealth Management Llc | 0 | −100,00 | 0 | |||||
| 2025-08-13 | 13F | Guggenheim Capital Llc | 176 439 | 16,79 | 923 | 31,15 | ||||
| 2025-05-14 | 13F | Van Hulzen Asset Management, LLC | 0 | −100,00 | 0 | |||||
| 2025-03-26 | NP | DFA INVESTMENT DIMENSIONS GROUP INC - International Social Core Equity Portfolio Institutional Class This fund is a listed as child fund of Dimensional Fund Advisors Lp and if that institution has disclosed ownership in this security, then these positions will not be double counted when calculating total shares and total value | 3 907 | 0,00 | 16 | −16,67 | ||||
| 2025-08-14 | 13F | Optiver Holding B.V. | Call | 0 | −100,00 | 0 | −100,00 | |||
| 2025-07-15 | 13F | Ballentine Partners, LLC | 112 145 | 0,01 | 587 | 12,26 | ||||
| 2025-07-16 | 13F | Traveka Wealth, LLC | 14 545 | −2,56 | 76 | 10,14 | ||||
| 2025-08-12 | 13F | Franklin Resources Inc | 80 228 | 15,02 | 420 | 28,92 | ||||
| 2025-08-14 | 13F | GWM Advisors LLC | 1 237 | −90,72 | 6 | −90,32 | ||||
| 2025-08-04 | 13F | Atria Investments Llc | 53 738 | −50,62 | 281 | −80,61 | ||||
| 2025-08-14 | 13F | Decatur Capital Management, Inc. | 16 650 | 0,00 | 87 | 12,99 | ||||
| 2025-08-14 | 13F | Williams Jones Wealth Management, LLC. | 11 377 | 0,00 | 60 | 11,32 | ||||
| 2025-07-31 | 13F | R Squared Ltd | 37 139 | −14,07 | 194 | −3,48 | ||||
| 2025-08-01 | 13F | May Hill Capital, LLC | 0 | −100,00 | 0 | |||||
| 2025-07-28 | NP | AVDE - Avantis International Equity ETF This fund is a listed as child fund of American Century Companies Inc and if that institution has disclosed ownership in this security, then these positions will not be double counted when calculating total shares and total value | 1 464 729 | 9,16 | 7 778 | 31,75 | ||||
| 2025-08-14 | 13F | Point72 Asset Management, L.P. | 354 500 | −39,00 | 1 854 | −31,51 | ||||
| 2025-08-11 | 13F | United Capital Financial Advisers, Llc | 37 717 | 13,52 | 197 | 27,92 | ||||
| 2025-07-11 | 13F/A | Umb Bank N A/mo | 1 020 | −11,61 | 5 | 0,00 | ||||
| 2025-08-06 | 13F | True Wealth Design, LLC | 80 | −4,76 | 0 | |||||
| 2025-05-15 | 13F | Glenmede Trust Co Na | 29 277 | −9,76 | 136 | 4,62 | ||||
| 2025-07-28 | 13F | Harbour Investments, Inc. | 552 | −71,10 | 3 | −75,00 | ||||
| 2025-08-14 | 13F | Goldman Sachs Group Inc | 6 442 570 | 3,19 | 33 695 | 15,81 | ||||
| 2025-05-05 | 13F | Creekmur Asset Management LLC | 0 | −100,00 | 0 | |||||
| 2025-08-01 | 13F | Bessemer Group Inc | 0 | −100,00 | 0 | |||||
| 2025-08-05 | 13F | Bank Of Montreal /can/ | 634 738 | −0,73 | 3 320 | 11,41 | ||||
| 2025-07-22 | 13F | Merit Financial Group, LLC | 15 794 | 83 | ||||||
| 2025-08-29 | NP | GATAX - The Gabelli Asset Fund Class A | 269 000 | 0,00 | 1 407 | 12,21 | ||||
| 2025-07-24 | 13F | Jfs Wealth Advisors, Llc | 2 482 | 0,00 | 13 | 9,09 | ||||
| 2025-08-13 | 13F | Townsquare Capital Llc | 0 | −100,00 | 0 | |||||
| 2025-08-19 | 13F | Cape Investment Advisory, Inc. | 1 579 | 10,19 | 8 | 33,33 | ||||
| 2025-08-11 | 13F | Cornerstone Planning Group LLC | 703 | 32,64 | 4 | 50,00 | ||||
| 2025-08-12 | 13F | Steward Partners Investment Advisory, Llc | 1 649 | 0,00 | 9 | 14,29 | ||||
| 2025-07-25 | 13F | Natural Investments, Llc | 34 961 | 47,77 | 0 | |||||
| 2025-08-14 | 13F | Smartleaf Asset Management LLC | 26 600 | 31,87 | 138 | 48,39 | ||||
| 2025-08-13 | 13F | Sanibel Captiva Trust Company, Inc. | 13 875 | 0,00 | 73 | 12,50 | ||||
| 2025-08-29 | NP | GCAEX - The Gabelli Equity Income Fund Class A | 70 000 | 0,00 | 366 | 12,27 | ||||
| 2025-08-14 | 13F | Point72 Asia (Singapore) Pte. Ltd. | 0 | −100,00 | 0 | |||||
| 2025-08-14 | 13F | Stifel Financial Corp | 477 376 | −0,02 | 2 497 | 12,18 | ||||
| 2025-07-23 | 13F | Richardson Capital Management LLC | 155 | 0,00 | 1 | |||||
| 2025-07-11 | 13F | Farther Finance Advisors, LLC | 548 | 27,44 | 3 | 0,00 | ||||
| 2025-07-15 | 13F | Fifth Third Bancorp | 246 | 1 | ||||||
| 2025-07-21 | 13F | Cromwell Holdings LLC | 6 670 | −33,51 | 36 | −21,74 | ||||
| 2025-08-07 | 13F | Prospect Financial Group LLC | 12 918 | −0,01 | 68 | 11,67 | ||||
| 2025-08-12 | 13F | Charles Schwab Investment Management Inc | 356 146 | 16,41 | 1 863 | 30,67 | ||||
| 2025-06-26 | NP | DFIEX - International Core Equity Portfolio - Institutional Class This fund is a listed as child fund of Dimensional Fund Advisors Lp and if that institution has disclosed ownership in this security, then these positions will not be double counted when calculating total shares and total value | 70 329 | −68,08 | 359 | −59,66 | ||||
| 2025-04-29 | 13F | Callan Capital, LLC | 44 485 | 44,65 | 207 | 68,29 | ||||
| 2025-08-15 | 13F | Auxier Asset Management | 157 394 | −0,22 | 823 | 11,97 | ||||
| 2025-08-13 | 13F | Northern Trust Corp | 3 853 451 | 5,91 | 20 154 | 18,87 | ||||
| 2025-07-22 | 13F | Clarius Group, LLC | 11 812 | 0,00 | 62 | 10,91 | ||||
| 2025-08-14 | 13F | Old Mission Capital Llc | 0 | −100,00 | 0 | −100,00 | ||||
| 2025-07-28 | NP | AVDEX - Avantis International Equity Fund Institutional Class This fund is a listed as child fund of American Century Companies Inc and if that institution has disclosed ownership in this security, then these positions will not be double counted when calculating total shares and total value | 72 637 | 0,00 | 386 | 20,69 | ||||
| 2025-07-07 | 13F | Northwest & Ethical Investments L.P. | 0 | −100,00 | 0 | −100,00 | ||||
| 2025-06-26 | NP | DFSI - Dimensional International Sustainability Core 1 ETF | 42 037 | 0,00 | 215 | 26,63 | ||||
| 2025-06-26 | NP | SNTKX - Steward International Enhanced Index Fund Class A | 169 980 | 0,00 | 869 | 26,53 | ||||
| 2025-07-31 | 13F | 180 Wealth Advisors, Llc | 28 704 | −2,11 | 150 | 10,29 | ||||
| 2025-07-28 | 13F | Mutual Advisors, LLC | 38 645 | 0,00 | 208 | 8,33 | ||||
| 2025-08-12 | 13F | AlphaCore Capital LLC | 10 533 | 47 | ||||||
| 2025-08-14 | 13F | Federation des caisses Desjardins du Quebec | 15 245 | 0,00 | 80 | 11,27 | ||||
| 2025-08-29 | NP | PPYIX - PIMCO RAE International Fund Institutional Class | 2 624 870 | 10,78 | 13 815 | 23,70 | ||||
| 2025-07-14 | 13F | UMA Financial Services, Inc. | 1 254 | −14,93 | 7 | 0,00 | ||||
| 2025-08-14 | 13F | Hamilton Capital, LLC | 12 249 | −1,38 | 64 | 12,28 | ||||
| 2025-08-14 | 13F | Hrt Financial Lp | 0 | −100,00 | 0 | |||||
| 2025-08-12 | 13F | Clear Street Markets Llc | 0 | −100,00 | 0 | |||||
| 2025-07-08 | 13F | Parallel Advisors, LLC | 37 949 | −1,52 | 198 | 10,61 | ||||
| 2025-08-06 | 13F | Commonwealth Equity Services, Llc | 16 376 | 13,32 | 0 | |||||
| 2025-08-13 | 13F | Jones Financial Companies Lllp | 573 | 1 748,39 | 3 | |||||
| 2025-04-29 | 13F | Financial Counselors Inc | 0 | −100,00 | 0 | |||||
| 2025-08-14 | 13F | Evergreen Capital Management Llc | 25 747 | 0,00 | 139 | 16,81 | ||||
| 2025-08-01 | 13F | Envestnet Asset Management Inc | 58 641 | 23,84 | 307 | 39,09 | ||||
| 2025-08-11 | 13F | Dorsey & Whitney Trust CO LLC | 18 489 | −37,07 | 97 | −29,41 | ||||
| 2025-07-08 | 13F | Atwood & Palmer Inc | 8 465 | 44 | ||||||
| 2025-07-30 | 13F | Drive Wealth Management, Llc | 28 995 | 18,05 | 157 | 36,84 | ||||
| 2025-08-14 | 13F/A | Barclays Plc | 88 710 | −92,00 | 0 | −100,00 | ||||
| 2025-08-12 | 13F | CIBC Private Wealth Group, LLC | 2 092 | 0,00 | 11 | 11,11 | ||||
| 2025-08-13 | 13F | GABELLI & Co INVESTMENT ADVISERS, INC. | 66 000 | 0,00 | 345 | 12,38 | ||||
| 2025-08-13 | 13F | Russell Investments Group, Ltd. | 76 512 | 46,95 | 400 | 65,29 | ||||
| 2025-07-21 | 13F | Qrg Capital Management, Inc. | 202 018 | −1,88 | 1 057 | 10,11 | ||||
| 2025-08-14 | 13F | Verition Fund Management LLC | 14 142 | 74 | ||||||
| 2025-08-14 | 13F | Atomi Financial Group, Inc. | 48 037 | 64,16 | 251 | 84,56 | ||||
| 2025-08-11 | 13F | Brown Brothers Harriman & Co | 355 | 2 | ||||||
| 2025-07-09 | 13F | Bruce G. Allen Investments, LLC | 1 936 | −6,16 | 10 | 11,11 | ||||
| 2025-08-12 | 13F | Jpmorgan Chase & Co | 177 023 | 76,68 | 926 | 98,50 | ||||
| 2025-07-30 | 13F | Blume Capital Management, Inc. | 29 | 0 | ||||||
| 2025-08-19 | 13F/A | Pitcairn Co | 10 551 | −27,47 | 55 | −17,91 | ||||
| 2025-08-13 | 13F | Natixis Advisors, L.p. | 497 772 | 35,55 | 3 | 100,00 | ||||
| 2025-07-29 | 13F | Activest Wealth Management | 5 314 | 0,00 | 28 | 12,50 | ||||
| 2025-08-14 | 13F | Glenmede Investment Management, LP | 26 307 | 138 | ||||||
| 2025-08-05 | 13F | Dunhill Financial, LLC | 668 | 3 | ||||||
| 2025-07-25 | 13F | We Are One Seven, LLC | 46 501 | 162,39 | 243 | 196,34 | ||||
| 2025-08-14 | 13F | Aquatic Capital Management LLC | 64 449 | −44,42 | 337 | −37,59 | ||||
| 2025-07-29 | 13F | Private Wealth Management Group, LLC | 181 | 0,00 | 1 | |||||
| 2025-08-13 | 13F | Momentous Wealth Management, Inc. | 0 | −100,00 | 0 | |||||
| 2025-07-28 | 13F | Private Wealth Asset Management, LLC | 183 | 0,00 | 1 | |||||
| 2025-08-06 | 13F | Savant Capital, LLC | 81 790 | 143,74 | 428 | 173,72 | ||||
| 2025-08-12 | 13F | American Century Companies Inc | 1 752 600 | 17,82 | 9 166 | 32,25 | ||||
| 2025-07-15 | 13F | North Star Investment Management Corp. | 3 | 0,00 | 0 | |||||
| 2025-08-12 | 13F | Global Retirement Partners, LLC | 785 | 61,86 | 4 | 300,00 | ||||
| 2025-08-06 | 13F | Wsfs Capital Management, Llc | 19 209 | 0,00 | 100 | 12,36 | ||||
| 2025-08-06 | 13F | Thompson Siegel & Walmsley Llc | 10 393 | 0,00 | 0 | |||||
| 2025-08-07 | 13F | Parkside Financial Bank & Trust | 787 | 14,56 | 4 | 33,33 | ||||
| 2025-08-14 | 13F | Qube Research & Technologies Ltd | 0 | −100,00 | 0 | |||||
| 2025-04-21 | 13F | Catalina Capital Group, LLC | 0 | −100,00 | 0 | |||||
| 2025-08-04 | 13F | Hantz Financial Services, Inc. | 16 819 | 1 746,21 | 0 | |||||
| 2025-08-05 | 13F | Simplex Trading, Llc | Call | 4 900 | 4 800,00 | 0 | ||||
| 2025-08-12 | 13F | O'shaughnessy Asset Management, Llc | 199 384 | 14,24 | 1 043 | 28,17 | ||||
| 2025-07-14 | 13F | GAMMA Investing LLC | 26 305 | 68,73 | 138 | 90,28 | ||||
| 2025-08-13 | 13F | Bare Financial Services, Inc | 137 | 1 | ||||||
| 2025-08-05 | 13F | Simplex Trading, Llc | Put | 100 | 0 | |||||
| 2025-08-14 | 13F | Principia Wealth Advisory, LLC | 73 | 0 | ||||||
| 2025-08-05 | 13F | Simplex Trading, Llc | 10 446 | −76,71 | 0 | |||||
| 2025-07-24 | 13F | IFP Advisors, Inc | 1 115 | 0,00 | 6 | 0,00 | ||||
| 2025-08-14 | 13F | Ieq Capital, Llc | 24 108 | 56,48 | 126 | 77,46 | ||||
| 2025-08-15 | 13F | WealthCollab, LLC | 1 787 | 0,00 | 9 | 12,50 | ||||
| 2025-07-09 | 13F | Sunpointe, LLC | 12 718 | −0,09 | 69 | 15,25 | ||||
| 2025-07-21 | 13F | Credential Qtrade Securities Inc. | 0 | −100,00 | 0 | −100,00 | ||||
| 2025-08-29 | NP | Gabelli Dividend & Income Trust | 100 000 | 0,00 | 523 | 12,23 | ||||
| 2025-04-11 | 13F | First Affirmative Financial Network | 147 559 | 23,05 | 688 | 42,53 | ||||
| 2025-08-07 | 13F | Zions Bancorporation, National Association /ut/ | 1 225 | −6,56 | 6 | 0,00 | ||||
| 2025-06-26 | NP | DFALX - Large Cap International Portfolio - Institutional Class This fund is a listed as child fund of Dimensional Fund Advisors Lp and if that institution has disclosed ownership in this security, then these positions will not be double counted when calculating total shares and total value | 163 106 | 0,00 | 833 | 26,60 | ||||
| 2025-08-13 | 13F | Quadrature Capital Ltd | 24 438 | 128 | ||||||
| 2025-07-25 | 13F | Stephens Consulting, LLC | 73 | 0 | ||||||
| 2025-08-13 | 13F | GeoWealth Management, LLC | 0 | −100,00 | 0 | |||||
| 2025-08-12 | 13F | SRS Capital Advisors, Inc. | 317 | 0,00 | 5 | 300,00 | ||||
| 2025-05-12 | 13F | Virtu Financial LLC | 0 | −100,00 | 0 | |||||
| 2025-06-26 | NP | DFA INVESTMENT DIMENSIONS GROUP INC - International Vector Equity Portfolio Shares | 22 622 | 0,00 | 116 | 26,37 | ||||
| 2025-08-06 | 13F | First Horizon Advisors, Inc. | 0 | −100,00 | 0 | |||||
| 2025-08-13 | 13F | Gabelli Funds Llc | 1 464 000 | 0,00 | 7 657 | 12,23 | ||||
| 2025-07-14 | 13F | Park Avenue Securities Llc | 12 772 | −13,91 | 0 | |||||
| 2025-07-30 | 13F | Forum Financial Management, LP | 34 039 | 9,05 | 178 | 22,76 | ||||
| 2025-07-28 | 13F | Ritholtz Wealth Management | 10 995 | 2,89 | 58 | 16,33 | ||||
| 2025-08-14 | 13F | Jane Street Group, Llc | 54 167 | −81,51 | 283 | −79,27 | ||||
| 2025-08-18 | 13F | Pacific Center for Financial Services | 2 278 | 0,00 | 12 | 10,00 | ||||
| 2025-07-15 | 13F | Td Private Client Wealth Llc | 0 | −100,00 | 0 | |||||
| 2025-08-14 | 13F/A | Skopos Labs, Inc. | 21 077 | 10,15 | 110 | 23,60 | ||||
| 2025-07-29 | NP | NIAGX - Nia Impact Solutions Fund | 344 932 | −2,43 | 1 832 | 17,75 | ||||
| 2025-08-14 | 13F | Aqr Capital Management Llc | 236 165 | 99,22 | 1 235 | 123,73 | ||||
| 2025-08-19 | 13F | National Asset Management, Inc. | 0 | −100,00 | 0 | |||||
| 2025-08-14 | 13F | Citadel Advisors Llc | 45 681 | −73,38 | 239 | −70,21 | ||||
| 2025-08-13 | 13F | Summit Financial, LLC | 19 211 | 0,00 | 104 | 15,73 | ||||
| 2025-04-22 | 13F | Mendota Financial Group, LLC | 0 | −100,00 | 0 | |||||
| 2025-08-14 | 13F | Citadel Advisors Llc | Put | 0 | −100,00 | 0 | −100,00 | |||
| 2025-08-14 | 13F | Citadel Advisors Llc | Call | 19 400 | 1 112,50 | 101 | 1 342,86 | |||
| 2025-08-19 | 13F | Newbridge Financial Services Group, Inc. | 2 580 | 0,00 | 13 | 8,33 | ||||
| 2025-06-26 | NP | DFIV - Dimensional International Value ETF | 8 118 | −71,29 | 41 | −64,04 | ||||
| 2025-07-24 | 13F | Lester Murray Antman dba SimplyRich | 99 707 | −9,99 | 1 | |||||
| 2025-07-30 | 13F | Ethic Inc. | 424 983 | 5,68 | 2 206 | 16,67 |