Grundläggande statistik
| Institutionella ägare | 112 total, 108 long only, 0 short only, 4 long/short - change of 0,00% MRQ |
| Genomsnittlig portföljallokering | 0.0202 % - change of −21,07% MRQ |
| Institutionella aktier (lång) | 17 382 945 (ex 13D/G) - change of 1,08MM shares 6,61% MRQ |
| Institutionellt värde (lång) | $ 75 419 USD ($1000) |
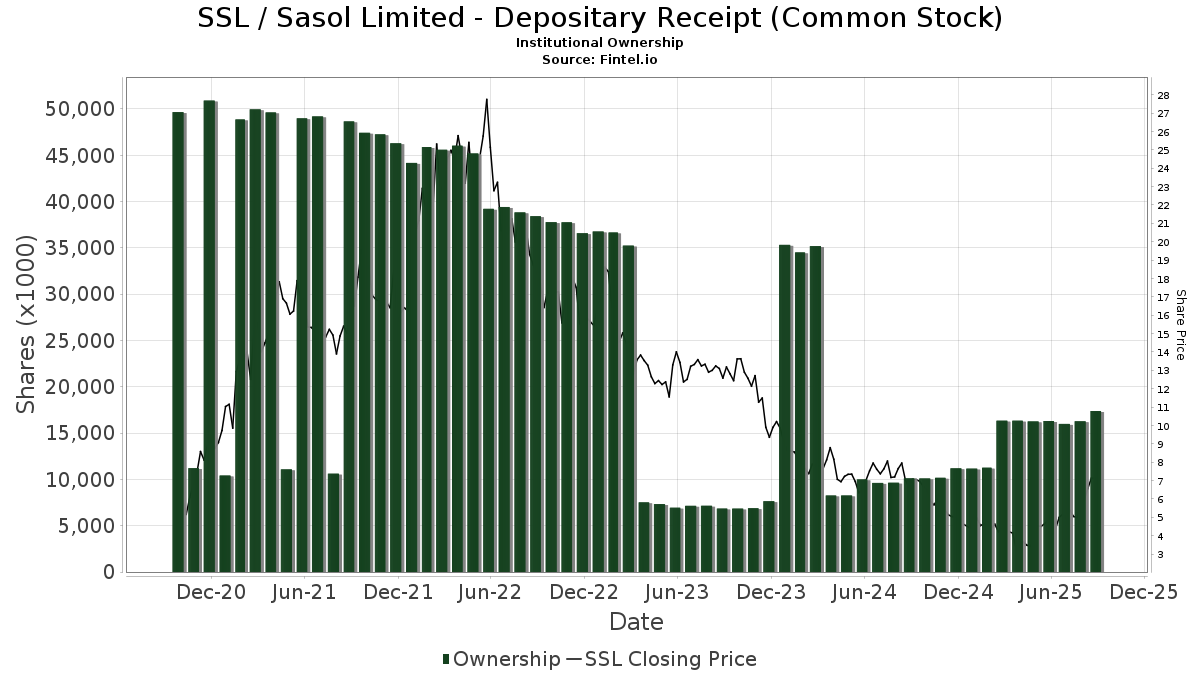
Institutionellt ägande och aktieägare
Sasol Limited - Depositary Receipt (Common Stock) (US:SSL) har 112 Institutionella ägare och aktieägare som har lämnat in 13D/G- eller 13F-formulär till Securities Exchange Commission (SEC). Dessa institut innehar totalt 17,382,945 aktier. Största aktieägare inkluderar Morgan Stanley, BlackRock, Inc., Two Sigma Investments, Lp, Two Sigma Advisers, Lp, American Century Companies Inc, Goldman Sachs Group Inc, Connor, Clark & Lunn Investment Management Ltd., AVEM - Avantis Emerging Markets Equity ETF, Dimensional Fund Advisors Lp, and UBS Group AG .
Sasol Limited - Depositary Receipt (Common Stock) (NYSE:SSL) Institutionell ägarstruktur visar institutioners och fonders nuvarande positioner i företaget, samt de senaste förändringarna i positionernas storlek. Större aktieägare kan vara enskilda investerare, fonder, hedgefonder eller institutioner. Bilaga 13D visar att investeraren äger (eller ägde) mer än 5% av företaget och avser (eller avsåg) att aktivt eftersträva en förändring av affärsstrategin. Schedule 13G indikerar en passiv investering på över 5%.
The share price as of September 9, 2025 is 6,88 / share. Previously, on September 9, 2024, the share price was 7,00 / share. This represents a decline of 1,64% over that period.
Fondsentimentets poäng
Fondsentimentet poängen(fka Ägarackumulation-poäng) visar vilka aktier som är mest köpta av fonder. Det är resultatet av en sofistikerad kvantitativ flerfaktormodell som identifierar företag med de högsta nivåerna av institutionell ackumulering. Poängsättningsmodellen använder en kombination av den totala ökningen av redovisade ägare, förändringarna i portföljallokeringarna för dessa ägare och andra mått. Siffran sträcker sig från 0 till 100, där högre siffror indikerar en högre nivå av ackumulering i förhållande till sina konkurrenter, och 50 är genomsnittet.
Uppdateringsfrekvens: Dagligen
Se Ownership Explorer, som innehåller en lista över de högst rankade företagen.
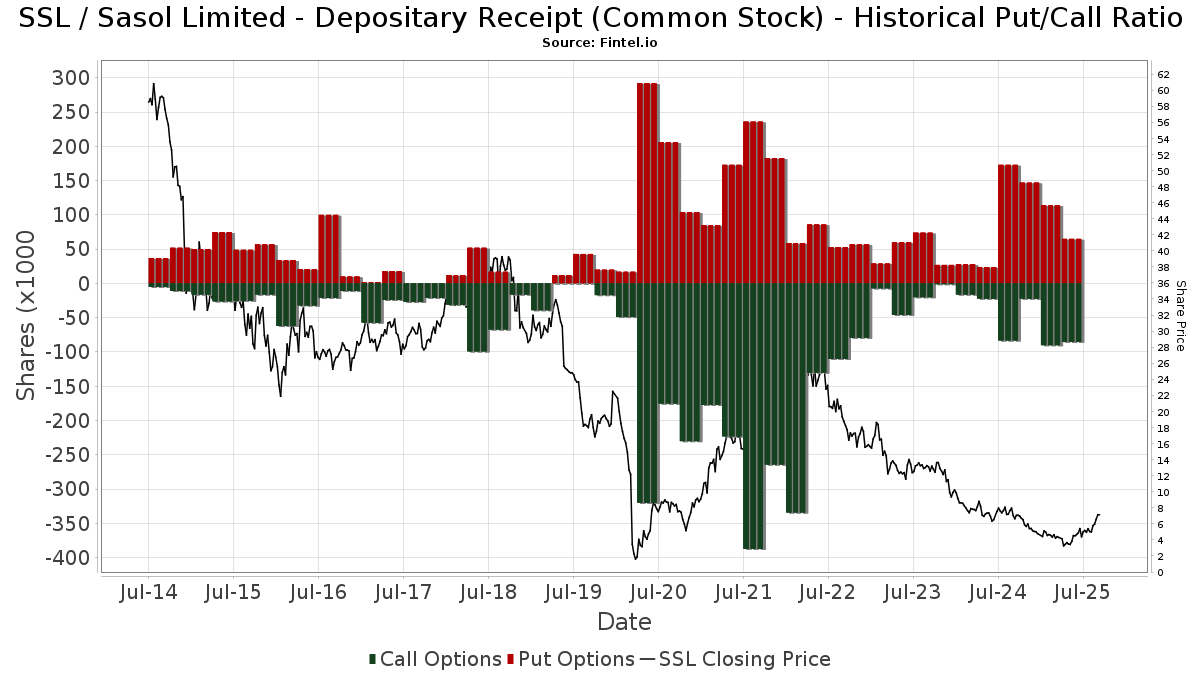
Institutionell sälj/köp-kvot
Förutom att rapportera vanliga eget kapital- och skuldemissioner måste institutioner med mer än 100MM tillgångar under förvaltning också avslöja sina innehav av sälj- och köpoptioner. Eftersom säljoptioner i allmänhet indikerar ett negativt sentiment och köpoptioner indikerar ett positivt sentiment, kan vi få en uppfattning om det övergripande institutionella sentimentet genom att plotta förhållandet mellan säljoptioner och köpoptioner. Diagrammet till höger visar det historiska förhållandet mellan sälj- och köpoptioner för detta instrument.
Genom att använda sälj/köp-kvoten som en indikator på aktieägarnas sentiment undviker man en av de största bristerna med att använda det totala institutionella ägandet, nämligen att en betydande del av de förvaltade tillgångarna investeras passivt för att följa index. Passivt förvaltade fonder köper vanligtvis inte optioner, så indikatorn för sälj/köp-kvoten ger en bättre bild av stämningen i aktivt förvaltade fonder.
13F- och NPORT-arkiveringar
Detaljer om 13F-arkiveringar är gratis. Detaljer om NP-arkiveringar kräver ett premiummedlemskap. Gröna rader indikerar nya positioner. Röda rader indikerar stängda positioner. Klicka på länk symbolen för att se hela transaktionshistoriken.
Uppgradera
för att låsa upp premiumdata och exportera till Excel ![]() .
.
| Fil Datum | Källa | Investerare | Typ | Genomsnittligt pris (beräknat) |
Aktier | Δ Aktier (%) |
Rapporterat värde (1000 USD) |
Δ Värde (%) |
Portföljallokering (%) |
|
|---|---|---|---|---|---|---|---|---|---|---|
| 2025-07-28 | NP | AVEEX - Avantis Emerging Markets Equity Fund Institutional Class This fund is a listed as child fund of American Century Companies Inc and if that institution has disclosed ownership in this security, then these positions will not be double counted when calculating total shares and total value | 26 634 | 0,00 | 118 | 1,72 | ||||
| 2025-06-26 | NP | DFA INVESTMENT DIMENSIONS GROUP INC - World ex U.S. Core Equity Portfolio Institutional Class Shares | 20 702 | 0,00 | 72 | −25,77 | ||||
| 2025-08-06 | 13F | Savant Capital, LLC | 36 116 | 160 | ||||||
| 2025-08-14 | 13F | Raymond James Financial Inc | 9 484 | −20,33 | 42 | −18,00 | ||||
| 2025-07-08 | 13F | Parallel Advisors, LLC | 17 169 | 119,86 | 76 | 127,27 | ||||
| 2025-08-08 | 13F | Abc Arbitrage Sa | 188 436 | 833 | ||||||
| 2025-08-14 | 13F | Evergreen Capital Management Llc | 23 166 | 102 | ||||||
| 2025-05-05 | 13F | Lindbrook Capital, Llc | 3 168 | −55,96 | 13 | −59,37 | ||||
| 2025-08-14 | 13F | UBS Group AG | 631 731 | −14,31 | 2 792 | −10,46 | ||||
| 2025-08-12 | 13F | XTX Topco Ltd | 0 | −100,00 | 0 | |||||
| 2025-08-13 | 13F | Guggenheim Capital Llc | 19 861 | −5,68 | 88 | −2,25 | ||||
| 2025-04-30 | 13F | Nisa Investment Advisors, Llc | 0 | −100,00 | 0 | |||||
| 2025-08-14 | 13F | Royal Bank Of Canada | 15 936 | −8,13 | 71 | −2,74 | ||||
| 2025-05-15 | 13F | Pinnacle Wealth Planning Services, Inc. | 0 | −100,00 | 0 | |||||
| 2025-08-12 | 13F | Jpmorgan Chase & Co | 59 395 | 7 081,98 | 263 | 8 633,33 | ||||
| 2025-07-25 | 13F | Cwm, Llc | 1 727 | −69,44 | 0 | |||||
| 2025-08-14 | 13F | Two Sigma Securities, Llc | 0 | −100,00 | 0 | |||||
| 2025-07-28 | NP | AVEM - Avantis Emerging Markets Equity ETF This fund is a listed as child fund of American Century Companies Inc and if that institution has disclosed ownership in this security, then these positions will not be double counted when calculating total shares and total value | 735 074 | 26,23 | 3 264 | 28,26 | ||||
| 2025-08-14 | 13F | Bnp Paribas Arbitrage, Sa | 221 995 | 210,48 | 981 | 224,83 | ||||
| 2025-08-08 | 13F | SG Americas Securities, LLC | 76 763 | 0 | ||||||
| 2025-05-08 | 13F | Essential Planning, LLC. | 0 | −100,00 | 0 | |||||
| 2025-08-12 | 13F | Pacer Advisors, Inc. | 142 633 | 128,96 | 635 | 144,79 | ||||
| 2025-08-14 | 13F | Bank Of America Corp /de/ | 537 250 | 206,17 | 2 375 | 219,95 | ||||
| 2025-08-15 | 13F | CI Private Wealth, LLC | 20 740 | −31,20 | 92 | −28,35 | ||||
| 2025-07-14 | 13F | UMA Financial Services, Inc. | 211 | 37,91 | 1 | |||||
| 2025-08-12 | 13F | American Century Companies Inc | 890 502 | 25,48 | 3 936 | 31,16 | ||||
| 2025-08-12 | 13F | Dimensional Fund Advisors Lp | 724 589 | −26,13 | 3 203 | −22,79 | ||||
| 2025-08-13 | 13F | Jump Financial, LLC | 388 598 | 211,33 | 1 718 | 225,81 | ||||
| 2025-08-14 | 13F | Sunbelt Securities, Inc. | 99 | 0,00 | 0 | |||||
| 2025-07-22 | 13F | Net Worth Advisory Group | 21 611 | 5,12 | 96 | 10,47 | ||||
| 2025-04-24 | 13F | PDS Planning, Inc | 0 | −100,00 | 0 | |||||
| 2025-08-12 | 13F | Skopos Labs, Inc. | 2 184 | 0,00 | 9 | 0,00 | ||||
| 2025-08-13 | 13F | Cerity Partners LLC | 43 002 | −25,03 | 190 | −21,49 | ||||
| 2025-05-15 | 13F | Point72 Hong Kong Ltd | 0 | −100,00 | 0 | −100,00 | ||||
| 2025-08-14 | 13F | Group One Trading, L.p. | 9 426 | −47,47 | 42 | −45,33 | ||||
| 2025-08-07 | 13F | Allworth Financial LP | 3 213 | 205,71 | 14 | 366,67 | ||||
| 2025-08-14 | 13F | Mariner, LLC | 206 154 | 236,03 | 911 | 251,74 | ||||
| 2025-08-14 | 13F | Group One Trading, L.p. | Put | 7 200 | −61,08 | 32 | −60,26 | |||
| 2025-08-14 | 13F | Sei Investments Co | 0 | −100,00 | 0 | |||||
| 2025-08-14 | 13F | Group One Trading, L.p. | Call | 10 200 | 920,00 | 45 | 1 025,00 | |||
| 2025-08-15 | 13F | Morgan Stanley | 3 089 253 | 39,02 | 13 655 | 45,27 | ||||
| 2025-08-15 | 13F | Tower Research Capital LLC (TRC) | 5 566 | −46,96 | 25 | −45,45 | ||||
| 2025-08-12 | 13F | Aigen Investment Management, Lp | 0 | −100,00 | 0 | |||||
| 2025-06-26 | NP | Dfa Investment Trust Co - The Emerging Markets Series This fund is a listed as child fund of Dimensional Fund Advisors Lp and if that institution has disclosed ownership in this security, then these positions will not be double counted when calculating total shares and total value | 305 779 | −19,24 | 1 064 | −40,19 | ||||
| 2025-08-11 | 13F | Bell Investment Advisors, Inc | 70 | 0,00 | 0 | |||||
| 2025-07-21 | 13F | Qrg Capital Management, Inc. | 22 781 | 11,33 | 101 | 16,28 | ||||
| 2025-08-08 | 13F | Creative Planning | 246 324 | 157,03 | 1 089 | 168,64 | ||||
| 2025-08-14 | 13F | GWM Advisors LLC | 18 814 | 47,57 | 83 | 56,60 | ||||
| 2025-08-14 | 13F | Point72 Asset Management, L.P. | 512 500 | 23,44 | 2 265 | 28,99 | ||||
| 2025-08-14 | 13F | Wells Fargo & Company/mn | 10 533 | 37,61 | 47 | 43,75 | ||||
| 2025-08-13 | 13F | Walleye Capital LLC | 0 | −100,00 | 0 | −100,00 | ||||
| 2025-07-28 | NP | AVXC - Avantis Emerging Markets ex-China Equity ETF | 6 939 | 37,43 | 31 | 36,36 | ||||
| 2025-08-08 | 13F | SBI Securities Co., Ltd. | 12 852 | 2,87 | 57 | 7,69 | ||||
| 2025-08-14 | 13F | Millennium Management Llc | 32 510 | −97,76 | 144 | −97,67 | ||||
| 2025-05-06 | 13F | Advisors Preferred, LLC | 0 | −100,00 | 0 | |||||
| 2025-07-08 | 13F | Northwest & Ethical Investments L.P. | 0 | −100,00 | 0 | |||||
| 2025-08-13 | 13F | First Trust Advisors Lp | 14 155 | −5,15 | 63 | −1,59 | ||||
| 2025-08-07 | 13F | Connor, Clark & Lunn Investment Management Ltd. | 767 312 | 11,93 | 3 392 | 16,97 | ||||
| 2025-08-14 | 13F | Quartz Partners, LLC | 14 504 | 8,01 | 64 | 14,29 | ||||
| 2025-08-14 | 13F | Aqr Capital Management Llc | 22 987 | 102 | ||||||
| 2025-07-24 | 13F | Ronald Blue Trust, Inc. | 13 245 | −23,12 | 59 | −19,44 | ||||
| 2025-05-15 | 13F | Verition Fund Management LLC | 0 | −100,00 | 0 | −100,00 | ||||
| 2025-05-15 | 13F | Jain Global LLC | 0 | −100,00 | 0 | |||||
| 2025-08-14 | 13F | Susquehanna International Group, Llp | Put | 36 200 | −41,33 | 160 | −38,46 | |||
| 2025-08-14 | 13F | Susquehanna International Group, Llp | 11 756 | −93,96 | 52 | −93,80 | ||||
| 2025-08-12 | 13F | Coldstream Capital Management Inc | 0 | −100,00 | 0 | |||||
| 2025-08-12 | 13F | Pathstone Holdings, LLC | 31 049 | −3,90 | 137 | 0,74 | ||||
| 2025-08-14 | 13F | Susquehanna International Group, Llp | Call | 25 100 | 42,61 | 111 | 48,65 | |||
| 2025-08-12 | 13F | Proequities, Inc. | Put | 0 | 0 | |||||
| 2025-08-13 | 13F | Quadrant Capital Group Llc | 152 631 | 264,80 | 675 | 282,95 | ||||
| 2025-06-30 | NP | CAFRX - Africa Fund | 4 000 | 0,00 | 14 | −27,78 | ||||
| 2025-08-12 | 13F | Proequities, Inc. | Call | 0 | 0 | |||||
| 2025-05-05 | 13F | Creekmur Asset Management LLC | 0 | −100,00 | 0 | |||||
| 2025-08-11 | 13F | Private Advisor Group, LLC | 41 939 | 75,82 | 185 | 85,00 | ||||
| 2025-08-12 | 13F | Proequities, Inc. | 0 | 0 | ||||||
| 2025-08-08 | 13F | Gts Securities Llc | 29 088 | 129 | ||||||
| 2025-07-24 | 13F | Us Bancorp \de\ | 23 635 | 14,71 | 104 | 19,54 | ||||
| 2025-07-25 | 13F | JustInvest LLC | 34 523 | −25,37 | 153 | −22,05 | ||||
| 2025-08-12 | 13F | BlackRock, Inc. | 2 011 911 | 55,03 | 8 893 | 62,00 | ||||
| 2025-08-12 | 13F | Trexquant Investment LP | 0 | −100,00 | 0 | |||||
| 2025-07-30 | NP | APIE - ActivePassive International Equity ETF | 54 732 | 64,07 | 243 | 67,59 | ||||
| 2025-07-16 | 13F | Signaturefd, Llc | 26 790 | 137,54 | 118 | 151,06 | ||||
| 2025-08-12 | 13F | LPL Financial LLC | 129 340 | 121,80 | 572 | 132,11 | ||||
| 2025-08-13 | 13F | Centiva Capital, LP | 0 | −100,00 | 0 | |||||
| 2025-08-13 | 13F | Northern Trust Corp | 162 406 | 0,95 | 718 | 5,44 | ||||
| 2025-08-14 | 13F | Van Eck Associates Corp | 1 176 | −28,34 | 0 | |||||
| 2025-07-14 | 13F | GAMMA Investing LLC | 4 155 | 231,08 | 18 | 260,00 | ||||
| 2025-08-21 | NP | AFK - VanEck Vectors Africa Index ETF | 28 350 | −1,12 | 125 | 3,31 | ||||
| 2025-08-13 | 13F | Barclays Plc | 0 | −100,00 | 0 | |||||
| 2025-08-11 | 13F | Principal Securities, Inc. | 167 | 221,15 | 1 | |||||
| 2025-07-24 | 13F | Jfs Wealth Advisors, Llc | 271 | 1 | ||||||
| 2025-08-14 | 13F | D. E. Shaw & Co., Inc. | 202 856 | −54,32 | 897 | −52,29 | ||||
| 2025-08-14 | 13F | Ariadne Wealth Management, LP | 11 772 | 68 | ||||||
| 2025-07-28 | NP | AVES - Avantis Emerging Markets Value ETF This fund is a listed as child fund of American Century Companies Inc and if that institution has disclosed ownership in this security, then these positions will not be double counted when calculating total shares and total value | 83 985 | 14,17 | 373 | 15,89 | ||||
| 2025-08-14 | 13F | Goldman Sachs Group Inc | 862 405 | 575,68 | 3 812 | 607,05 | ||||
| 2025-08-14 | 13F | Jane Street Group, Llc | 281 722 | 82,11 | 1 245 | 90,37 | ||||
| 2025-05-02 | 13F | Pzena Investment Management Llc | 0 | −100,00 | 0 | |||||
| 2025-05-14 | 13F | EntryPoint Capital, LLC | 0 | −100,00 | 0 | |||||
| 2025-08-12 | 13F | Rhumbline Advisers | 6 235 | −9,57 | 28 | −6,90 | ||||
| 2025-05-15 | 13F | Engineers Gate Manager LP | 0 | −100,00 | 0 | |||||
| 2025-07-18 | 13F | Generali Investments CEE, investicni spolecnost, a.s. | 367 196 | 0,00 | 1 623 | 4,51 | ||||
| 2025-07-25 | 13F | Sequoia Financial Advisors, LLC | 13 875 | 8,47 | 61 | 12,96 | ||||
| 2025-08-14 | 13F | Banco BTG Pactual S.A. | 20 000 | 88 | ||||||
| 2025-08-14 | 13F | Two Sigma Investments, Lp | 1 004 589 | −33,71 | 4 440 | −30,73 | ||||
| 2025-08-14 | 13F | Wetherby Asset Management Inc | 31 130 | −0,16 | 138 | −3,52 | ||||
| 2025-08-11 | 13F | Brown Brothers Harriman & Co | 435 | 2 | ||||||
| 2025-08-14 | 13F | Vident Advisory, LLC | 59 417 | −17,00 | 263 | −13,25 | ||||
| 2025-08-13 | 13F | Renaissance Technologies Llc | 393 800 | −8,84 | 1 741 | −4,76 | ||||
| 2025-08-14 | 13F | Ieq Capital, Llc | 13 580 | 60 | ||||||
| 2025-08-06 | 13F | True Wealth Design, LLC | 43 | −15,69 | 0 | |||||
| 2025-07-15 | 13F | Public Employees Retirement System Of Ohio | 95 728 | 15,87 | 423 | 21,20 | ||||
| 2025-07-09 | 13F | Sivia Capital Partners, LLC | 11 699 | 52 | ||||||
| 2025-08-11 | 13F | Citigroup Inc | 122 476 | 138,37 | 541 | 149,31 | ||||
| 2025-05-13 | 13F | HighTower Advisors, LLC | 0 | −100,00 | 0 | |||||
| 2025-07-30 | 13F | FNY Investment Advisers, LLC | 203 310 | 1 | ||||||
| 2025-05-12 | 13F | Greenwich Wealth Management LLC | 0 | −100,00 | 0 | |||||
| 2025-08-04 | 13F | Hantz Financial Services, Inc. | 0 | −100,00 | 0 | |||||
| 2025-08-08 | 13F | Pnc Financial Services Group, Inc. | 11 518 | 0,18 | 51 | 4,17 | ||||
| 2025-08-14 | 13F | Cubist Systematic Strategies, LLC | 285 377 | 39,36 | 1 261 | 45,61 | ||||
| 2025-08-12 | 13F | Virtu Financial LLC | 27 237 | 46,78 | 0 | |||||
| 2025-08-14 | 13F | Fmr Llc | 17 956 | −57,54 | 79 | −55,62 | ||||
| 2025-06-26 | NP | DFCEX - Emerging Markets Core Equity Portfolio - Institutional Class This fund is a listed as child fund of Dimensional Fund Advisors Lp and if that institution has disclosed ownership in this security, then these positions will not be double counted when calculating total shares and total value | 508 321 | 0,00 | 1 769 | −25,99 | ||||
| 2025-07-11 | 13F | Farther Finance Advisors, LLC | 691 | 230,62 | 3 | |||||
| 2025-07-25 | 13F | Apollon Wealth Management, LLC | 0 | −100,00 | 0 | |||||
| 2025-06-02 | 13F/A | Deutsche Bank Ag\ | 0 | −100,00 | 0 | |||||
| 2025-08-13 | 13F | FORA Capital, LLC | 0 | −100,00 | 0 | |||||
| 2025-08-14 | 13F | Schonfeld Strategic Advisors LLC | 0 | −100,00 | 0 | |||||
| 2025-07-14 | 13F | Abound Wealth Management | 26 | 0,00 | 0 | |||||
| 2025-08-05 | 13F | Simplex Trading, Llc | Call | 16 600 | −57,44 | 0 | ||||
| 2025-08-14 | 13F | Banque Transatlantique SA | 0 | −100,00 | 0 | |||||
| 2025-09-04 | 13F/A | Advisor Group Holdings, Inc. | 4 839 | −14,03 | 21 | −8,70 | ||||
| 2025-07-31 | 13F | Caitong International Asset Management Co., Ltd | 997 | 100,20 | 4 | 100,00 | ||||
| 2025-08-04 | 13F | Assetmark, Inc | 101 | 0 | ||||||
| 2025-08-07 | 13F | Sierra Ocean, Llc | 1 230 | 86,08 | 5 | 150,00 | ||||
| 2025-08-05 | 13F | Simplex Trading, Llc | Put | 100 | −99,39 | 0 | ||||
| 2025-08-05 | 13F | Simplex Trading, Llc | 2 676 | −76,74 | 0 | |||||
| 2025-08-15 | 13F | WealthCollab, LLC | 0 | −100,00 | 0 | |||||
| 2025-08-07 | 13F | Parkside Financial Bank & Trust | 406 | 2 | ||||||
| 2025-08-13 | 13F | EverSource Wealth Advisors, LLC | 8 960 | 347,33 | 40 | 387,50 | ||||
| 2025-07-28 | NP | VCGEX - Emerging Economies Fund | 20 550 | −79,64 | 91 | −80,00 | ||||
| 2025-07-15 | 13F | Ballentine Partners, LLC | 19 572 | 47,28 | 87 | 53,57 | ||||
| 2025-08-14 | 13F | Citadel Advisors Llc | 85 777 | −51,42 | 379 | −49,20 | ||||
| 2025-05-30 | NP | FRDM - Freedom 100 Emerging Markets ETF | 0 | −100,00 | 0 | −100,00 | ||||
| 2025-08-14 | 13F | Citadel Advisors Llc | Put | 22 000 | 24,29 | 97 | 31,08 | |||
| 2025-08-14 | 13F | Integrated Wealth Concepts LLC | 60 514 | 267 | ||||||
| 2025-04-23 | 13F | Legacy Advisors, LLC | 0 | −100,00 | 0 | |||||
| 2025-08-12 | 13F | MAI Capital Management | 2 652 | 12 | ||||||
| 2025-08-14 | 13F | Citadel Advisors Llc | Call | 33 200 | 1,84 | 147 | 6,57 | |||
| 2025-08-14 | 13F | Stifel Financial Corp | 264 506 | 1 169 | ||||||
| 2025-05-14 | 13F | Ameriprise Financial Inc | 0 | −100,00 | 0 | −100,00 | ||||
| 2025-08-14 | 13F | Barometer Capital Management Inc. | 51 821 | 5,93 | 229 | 11,17 | ||||
| 2025-08-14 | 13F | Two Sigma Advisers, Lp | 932 800 | −25,12 | 4 123 | −21,77 | ||||
| 2025-07-21 | 13F | Ameriflex Group, Inc. | 400 | −82,61 | 2 | −88,89 | ||||
| 2025-08-14 | 13F | Federation des caisses Desjardins du Quebec | 700 | −22,22 | 3 | 0,00 | ||||
| 2025-08-14 | 13F | Balyasny Asset Management Llc | 28 262 | −51,21 | 125 | −49,39 | ||||
| 2025-08-13 | 13F | Northwestern Mutual Wealth Management Co | 1 172 | 5 | ||||||
| 2025-08-19 | 13F | Asset Dedication, LLC | 0 | −100,00 | 0 | |||||
| 2025-08-12 | 13F | O'shaughnessy Asset Management, Llc | 0 | −100,00 | 0 | |||||
| 2025-07-28 | NP | NSI - National Security Emerging Markets Index ETF | 16 514 | 38,49 | 73 | 40,38 | ||||
| 2025-07-24 | 13F | IFP Advisors, Inc | 0 | −100,00 | 0 |
Other Listings
| DE:SAO | 6,15 € |