Grundläggande statistik
| Institutionella ägare | 113 total, 113 long only, 0 short only, 0 long/short - change of −5,00% MRQ |
| Genomsnittlig portföljallokering | 0.2577 % - change of 22,21% MRQ |
| Institutionella aktier (lång) | 7 866 651 (ex 13D/G) - change of −9,70MM shares −55,23% MRQ |
| Institutionellt värde (lång) | $ 258 725 USD ($1000) |
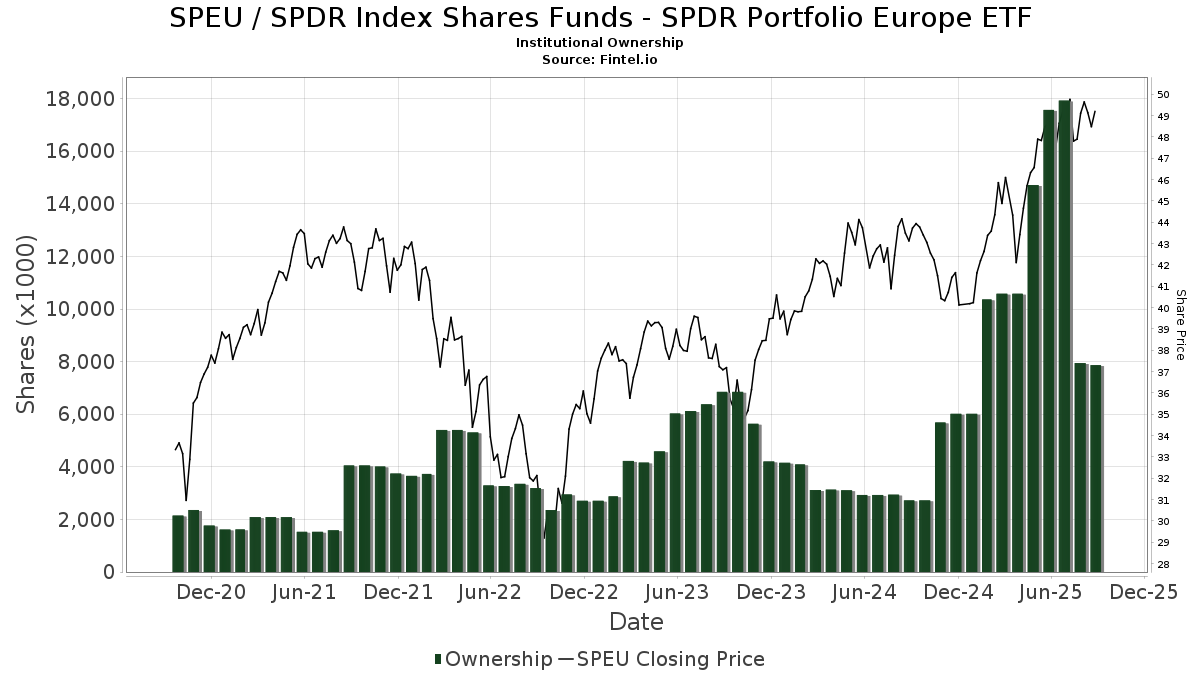
Institutionellt ägande och aktieägare
SPDR Index Shares Funds - SPDR Portfolio Europe ETF (US:SPEU) har 113 Institutionella ägare och aktieägare som har lämnat in 13D/G- eller 13F-formulär till Securities Exchange Commission (SEC). Dessa institut innehar totalt 7,866,651 aktier. Största aktieägare inkluderar Cwm, Llc, Morgan Stanley, Jane Street Group, Llc, Advisor Group Holdings, Inc., INTL - Main International ETF, Main Management ETF Advisors, LLC, LPL Financial LLC, Bank Of America Corp /de/, Jacobi Capital Management LLC, and Charles Schwab Investment Management Inc .
SPDR Index Shares Funds - SPDR Portfolio Europe ETF (ARCA:SPEU) Institutionell ägarstruktur visar institutioners och fonders nuvarande positioner i företaget, samt de senaste förändringarna i positionernas storlek. Större aktieägare kan vara enskilda investerare, fonder, hedgefonder eller institutioner. Bilaga 13D visar att investeraren äger (eller ägde) mer än 5% av företaget och avser (eller avsåg) att aktivt eftersträva en förändring av affärsstrategin. Schedule 13G indikerar en passiv investering på över 5%.
The share price as of September 12, 2025 is 49,55 / share. Previously, on September 16, 2024, the share price was 43,98 / share. This represents an increase of 12,68% over that period.
Fondsentimentets poäng
Fondsentimentet poängen(fka Ägarackumulation-poäng) visar vilka aktier som är mest köpta av fonder. Det är resultatet av en sofistikerad kvantitativ flerfaktormodell som identifierar företag med de högsta nivåerna av institutionell ackumulering. Poängsättningsmodellen använder en kombination av den totala ökningen av redovisade ägare, förändringarna i portföljallokeringarna för dessa ägare och andra mått. Siffran sträcker sig från 0 till 100, där högre siffror indikerar en högre nivå av ackumulering i förhållande till sina konkurrenter, och 50 är genomsnittet.
Uppdateringsfrekvens: Dagligen
Se Ownership Explorer, som innehåller en lista över de högst rankade företagen.
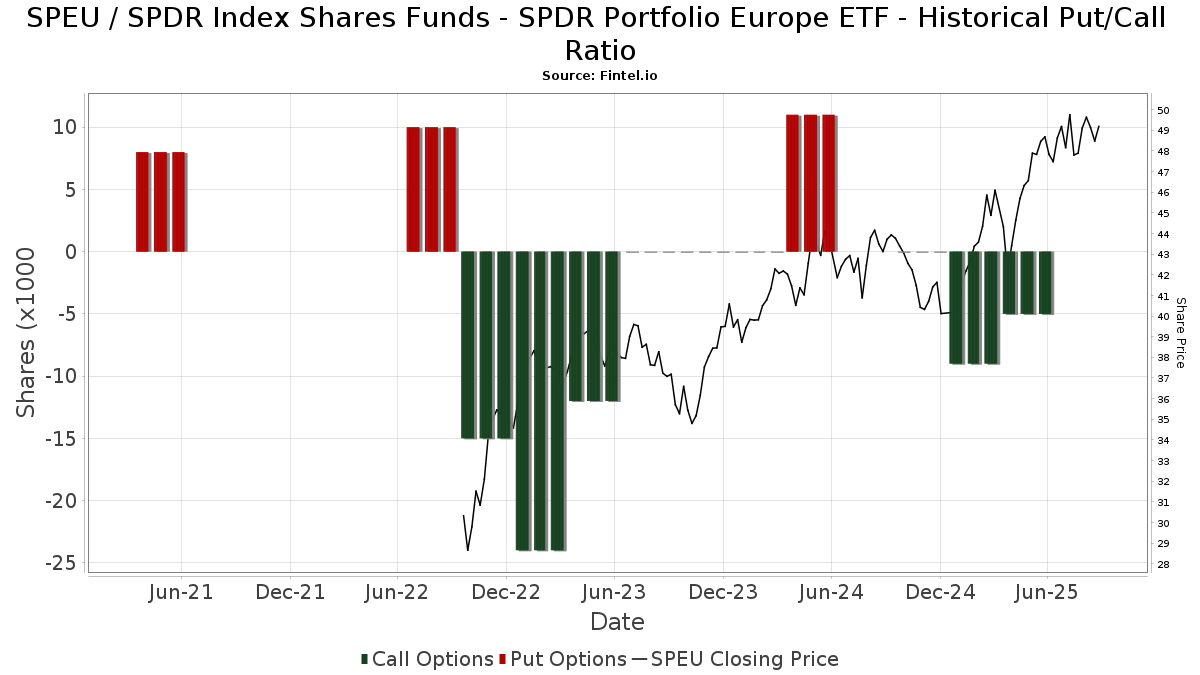
Institutionell sälj/köp-kvot
Förutom att rapportera vanliga eget kapital- och skuldemissioner måste institutioner med mer än 100MM tillgångar under förvaltning också avslöja sina innehav av sälj- och köpoptioner. Eftersom säljoptioner i allmänhet indikerar ett negativt sentiment och köpoptioner indikerar ett positivt sentiment, kan vi få en uppfattning om det övergripande institutionella sentimentet genom att plotta förhållandet mellan säljoptioner och köpoptioner. Diagrammet till höger visar det historiska förhållandet mellan sälj- och köpoptioner för detta instrument.
Genom att använda sälj/köp-kvoten som en indikator på aktieägarnas sentiment undviker man en av de största bristerna med att använda det totala institutionella ägandet, nämligen att en betydande del av de förvaltade tillgångarna investeras passivt för att följa index. Passivt förvaltade fonder köper vanligtvis inte optioner, så indikatorn för sälj/köp-kvoten ger en bättre bild av stämningen i aktivt förvaltade fonder.
13F- och NPORT-arkiveringar
Detaljer om 13F-arkiveringar är gratis. Detaljer om NP-arkiveringar kräver ett premiummedlemskap. Gröna rader indikerar nya positioner. Röda rader indikerar stängda positioner. Klicka på länk symbolen för att se hela transaktionshistoriken.
Uppgradera
för att låsa upp premiumdata och exportera till Excel ![]() .
.
| Fil Datum | Källa | Investerare | Typ | Genomsnittligt pris (beräknat) |
Aktier | Δ Aktier (%) |
Rapporterat värde (1000 USD) |
Δ Värde (%) |
Portföljallokering (%) |
|
|---|---|---|---|---|---|---|---|---|---|---|
| 2025-08-11 | 13F | Perennial Investment Advisors, LLC | 7 508 | 24,08 | 364 | 36,47 | ||||
| 2025-08-12 | 13F | Jacobi Capital Management LLC | 239 484 | 11 605 | ||||||
| 2025-08-08 | 13F | Avantax Advisory Services, Inc. | 4 954 | 240 | ||||||
| 2025-07-24 | 13F | IFP Advisors, Inc | 300 | 0,00 | 15 | 7,69 | ||||
| 2025-08-11 | 13F | Outlook Wealth Advisors, LLC | 0 | −100,00 | 0 | |||||
| 2025-07-25 | 13F | Richardson Financial Services Inc. | 0 | −100,00 | 0 | |||||
| 2025-08-14 | 13F | Novus Advisors, Llc | 0 | −100,00 | 0 | |||||
| 2025-08-18 | 13F | N.E.W. Advisory Services LLC | 190 | 1,60 | 9 | 12,50 | ||||
| 2025-07-25 | 13F | Envestnet Portfolio Solutions, Inc. | 0 | −100,00 | 0 | |||||
| 2025-05-12 | 13F | Independent Advisor Alliance | 0 | −100,00 | 0 | |||||
| 2025-07-25 | 13F | Johnson Investment Counsel Inc | 36 334 | 320,58 | 1 761 | 363,16 | ||||
| 2025-07-21 | 13F | Crews Bank & Trust | 500 | 0,00 | 24 | 9,09 | ||||
| 2025-08-14 | 13F | Williams Jones Wealth Management, LLC. | 46 800 | 2 268 | ||||||
| 2025-07-28 | 13F | Harbour Investments, Inc. | 631 | −97,85 | 31 | −97,68 | ||||
| 2025-08-14 | 13F | Treasure Coast Financial Planning | 118 562 | 7,77 | 5 746 | 18,67 | ||||
| 2025-08-14 | 13F | Sargent Investment Group, LLC | 9 835 | 73,00 | 471 | 88,00 | ||||
| 2025-05-15 | 13F | Citadel Advisors Llc | Put | 0 | −100,00 | 0 | −100,00 | |||
| 2025-08-12 | 13F | SRS Capital Advisors, Inc. | 38 | 0,00 | 2 | 0,00 | ||||
| 2025-07-10 | 13F | Sharkey, Howes & Javer | 38 127 | 1 848 | ||||||
| 2025-08-12 | 13F | Main Management LLC | 2 024 | 0,00 | 0 | |||||
| 2025-08-12 | 13F | Global Retirement Partners, LLC | 676 | −22,30 | 33 | −5,88 | ||||
| 2025-08-11 | 13F | Strategic Wealth Partners, Ltd. | 69 | 3 | ||||||
| 2025-08-05 | 13F | Key FInancial Inc | 0 | −100,00 | 0 | |||||
| 2025-05-01 | 13F | Quest 10 Wealth Builders, Inc. | 5 | 0 | ||||||
| 2025-07-16 | 13F | Castleview Partners, Llc | 6 931 | −5,83 | 336 | 3,72 | ||||
| 2025-08-13 | 13F | Flow Traders U.s. Llc | 49 300 | −83,51 | 2 | −84,62 | ||||
| 2025-08-11 | 13F | Hexagon Capital Partners LLC | 0 | −100,00 | 0 | |||||
| 2025-08-14 | 13F | Raymond James Financial Inc | 37 358 | 0,77 | 1 810 | 10,97 | ||||
| 2025-05-28 | NP | GAL - SPDR SSGA Global Allocation ETF This fund is a listed as child fund of State Street Corp and if that institution has disclosed ownership in this security, then these positions will not be double counted when calculating total shares and total value | 216 497 | −43,71 | 9 528 | −35,67 | ||||
| 2025-07-22 | 13F | Aspire Private Capital, LLC | 0 | −100,00 | 0 | |||||
| 2025-07-29 | 13F | Tradewinds Capital Management, LLC | 1 459 | 1,81 | 71 | 11,11 | ||||
| 2025-08-12 | 13F | Steward Partners Investment Advisory, Llc | 150 | 0,00 | 7 | 16,67 | ||||
| 2025-08-05 | 13F | GPS Wealth Strategies Group, LLC | 917 | 45,79 | 44 | 62,96 | ||||
| 2025-08-14 | 13F | Arete Wealth Advisors, LLC | 5 866 | 0,00 | 0 | |||||
| 2025-08-13 | 13F | Keystone Financial Group | 6 400 | −3,03 | 310 | 6,90 | ||||
| 2025-08-14 | 13F | Mml Investors Services, Llc | 8 093 | −4,33 | 0 | |||||
| 2025-08-14 | 13F | Fmr Llc | 3 382 | 4,13 | 164 | 14,79 | ||||
| 2025-07-30 | 13F | Bogart Wealth, LLC | 15 | 0,00 | 1 | |||||
| 2025-08-13 | 13F | Continuum Advisory, LLC | 0 | −100,00 | 0 | −100,00 | ||||
| 2025-07-31 | 13F | Ssa Swiss Advisors Ag | 1 500 | 0,00 | 75 | 12,12 | ||||
| 2025-08-01 | 13F | Austin Private Wealth, LLC | 0 | −100,00 | 0 | |||||
| 2025-06-27 | NP | INTL - Main International ETF | 355 515 | 16 247 | ||||||
| 2025-08-14 | 13F | Smartleaf Asset Management LLC | 42 | −82,64 | 2 | −80,00 | ||||
| 2025-04-23 | 13F | Crewe Advisors LLC | 0 | −100,00 | 0 | |||||
| 2025-08-27 | 13F | Barnes Wealth Management Group, Inc | 5 970 | 289 | ||||||
| 2025-08-06 | 13F | SOUTH STATE Corp | 20 | 1 | ||||||
| 2025-07-17 | 13F | Worth Financial Advisory Group, LLC | 4 641 | 225 | ||||||
| 2025-07-31 | 13F | Cambridge Investment Research Advisors, Inc. | 0 | −100,00 | 0 | |||||
| 2025-07-14 | 13F | Iams Wealth Management, Llc | 0 | −100,00 | 0 | |||||
| 2025-07-14 | 13F | U.S. Capital Wealth Advisors, LLC | 4 861 | 1,84 | 236 | 11,90 | ||||
| 2025-08-14 | 13F | Jane Street Group, Llc | 831 260 | 389,50 | 40 283 | 439,03 | ||||
| 2025-08-12 | 13F | Eldridge Investment Advisors, Inc. | 33 888 | 20,26 | 1 642 | 32,42 | ||||
| 2025-08-14 | 13F | Royal Bank Of Canada | 38 862 | 629,80 | 1 883 | 704,70 | ||||
| 2025-08-04 | 13F | Assetmark, Inc | 5 358 | −98,46 | 260 | −98,30 | ||||
| 2025-07-21 | 13F | Pacific Financial Group Inc | 14 972 | −1,87 | 726 | 8,05 | ||||
| 2025-05-15 | 13F | IHT Wealth Management, LLC | 0 | −100,00 | 0 | |||||
| 2025-08-14 | 13F | Citadel Advisors Llc | 12 889 | 625 | ||||||
| 2025-08-14 | 13F | Susquehanna International Group, Llp | Call | 5 400 | −43,16 | 262 | −37,56 | |||
| 2025-08-12 | 13F | Jpmorgan Chase & Co | 231 | 131,00 | 11 | 175,00 | ||||
| 2025-08-14 | 13F | Susquehanna International Group, Llp | 102 006 | 537,50 | 4 943 | 602,13 | ||||
| 2025-08-14 | 13F | Qube Research & Technologies Ltd | 2 103 | −11,71 | 102 | −2,88 | ||||
| 2025-07-30 | 13F | Atlantic Edge Private Wealth Management, LLC | 203 124 | 0,99 | 9 843 | 11,21 | ||||
| 2025-04-29 | 13F | Lee Danner & Bass Inc | 0 | −100,00 | 0 | |||||
| 2025-08-14 | 13F | Wells Fargo & Company/mn | 146 681 | 15,07 | 7 108 | 26,72 | ||||
| 2025-08-15 | 13F | WealthCollab, LLC | 839 | 1,70 | 41 | 11,11 | ||||
| 2025-07-08 | 13F | Parallel Advisors, LLC | 0 | −100,00 | 0 | |||||
| 2025-07-14 | 13F | AdvisorNet Financial, Inc | 9 | 0,00 | 0 | |||||
| 2025-08-07 | 13F | Allworth Financial LP | 33 | 0,00 | 2 | 0,00 | ||||
| 2025-08-11 | 13F | Principal Securities, Inc. | 74 | 0,00 | 4 | 50,00 | ||||
| 2025-08-18 | 13F | Hollencrest Capital Management | 15 | 0,00 | 1 | |||||
| 2025-08-14 | 13F | CoreCap Advisors, LLC | 15 | 1 | ||||||
| 2025-08-14 | 13F | Paces Ferry Wealth Advisors, Llc | 16 518 | −3,53 | 800 | 6,24 | ||||
| 2025-07-10 | 13F | Global Financial Private Client, LLC | 0 | −100,00 | 0 | |||||
| 2025-07-30 | 13F | Whittier Trust Co | 334 | 0,00 | 16 | 14,29 | ||||
| 2025-07-21 | 13F | Ascent Group, LLC | 0 | −100,00 | 0 | |||||
| 2025-04-28 | 13F | American Capital Advisory, LLC | 0 | −100,00 | 0 | |||||
| 2025-08-12 | 13F | Change Path, LLC | 4 509 | −82,69 | 219 | −80,98 | ||||
| 2025-08-14 | 13F | Bank Of America Corp /de/ | 295 524 | −4,43 | 14 321 | 5,24 | ||||
| 2025-08-12 | 13F | Integrated Advisors Network LLC | 5 235 | −0,70 | 254 | 9,05 | ||||
| 2025-08-08 | 13F | Larson Financial Group LLC | 1 063 | 0,00 | 52 | 10,87 | ||||
| 2025-08-18 | 13F/A | National Bank Of Canada /fi/ | 1 100 | 0,00 | 53 | 12,77 | ||||
| 2025-08-14 | 13F | Ameriprise Financial Inc | 4 758 | 231 | ||||||
| 2025-08-05 | 13F | NewSquare Capital LLC | 2 | 0,00 | 0 | |||||
| 2025-05-02 | 13F | Capital A Wealth Management, LLC | 8 | 0 | ||||||
| 2025-07-11 | 13F | International Private Wealth Advisors LLC | 0 | −100,00 | 0 | |||||
| 2025-08-11 | 13F | Private Advisor Group, LLC | 58 098 | 713,24 | 2 815 | 796,50 | ||||
| 2025-08-14 | 13F | State Street Corp | 0 | −100,00 | 0 | |||||
| 2025-09-04 | 13F/A | Advisor Group Holdings, Inc. | 400 941 | 16,27 | 19 181 | 26,40 | ||||
| 2025-07-16 | 13F | Diversified Enterprises, LLC | 4 811 | −12,53 | 233 | −3,72 | ||||
| 2025-08-11 | 13F | HighTower Advisors, LLC | 0 | −100,00 | 0 | |||||
| 2025-07-29 | 13F | Balboa Wealth Partners | 0 | −100,00 | 0 | |||||
| 2025-08-07 | 13F | Zions Bancorporation, National Association /ut/ | 39 | 0,00 | 2 | 0,00 | ||||
| 2025-08-06 | 13F | AE Wealth Management LLC | 101 | −99,44 | 5 | −99,50 | ||||
| 2025-08-15 | 13F | Equitable Holdings, Inc. | 101 425 | 4 915 | ||||||
| 2025-08-11 | 13F | Covestor Ltd | 0 | −100,00 | 0 | |||||
| 2025-07-03 | 13F | Garde Capital, Inc. | 993 | 28,79 | 48 | 45,45 | ||||
| 2025-07-22 | 13F | Cedar Mountain Advisors, LLC | 181 | 0,00 | 9 | 14,29 | ||||
| 2025-08-08 | 13F | TD Capital Management LLC | 1 022 | 0,00 | 50 | 11,36 | ||||
| 2025-08-12 | 13F | Allen Capital Group, LLC | 22 474 | −0,77 | 1 089 | 9,34 | ||||
| 2025-08-14 | 13F | Goldman Sachs Group Inc | 22 759 | 1 103 | ||||||
| 2025-08-12 | 13F | Main Management ETF Advisors, LLC | 353 460 | −0,58 | 17 | 13,33 | ||||
| 2025-08-14 | 13F | Betterment LLC | 0 | −100,00 | 0 | |||||
| 2025-08-08 | 13F | Cetera Investment Advisers | 52 452 | −1,72 | 2 542 | 8,22 | ||||
| 2025-08-05 | 13F | Simplex Trading, Llc | 166 | 245,83 | 0 | |||||
| 2025-08-12 | 13F | LPL Financial LLC | 346 640 | −58,74 | 16 798 | −54,56 | ||||
| 2025-08-14 | 13F | Family Management Corp | 16 188 | 0,00 | 784 | 10,11 | ||||
| 2025-08-14 | 13F | UBS Group AG | 49 373 | −35,82 | 2 393 | −29,34 | ||||
| 2025-07-11 | 13F | Farther Finance Advisors, LLC | 340 | −48,25 | 16 | −44,83 | ||||
| 2025-08-13 | 13F | Scotia Capital Inc. | 79 598 | −16,01 | 3 857 | −7,51 | ||||
| 2025-08-14 | 13F | Federation des caisses Desjardins du Quebec | 568 | 0,00 | 28 | 12,50 | ||||
| 2025-08-14 | 13F | MGB Wealth Management, LLC | 3 872 | 80,85 | 188 | 98,94 | ||||
| 2025-07-29 | 13F | Kraft, Davis & Associates, LLC | 0 | −100,00 | 0 | |||||
| 2025-08-19 | 13F | Cape Investment Advisory, Inc. | 297 | 1,71 | 14 | 16,67 | ||||
| 2025-07-25 | 13F | Lodestar Private Asset Management Llc | 13 586 | 114,70 | 658 | 136,69 | ||||
| 2025-08-13 | 13F | Transce3nd, LLC | 151 | −54,52 | 7 | −50,00 | ||||
| 2025-07-11 | 13F | Grove Bank & Trust | 3 000 | 0,00 | 145 | 9,85 | ||||
| 2025-07-14 | 13F | Park Avenue Securities Llc | 0 | −100,00 | 0 | |||||
| 2025-08-05 | 13F | Landmark Wealth Management, Inc. | 0 | −100,00 | 0 | |||||
| 2025-07-10 | 13F | Worth Asset Management, LLC | 20 536 | 995 | ||||||
| 2025-07-18 | 13F | Lockerman Financial Group, Inc. | 0 | −100,00 | 0 | |||||
| 2025-08-15 | 13F | Morgan Stanley | 896 565 | −4,40 | 43 448 | 5,26 | ||||
| 2025-08-12 | 13F | Richard W. Paul & Associates, LLC | 128 | −94,97 | 6 | −94,64 | ||||
| 2025-08-13 | 13F | Jones Financial Companies Lllp | 4 139 | −21,85 | 200 | −15,25 | ||||
| 2025-07-15 | 13F | Armis Advisers, LLC | 70 717 | 1,26 | 3 435 | 7,62 | ||||
| 2025-08-04 | 13F | Spire Wealth Management | 419 | 20 | ||||||
| 2025-07-28 | 13F | Axxcess Wealth Management, Llc | 0 | −100,00 | 0 | |||||
| 2025-07-15 | 13F | Mather Group, Llc. | 192 661 | −98,10 | 9 336 | −97,91 | ||||
| 2025-08-04 | 13F | Creative Financial Designs Inc /adv | 110 | 0,92 | 5 | 25,00 | ||||
| 2025-08-06 | 13F | Commonwealth Equity Services, Llc | 4 903 | 1,55 | 0 | |||||
| 2025-07-28 | 13F | Frazier Financial Advisors, LLC | 175 | 1,74 | 8 | 14,29 | ||||
| 2025-08-12 | 13F | Virtu Financial LLC | 32 732 | 2 | ||||||
| 2025-08-14 | 13F | Comerica Bank | 7 177 | −2,07 | 348 | 7,76 | ||||
| 2025-08-13 | 13F | GeoWealth Management, LLC | 0 | −100,00 | 0 | |||||
| 2025-08-12 | 13F | Proequities, Inc. | 0 | 0 | ||||||
| 2025-08-15 | 13F | Captrust Financial Advisors | 7 076 | 343 | ||||||
| 2025-08-01 | 13F | Envestnet Asset Management Inc | 36 739 | −90,94 | 1 780 | −90,03 | ||||
| 2025-08-06 | 13F | Csenge Advisory Group | 8 434 | −5,17 | 405 | 4,11 | ||||
| 2025-07-17 | 13F | Raleigh Capital Management Inc. | 0 | −100,00 | 0 | −100,00 | ||||
| 2025-08-14 | 13F | Mariner, LLC | 5 441 | 264 | ||||||
| 2025-07-29 | 13F | Private Trust Co Na | 5 005 | 925,61 | 243 | 1 052,38 | ||||
| 2025-07-25 | 13F | Cwm, Llc | 2 047 116 | 150,68 | 99 | 182,86 | ||||
| 2025-08-08 | 13F | Good Life Advisors, LLC | 6 585 | 319 | ||||||
| 2025-07-24 | 13F | Blair William & Co/il | 167 | 94,19 | 8 | 166,67 | ||||
| 2025-08-15 | 13F | Kestra Advisory Services, LLC | 10 395 | −41,49 | 504 | −11,29 | ||||
| 2025-08-12 | 13F | Charles Schwab Investment Management Inc | 228 076 | 11 053 | ||||||
| 2025-08-14 | 13F | Hrt Financial Lp | 0 | −100,00 | 0 | |||||
| 2025-07-22 | 13F | Merit Financial Group, LLC | 6 413 | 311 | ||||||
| 2025-07-17 | 13F | K2 Financial Inc. | 15 022 | 7,28 | 722 | 18,36 | ||||
| 2025-08-14 | 13F | GWM Advisors LLC | 7 518 | −89,38 | 364 | −88,31 |
Other Listings
| MX:SPEU |