Grundläggande statistik
| Institutionella ägare | 139 total, 139 long only, 0 short only, 0 long/short - change of −6,67% MRQ |
| Genomsnittlig portföljallokering | 0.0084 % - change of −17,61% MRQ |
| Institutionella aktier (lång) | 4 066 036 (ex 13D/G) - change of 1,00MM shares 32,79% MRQ |
| Institutionellt värde (lång) | $ 71 609 USD ($1000) |
Institutionellt ägande och aktieägare
First Trust Exchange-Traded Fund - First Trust NASDAQ Clean Edge Green Energy Index Fund (US:QCLN) har 139 Institutionella ägare och aktieägare som har lämnat in 13D/G- eller 13F-formulär till Securities Exchange Commission (SEC). Dessa institut innehar totalt 4,066,036 aktier. Största aktieägare inkluderar Kingstone Capital Partners Texas, LLC, Morgan Stanley, LPL Financial LLC, UBS Group AG, Bank Of America Corp /de/, Goldman Sachs Group Inc, Wells Fargo & Company/mn, Wealthspire Advisors, LLC, Commonwealth Equity Services, Llc, and First Trust Advisors Lp .
First Trust Exchange-Traded Fund - First Trust NASDAQ Clean Edge Green Energy Index Fund (NasdaqGM:QCLN) Institutionell ägarstruktur visar institutioners och fonders nuvarande positioner i företaget, samt de senaste förändringarna i positionernas storlek. Större aktieägare kan vara enskilda investerare, fonder, hedgefonder eller institutioner. Bilaga 13D visar att investeraren äger (eller ägde) mer än 5% av företaget och avser (eller avsåg) att aktivt eftersträva en förändring av affärsstrategin. Schedule 13G indikerar en passiv investering på över 5%.
The share price as of September 19, 2025 is 41,56 / share. Previously, on September 20, 2024, the share price was 34,88 / share. This represents an increase of 19,15% over that period.

Fondsentimentets poäng
Fondsentimentet poängen(fka Ägarackumulation-poäng) visar vilka aktier som är mest köpta av fonder. Det är resultatet av en sofistikerad kvantitativ flerfaktormodell som identifierar företag med de högsta nivåerna av institutionell ackumulering. Poängsättningsmodellen använder en kombination av den totala ökningen av redovisade ägare, förändringarna i portföljallokeringarna för dessa ägare och andra mått. Siffran sträcker sig från 0 till 100, där högre siffror indikerar en högre nivå av ackumulering i förhållande till sina konkurrenter, och 50 är genomsnittet.
Uppdateringsfrekvens: Dagligen
Se Ownership Explorer, som innehåller en lista över de högst rankade företagen.
AI+ Ask Fintel’s AI assistant about First Trust Exchange-Traded Fund - First Trust NASDAQ Clean Edge Green Energy Index Fund.
Thinking of good questions…
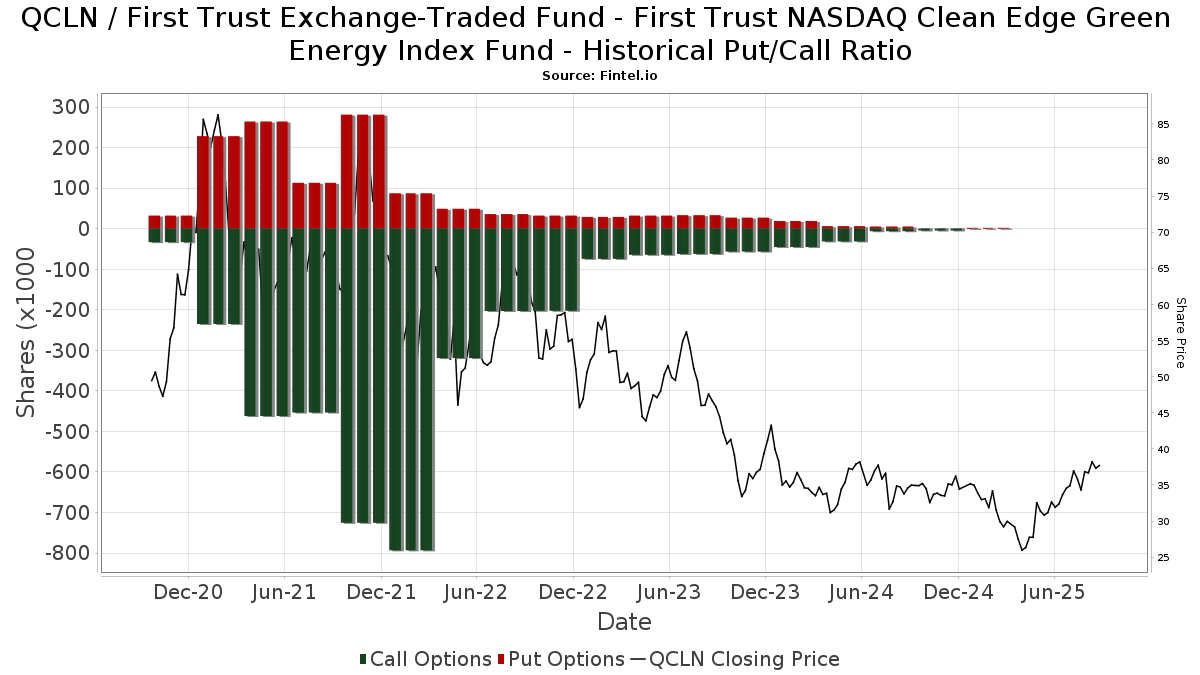
Institutionell sälj/köp-kvot
Förutom att rapportera vanliga eget kapital- och skuldemissioner måste institutioner med mer än 100MM tillgångar under förvaltning också avslöja sina innehav av sälj- och köpoptioner. Eftersom säljoptioner i allmänhet indikerar ett negativt sentiment och köpoptioner indikerar ett positivt sentiment, kan vi få en uppfattning om det övergripande institutionella sentimentet genom att plotta förhållandet mellan säljoptioner och köpoptioner. Diagrammet till höger visar det historiska förhållandet mellan sälj- och köpoptioner för detta instrument.
Genom att använda sälj/köp-kvoten som en indikator på aktieägarnas sentiment undviker man en av de största bristerna med att använda det totala institutionella ägandet, nämligen att en betydande del av de förvaltade tillgångarna investeras passivt för att följa index. Passivt förvaltade fonder köper vanligtvis inte optioner, så indikatorn för sälj/köp-kvoten ger en bättre bild av stämningen i aktivt förvaltade fonder.
13F- och NPORT-arkiveringar
Detaljer om 13F-arkiveringar är gratis. Detaljer om NP-arkiveringar kräver ett premiummedlemskap. Gröna rader indikerar nya positioner. Röda rader indikerar stängda positioner. Klicka på länk symbolen för att se hela transaktionshistoriken.
Uppgradera
för att låsa upp premiumdata och exportera till Excel ![]() .
.
| Fil Datum | Källa | Investerare | Typ | Genomsnittligt pris (beräknat) |
Aktier | Δ Aktier (%) |
Rapporterat värde (1000 USD) |
Δ Värde (%) |
Portföljallokering (%) |
|
|---|---|---|---|---|---|---|---|---|---|---|
| 2025-08-14 | 13F | UBS Group AG | 165 790 | 12,16 | 5 420 | 28,11 | ||||
| 2025-08-05 | 13F | Tsfg, Llc | 106 | 0,00 | 0 | |||||
| 2025-05-07 | 13F | Vista Private Wealth Partners. LLC | 0 | −100,00 | 0 | |||||
| 2025-08-06 | 13F | New Millennium Group LLC | 0 | −100,00 | 0 | |||||
| 2025-05-05 | 13F | Private Advisor Group, LLC | 0 | −100,00 | 0 | |||||
| 2025-08-12 | 13F | Global Retirement Partners, LLC | 820 | −37,60 | 27 | −40,91 | ||||
| 2025-07-28 | 13F | Harbour Investments, Inc. | 10 844 | −0,67 | 354 | 13,46 | ||||
| 2025-07-01 | 13F | Park National Corp /oh/ | 7 692 | −46,92 | 251 | −39,37 | ||||
| 2025-07-23 | 13F | Meitav Dash Investments Ltd | 17 528 | 0,00 | 573 | 14,17 | ||||
| 2025-05-13 | 13F | ASB Consultores, LLC | 0 | −100,00 | 0 | |||||
| 2025-07-21 | 13F | Syntax Research, Inc. | 100 | 0,00 | 3 | 50,00 | ||||
| 2025-08-13 | 13F | Transce3nd, LLC | 4 | 0 | ||||||
| 2025-04-14 | 13F | PFS Partners, LLC | 0 | −100,00 | 0 | |||||
| 2025-05-13 | 13F | Eley Financial Management, Inc | 0 | −100,00 | 0 | |||||
| 2025-08-14 | 13F | Comerica Bank | 3 518 | 4,48 | 115 | 19,79 | ||||
| 2025-08-08 | 13F | Cetera Investment Advisers | 37 781 | −10,11 | 1 235 | 2,75 | ||||
| 2025-08-07 | 13F | PFG Advisors | 7 643 | 5,29 | 250 | 20,29 | ||||
| 2025-08-12 | 13F | Choate Investment Advisors | 150 | 5 | ||||||
| 2025-08-14 | 13F | Wells Fargo & Company/mn | 98 154 | −11,10 | 3 209 | 1,55 | ||||
| 2025-08-12 | 13F | Coldstream Capital Management Inc | 0 | −100,00 | 0 | |||||
| 2025-08-14 | 13F | Federation des caisses Desjardins du Quebec | 378 | −44,17 | 12 | −36,84 | ||||
| 2025-04-15 | 13F | Central Valley Advisors, Llc | 0 | −100,00 | 0 | |||||
| 2025-07-22 | 13F | Appleton Partners Inc/ma | 8 365 | −1,18 | 0 | |||||
| 2025-08-05 | 13F | Simplex Trading, Llc | 89 | 53,45 | 0 | |||||
| 2025-08-18 | 13F | Geneos Wealth Management Inc. | 665 | −35,69 | 22 | −27,59 | ||||
| 2025-08-13 | 13F | Twin Peaks Wealth Advisors, LLC | 1 398 | 50 | ||||||
| 2025-08-14 | 13F | D. E. Shaw & Co., Inc. | 38 714 | −28,33 | 1 266 | −18,12 | ||||
| 2025-08-14 | 13F | Prestige Wealth Management Group LLC | 75 | 0,00 | 2 | 0,00 | ||||
| 2025-08-06 | 13F | Golden State Wealth Management, LLC | 0 | −100,00 | 0 | |||||
| 2025-08-13 | 13F/A | StoneX Group Inc. | 0 | −100,00 | 0 | −100,00 | ||||
| 2025-07-17 | 13F | Janney Montgomery Scott LLC | 8 104 | −9,10 | 0 | |||||
| 2025-08-14 | 13F | Goldman Sachs Group Inc | 104 096 | 136,24 | 3 403 | 169,79 | ||||
| 2025-04-17 | 13F | Good Life Advisors, LLC | 0 | −100,00 | 0 | |||||
| 2025-05-08 | 13F | Plante Moran Financial Advisors, LLC | 0 | −100,00 | 0 | |||||
| 2025-08-13 | 13F | Sumitomo Mitsui Financial Group, Inc. | 6 284 | 35,64 | 205 | 55,30 | ||||
| 2025-07-21 | 13F | Barrett & Company, Inc. | 200 | 0,00 | 7 | 20,00 | ||||
| 2025-08-05 | 13F | EPG Wealth Management LLC | 0 | −100,00 | 0 | |||||
| 2025-08-13 | 13F | Jones Financial Companies Lllp | 20 814 | 15,38 | 679 | 31,08 | ||||
| 2025-08-14 | 13F | Raymond James Financial Inc | 50 244 | −24,83 | 1 642 | −14,12 | ||||
| 2025-04-30 | 13F | Sofos Investments, Inc. | 0 | −100,00 | 0 | |||||
| 2025-08-11 | 13F | Wealthspire Advisors, LLC | 95 966 | −14,32 | 3 137 | −2,12 | ||||
| 2025-08-12 | 13F | CIBC Private Wealth Group, LLC | 91 872 | −27,57 | 3 003 | −3,19 | ||||
| 2025-07-03 | 13F | Garde Capital, Inc. | 620 | 20 | ||||||
| 2025-08-08 | 13F | Creative Planning | 8 273 | −11,91 | 270 | 0,75 | ||||
| 2025-08-11 | 13F | Citigroup Inc | 5 963 | 0,00 | 195 | 14,12 | ||||
| 2025-08-13 | 13F | Continuum Advisory, LLC | 0 | −100,00 | 0 | |||||
| 2025-07-24 | 13F | Blair William & Co/il | 1 976 | −23,97 | 65 | −13,51 | ||||
| 2025-07-25 | 13F | Cwm, Llc | 11 609 | 1,31 | 0 | |||||
| 2025-07-24 | 13F | IFP Advisors, Inc | 459 | −24,63 | 15 | −11,76 | ||||
| 2025-05-13 | 13F | Camden National Bank | 0 | −100,00 | 0 | |||||
| 2025-07-10 | 13F | Bigelow Investment Advisors, LLC | 7 042 | −50,37 | 230 | −43,35 | ||||
| 2025-07-31 | 13F | Money Design Co.,Ltd. | 77 420 | −11,57 | 3 | 0,00 | ||||
| 2025-08-08 | 13F | SBI Securities Co., Ltd. | 3 871 | −5,35 | 127 | 7,69 | ||||
| 2025-09-04 | 13F/A | Advisor Group Holdings, Inc. | 37 825 | −9,63 | 1 237 | 3,26 | ||||
| 2025-07-30 | 13F | Onyx Bridge Wealth Group LLC | 12 081 | 0,00 | 395 | 14,20 | ||||
| 2025-05-12 | 13F | Integrity Financial Corp /WA | 0 | −100,00 | 0 | |||||
| 2025-08-18 | 13F/A | National Bank Of Canada /fi/ | 752 | 25 | ||||||
| 2025-08-12 | 13F | Steward Partners Investment Advisory, Llc | 12 310 | 8,83 | 402 | 24,46 | ||||
| 2025-08-05 | 13F | Prosperity Consulting Group, LLC | 8 788 | −4,95 | 287 | 8,71 | ||||
| 2025-07-14 | 13F | Toth Financial Advisory Corp | 1 311 | 0,00 | 43 | 13,51 | ||||
| 2025-04-15 | 13F | SJS Investment Consulting Inc. | 0 | −100,00 | 0 | |||||
| 2025-07-22 | 13F | Mascoma Wealth Management LLC | 0 | −100,00 | 0 | |||||
| 2025-08-06 | 13F | Eukles Asset Management | 55 | 0,00 | 2 | 0,00 | ||||
| 2025-08-14 | 13F | Royal Bank Of Canada | 59 004 | −7,67 | 1 929 | 5,47 | ||||
| 2025-07-15 | 13F | Fifth Third Bancorp | 35 | 1 | ||||||
| 2025-08-12 | 13F | LPL Financial LLC | 188 386 | −12,84 | 6 158 | −0,44 | ||||
| 2025-08-08 | 13F | Larson Financial Group LLC | 1 228 | −9,24 | 40 | 5,26 | ||||
| 2025-08-14 | 13F | Hurley Capital, LLC | 51 | 0,00 | 2 | 0,00 | ||||
| 2025-08-08 | 13F | Avantax Advisory Services, Inc. | 7 249 | 237 | ||||||
| 2025-08-13 | 13F | Capital Analysts, Inc. | 2 262 | −1,87 | 0 | |||||
| 2025-05-15 | 13F | Ameriflex Group, Inc. | 0 | −100,00 | 0 | |||||
| 2025-08-15 | 13F | Tower Research Capital LLC (TRC) | 8 881 | −78,02 | 290 | −74,91 | ||||
| 2025-05-15 | 13F | Paragon Private Wealth Management, LLC | 0 | −100,00 | 0 | |||||
| 2025-08-07 | 13F | Winch Advisory Services, LLC | 47 | 0,00 | 2 | 0,00 | ||||
| 2025-08-08 | 13F | Capital Investment Advisory Services, LLC | 50 | 0,00 | 2 | 0,00 | ||||
| 2025-08-15 | 13F | Morgan Stanley | 323 740 | −3,54 | 10 583 | 10,18 | ||||
| 2025-08-14 | 13F | CoreCap Advisors, LLC | 95 | −34,48 | 3 | −25,00 | ||||
| 2025-07-11 | 13F | Kingstone Capital Partners Texas, LLC | 1 571 522 | 72 | ||||||
| 2025-05-12 | 13F | Kohmann Bosshard Financial Services, LLC | 0 | −100,00 | 0 | |||||
| 2025-08-11 | 13F | WPG Advisers, LLC | 0 | −100,00 | 0 | |||||
| 2025-08-01 | 13F | Liberty Wealth Management Llc | 0 | −100,00 | 0 | |||||
| 2025-07-07 | 13F | Thurston, Springer, Miller, Herd & Titak, Inc. | 28 | 0,00 | 1 | |||||
| 2025-08-06 | 13F | Commonwealth Equity Services, Llc | 94 092 | −27,30 | 3 | 0,00 | ||||
| 2025-04-28 | 13F | Private Trust Co Na | 0 | −100,00 | 0 | |||||
| 2025-07-17 | 13F | City Holding Co | 665 | −49,24 | 22 | −43,24 | ||||
| 2025-07-11 | 13F | Colorado Capital Management, Inc. | 19 158 | −6,66 | 1 | |||||
| 2025-08-13 | 13F | Northwestern Mutual Wealth Management Co | 20 848 | 2,07 | 682 | 16,61 | ||||
| 2025-08-11 | 13F | Aptus Capital Advisors, LLC | 27 | 1 | ||||||
| 2025-08-14 | 13F | Susquehanna International Group, Llp | 18 928 | −75,63 | 619 | −72,20 | ||||
| 2025-07-21 | 13F | Ameritas Advisory Services, LLC | 24 955 | −34,21 | 816 | −25,23 | ||||
| 2025-04-25 | 13F | Tradewinds Capital Management, LLC | 0 | −100,00 | 0 | |||||
| 2025-07-11 | 13F | Adirondack Trust Co | 1 030 | −5,59 | 34 | 6,45 | ||||
| 2025-07-16 | 13F/A | CX Institutional | 5 926 | −88,70 | 0 | −100,00 | ||||
| 2025-08-06 | 13F | SOUTH STATE Corp | 410 | 0,00 | 13 | 18,18 | ||||
| 2025-08-14 | 13F | Mariner, LLC | 7 942 | −10,25 | 260 | 2,37 | ||||
| 2025-08-06 | 13F | Walkner Condon Financial Advisors LLC | 20 599 | 1,43 | 673 | 15,83 | ||||
| 2025-08-13 | 13F | First Trust Advisors Lp | 92 787 | −48,75 | 3 035 | −41,44 | ||||
| 2025-08-05 | 13F | GPS Wealth Strategies Group, LLC | 247 | −52,04 | 8 | −42,86 | ||||
| 2025-05-05 | 13F | Nwam Llc | 0 | −100,00 | 0 | |||||
| 2025-07-30 | 13F | Financial Perspectives, Inc | 153 | −39,76 | 5 | −28,57 | ||||
| 2025-08-12 | 13F | Proequities, Inc. | 0 | 0 | ||||||
| 2025-05-15 | 13F | Oxford Financial Group Ltd | 0 | −100,00 | 0 | |||||
| 2025-08-19 | 13F | Newbridge Financial Services Group, Inc. | 1 000 | 0,00 | 33 | 14,29 | ||||
| 2025-08-12 | 13F | Pathstone Holdings, LLC | 17 766 | −56,99 | 581 | −50,97 | ||||
| 2025-07-30 | 13F | IMG Wealth Management, Inc. | 1 | 0,00 | 0 | |||||
| 2025-07-17 | 13F | Albion Financial Group /ut | 33 | 0,00 | 1 | |||||
| 2025-08-12 | 13F | Richard W. Paul & Associates, LLC | 0 | −100,00 | 0 | |||||
| 2025-08-14 | 13F | Gerber Kawasaki Wealth & Investment Management | 0 | −100,00 | 0 | |||||
| 2025-08-14 | 13F | Ameriprise Financial Inc | 31 888 | −7,88 | 1 065 | 7,47 | ||||
| 2025-07-24 | 13F | Us Bancorp \de\ | 839 | 21,24 | 27 | 42,11 | ||||
| 2025-08-05 | 13F | Fourth Dimension Wealth, LLC | 50 | 0,00 | 2 | 0,00 | ||||
| 2025-08-06 | 13F | North Capital, Inc. | 485 | 0,00 | 16 | 15,38 | ||||
| 2025-08-13 | 13F | Quadrature Capital Ltd | 0 | −100,00 | 0 | |||||
| 2025-08-08 | 13F | Gts Securities Llc | 25 046 | −10,14 | 819 | 2,63 | ||||
| 2025-05-16 | 13F/A | Kestra Investment Management, LLC | 0 | −100,00 | 0 | |||||
| 2025-08-13 | 13F | Russell Investments Group, Ltd. | 217 | −48,82 | 7 | −41,67 | ||||
| 2025-08-01 | 13F | Envestnet Asset Management Inc | 36 747 | −5,50 | 1 201 | 8,00 | ||||
| 2025-07-14 | 13F | AdvisorNet Financial, Inc | 25 | 0,00 | 1 | |||||
| 2025-08-13 | 13F | IAG Wealth Partners, LLC | 420 | 0,00 | 14 | 8,33 | ||||
| 2025-07-25 | 13F | Natural Investments, Llc | 8 436 | −1,71 | 0 | |||||
| 2025-08-12 | 13F | Franklin Resources Inc | 4 950 | 0,00 | 162 | 14,18 | ||||
| 2025-08-12 | 13F | Ameritas Investment Partners, Inc. | 398 | 0,25 | 13 | 9,09 | ||||
| 2025-07-10 | 13F | Wealth Enhancement Advisory Services, Llc | 9 824 | 2,90 | 340 | 24,54 | ||||
| 2025-07-21 | 13F | DHJJ Financial Advisors, Ltd. | 71 | 0,00 | 2 | 0,00 | ||||
| 2025-04-22 | 13F | Synergy Financial Management, LLC | 0 | −100,00 | 0 | |||||
| 2025-07-24 | 13F | JNBA Financial Advisors | 27 | 0,00 | 1 | |||||
| 2025-08-13 | 13F | Baird Financial Group, Inc. | 8 082 | −9,86 | 264 | 3,13 | ||||
| 2025-08-01 | 13F | Motco | 1 874 | 0,00 | 66 | 24,53 | ||||
| 2025-08-12 | 13F | SRS Capital Advisors, Inc. | 1 752 | −13,57 | 57 | −1,72 | ||||
| 2025-08-13 | 13F | Flow Traders U.s. Llc | 13 862 | −38,25 | 0 | |||||
| 2025-08-14 | 13F | Fmr Llc | 2 775 | −21,92 | 91 | −10,89 | ||||
| 2025-07-11 | 13F | Farther Finance Advisors, LLC | 2 084 | 149,88 | 68 | 183,33 | ||||
| 2025-08-08 | 13F | Pnc Financial Services Group, Inc. | 1 629 | −3,32 | 53 | 10,42 | ||||
| 2025-08-15 | 13F | Kestra Advisory Services, LLC | 12 688 | −11,55 | 415 | 0,98 | ||||
| 2025-08-01 | 13F | Rossby Financial, LCC | 1 792 | 0,06 | 59 | 16,00 | ||||
| 2025-07-18 | 13F | Bartlett & Co. Wealth Management Llc | 200 | 0,00 | 7 | 20,00 | ||||
| 2025-08-11 | 13F | TD Waterhouse Canada Inc. | 1 204 | 0,00 | 39 | 11,43 | ||||
| 2025-04-21 | 13F | Nelson, Van Denburg & Campbell Wealth Management Group, LLC | 0 | −100,00 | 0 | |||||
| 2025-08-14 | 13F | Colony Group, LLC | 7 035 | −12,55 | 230 | 0,00 | ||||
| 2025-08-12 | 13F | Founders Financial Alliance, LLC | 13 | −93,98 | 0 | −100,00 | ||||
| 2025-08-11 | 13F | PFG Private Wealth Management, LLC | 0 | −100,00 | 0 | |||||
| 2025-08-05 | 13F | Dunhill Financial, LLC | 8 | −94,12 | 0 | −100,00 | ||||
| 2025-08-14 | 13F | GWM Advisors LLC | 19 861 | 7,74 | 649 | 23,15 | ||||
| 2025-08-11 | 13F | Tidemark, LLC | 1 323 | 4,09 | 43 | 19,44 | ||||
| 2025-08-14 | 13F | Jane Street Group, Llc | 19 241 | −56,98 | 629 | −50,94 | ||||
| 2025-07-16 | 13F | Strategic Investment Solutions, Inc. /IL | 74 | 0,00 | 2 | 0,00 | ||||
| 2025-08-14 | 13F | Ancora Advisors, LLC | 54 | 0,00 | 2 | 0,00 | ||||
| 2025-08-05 | 13F | Cherry Tree Wealth Management, LLC | 960 | 0,00 | 31 | 14,81 | ||||
| 2025-08-05 | 13F | Bank Of Montreal /can/ | 368 | −67,86 | 12 | −62,50 | ||||
| 2025-08-07 | 13F | Allworth Financial LP | 751 | 0,00 | 25 | 20,00 | ||||
| 2025-08-14 | 13F | Citadel Advisors Llc | 12 698 | −65,13 | 415 | −60,17 | ||||
| 2025-08-14 | 13F | Bank Of America Corp /de/ | 153 367 | −2,84 | 5 014 | 10,98 | ||||
| 2025-08-14 | 13F | Stifel Financial Corp | 22 035 | 8,86 | 720 | 24,35 | ||||
| 2025-07-08 | 13F | Parallel Advisors, LLC | 605 | 0,00 | 20 | 11,76 | ||||
| 2025-07-31 | 13F | Wealthfront Advisers Llc | 35 402 | 107,72 | 1 157 | 137,58 | ||||
| 2025-07-23 | 13F | Nbt Bank N A /ny | 35 | 0,00 | 1 | 0,00 | ||||
| 2025-08-14 | 13F | Bnp Paribas Arbitrage, Sa | 53 997 | −2,97 | 1 765 | 10,87 | ||||
| 2025-07-01 | 13F | Harbor Investment Advisory, Llc | 901 | 0,00 | 29 | 16,00 | ||||
| 2025-05-16 | 13F | Coppell Advisory Solutions LLC | 0 | −100,00 | 0 | −100,00 | ||||
| 2025-04-23 | 13F | HBK Sorce Advisory LLC | 0 | −100,00 | 0 | |||||
| 2025-05-15 | 13F | Advisory Services Network, LLC | 0 | −100,00 | 0 | |||||
| 2025-07-08 | 13F | Nbc Securities, Inc. | 2 915 | 0,00 | 0 | |||||
| 2025-08-14 | 13F | Citadel Advisors Llc | Call | 0 | −100,00 | 0 | ||||
| 2025-08-11 | 13F | Principal Securities, Inc. | 0 | −100,00 | 0 | |||||
| 2025-05-05 | 13F | Blue Bell Private Wealth Management, Llc | 0 | −100,00 | 0 | |||||
| 2025-08-04 | 13F | Keybank National Association/oh | 7 188 | 0,00 | 235 | 14,15 | ||||
| 2025-08-12 | 13F | Jpmorgan Chase & Co | 5 784 | −30,71 | 189 | −20,59 | ||||
| 2025-08-14 | 13F | Citadel Advisors Llc | Put | 0 | −100,00 | 0 | ||||
| 2025-08-12 | 13F | PSI Advisors, LLC | 0 | −100,00 | 0 | |||||
| 2025-07-11 | 13F | First PREMIER Bank | 5 425 | 0,00 | 0 | |||||
| 2025-07-17 | 13F | Sound Income Strategies, LLC | 50 | −16,67 | 2 | 0,00 | ||||
| 2025-08-11 | 13F | HighTower Advisors, LLC | 25 171 | −15,25 | 823 | −3,29 | ||||
| 2025-08-05 | 13F | Huntington National Bank | 8 | 16,67 | ||||||
| 2025-08-14 | 13F | Mml Investors Services, Llc | 10 049 | −4,90 | 0 | |||||
| 2025-08-14 | 13F | Qube Research & Technologies Ltd | 122 | 4 | ||||||
| 2025-07-30 | 13F | Blume Capital Management, Inc. | 250 | 0,00 | 8 | 14,29 | ||||
| 2025-08-06 | 13F | AE Wealth Management LLC | 1 644 | −36,11 | 54 | −27,40 | ||||
| 2025-08-14 | 13F | Two Sigma Securities, Llc | 0 | −100,00 | 0 | |||||
| 2025-07-28 | 13F | Copia Wealth Management | 146 | 0,00 | 5 | 0,00 | ||||
| 2025-08-18 | 13F | Pacific Center for Financial Services | 525 | 0,00 | 17 | 13,33 | ||||
| 2025-07-16 | 13F | Signaturefd, Llc | 31 | 0,00 | 1 | |||||
| 2025-07-18 | 13F | PFG Investments, LLC | 10 436 | −47,88 | 341 | −40,49 | ||||
| 2025-07-14 | 13F | Painted Porch Advisors LLC | 0 | −100,00 | 0 | |||||
| 2025-07-31 | 13F | Cambridge Investment Research Advisors, Inc. | 38 359 | −27,84 | 1 | 0,00 | ||||
| 2025-08-12 | 13F | MAI Capital Management | 4 870 | 1,59 | 159 | 16,06 | ||||
| 2025-08-05 | 13F | Westside Investment Management, Inc. | 84 | −85,62 | 3 | −87,50 | ||||
| 2025-08-14 | 13F | Boston Private Wealth Llc | 0 | −100,00 | 0 |
Other Listings
| MX:QCLN |