Grundläggande statistik
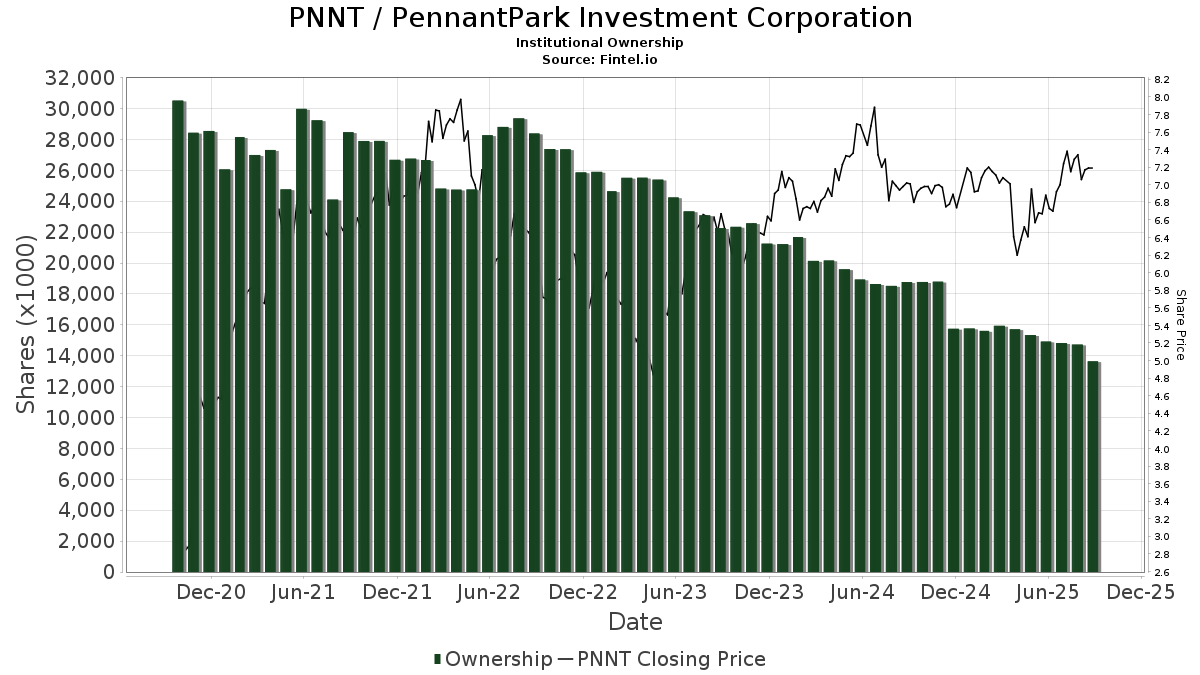
| Institutionella ägare | 124 total, 121 long only, 1 short only, 2 long/short - change of −3,88% MRQ |
| Genomsnittlig portföljallokering | 0.1094 % - change of −2,25% MRQ |
| Institutionella aktier (lång) | 13 640 711 (ex 13D/G) - change of −1,28MM shares −8,57% MRQ |
| Institutionellt värde (lång) | $ 77 705 USD ($1000) |
Institutionellt ägande och aktieägare
PennantPark Investment Corporation (US:PNNT) har 124 Institutionella ägare och aktieägare som har lämnat in 13D/G- eller 13F-formulär till Securities Exchange Commission (SEC). Dessa institut innehar totalt 13,640,711 aktier. Största aktieägare inkluderar KBWD - Invesco KBW High Dividend Yield Financial ETF, Invesco Ltd., Lsv Asset Management, Two Sigma Advisers, Lp, Two Sigma Investments, Lp, Truvestments Capital Llc, Advisors Asset Management, Inc., BlackRock, Inc., Morgan Stanley, and Hennion & Walsh Asset Management, Inc. .
PennantPark Investment Corporation (NYSE:PNNT) Institutionell ägarstruktur visar institutioners och fonders nuvarande positioner i företaget, samt de senaste förändringarna i positionernas storlek. Större aktieägare kan vara enskilda investerare, fonder, hedgefonder eller institutioner. Bilaga 13D visar att investeraren äger (eller ägde) mer än 5% av företaget och avser (eller avsåg) att aktivt eftersträva en förändring av affärsstrategin. Schedule 13G indikerar en passiv investering på över 5%.
The share price as of September 11, 2025 is 7,11 / share. Previously, on September 12, 2024, the share price was 6,93 / share. This represents an increase of 2,60% over that period.
Fondsentimentets poäng
Fondsentimentet poängen(fka Ägarackumulation-poäng) visar vilka aktier som är mest köpta av fonder. Det är resultatet av en sofistikerad kvantitativ flerfaktormodell som identifierar företag med de högsta nivåerna av institutionell ackumulering. Poängsättningsmodellen använder en kombination av den totala ökningen av redovisade ägare, förändringarna i portföljallokeringarna för dessa ägare och andra mått. Siffran sträcker sig från 0 till 100, där högre siffror indikerar en högre nivå av ackumulering i förhållande till sina konkurrenter, och 50 är genomsnittet.
Uppdateringsfrekvens: Dagligen
Se Ownership Explorer, som innehåller en lista över de högst rankade företagen.
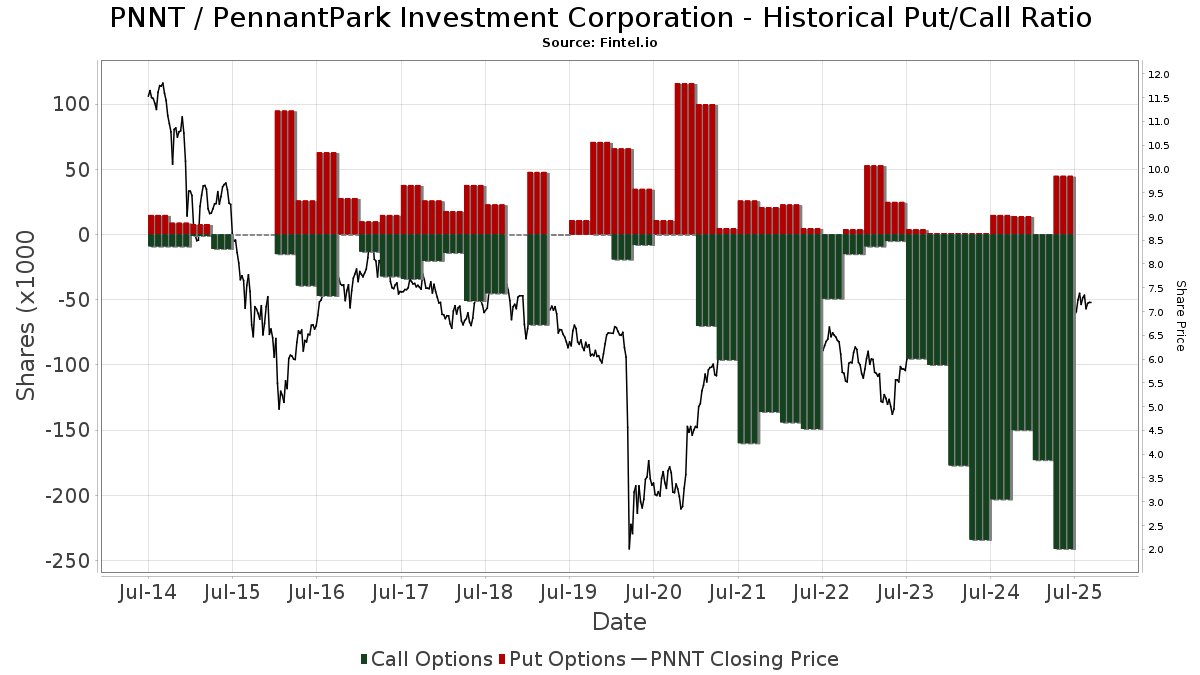
Institutionell sälj/köp-kvot
Förutom att rapportera vanliga eget kapital- och skuldemissioner måste institutioner med mer än 100MM tillgångar under förvaltning också avslöja sina innehav av sälj- och köpoptioner. Eftersom säljoptioner i allmänhet indikerar ett negativt sentiment och köpoptioner indikerar ett positivt sentiment, kan vi få en uppfattning om det övergripande institutionella sentimentet genom att plotta förhållandet mellan säljoptioner och köpoptioner. Diagrammet till höger visar det historiska förhållandet mellan sälj- och köpoptioner för detta instrument.
Genom att använda sälj/köp-kvoten som en indikator på aktieägarnas sentiment undviker man en av de största bristerna med att använda det totala institutionella ägandet, nämligen att en betydande del av de förvaltade tillgångarna investeras passivt för att följa index. Passivt förvaltade fonder köper vanligtvis inte optioner, så indikatorn för sälj/köp-kvoten ger en bättre bild av stämningen i aktivt förvaltade fonder.
13F- och NPORT-arkiveringar
Detaljer om 13F-arkiveringar är gratis. Detaljer om NP-arkiveringar kräver ett premiummedlemskap. Gröna rader indikerar nya positioner. Röda rader indikerar stängda positioner. Klicka på länk symbolen för att se hela transaktionshistoriken.
Uppgradera
för att låsa upp premiumdata och exportera till Excel ![]() .
.
| Fil Datum | Källa | Investerare | Typ | Genomsnittligt pris (beräknat) |
Aktier | Δ Aktier (%) |
Rapporterat värde (1000 USD) |
Δ Värde (%) |
Portföljallokering (%) |
|
|---|---|---|---|---|---|---|---|---|---|---|
| 2025-07-01 | 13F | Confluence Investment Management Llc | 24 623 | −81,11 | 168 | −81,66 | ||||
| 2025-07-21 | 13F | West Financial Advisors, LLC | 350 | 3,55 | 2 | 0,00 | ||||
| 2025-05-05 | 13F | Lindbrook Capital, Llc | 208 | 85,71 | 1 | |||||
| 2025-08-14 | 13F | Sunbelt Securities, Inc. | 17 577 | −75,60 | 124 | −75,49 | ||||
| 2025-08-08 | 13F | Condor Capital Management | 14 151 | −93,14 | 97 | −93,37 | ||||
| 2025-05-14 | 13F | Virtus ETF Advisers LLC | 0 | −100,00 | 0 | |||||
| 2025-08-13 | 13F | PharVision Advisers, LLC | 0 | −100,00 | 0 | |||||
| 2025-05-14 | 13F | Bnp Paribas Arbitrage, Sa | 0 | −100,00 | 0 | |||||
| 2025-08-04 | 13F | Kovack Advisors, Inc. | 67 850 | 2,73 | 464 | 0,00 | ||||
| 2025-07-21 | 13F | Ameritas Advisory Services, LLC | 558 | 4 | ||||||
| 2025-08-05 | 13F | Key FInancial Inc | 375 | 0,00 | 3 | 0,00 | ||||
| 2025-08-12 | 13F | LPL Financial LLC | 51 312 | 190,88 | 351 | 182,26 | ||||
| 2025-07-14 | 13F | Edge Wealth Management LLC | 20 000 | 0,00 | 137 | −2,86 | ||||
| 2025-08-06 | 13F | Commonwealth Equity Services, Llc | 45 062 | −20,29 | 0 | |||||
| 2025-08-08 | 13F | Larson Financial Group LLC | 2 000 | 0,00 | 14 | −7,14 | ||||
| 2025-08-27 | NP | BBVSX - Bridge Builder Small/Mid Cap Value Fund | 163 500 | 0,00 | 1 118 | −2,70 | ||||
| 2025-07-16 | 13F | Essex Financial Services, Inc. | 40 696 | 0,00 | 278 | −2,80 | ||||
| 2025-08-11 | 13F | Pin Oak Investment Advisors Inc | 0 | 0 | ||||||
| 2025-08-13 | 13F | Garner Asset Management Corp | 79 118 | −18,35 | 541 | −20,56 | ||||
| 2025-05-15 | 13F | Citadel Advisors Llc | 0 | −100,00 | 0 | −100,00 | ||||
| 2025-07-31 | 13F | Caitong International Asset Management Co., Ltd | 834 | 456,00 | 6 | 400,00 | ||||
| 2025-04-28 | 13F | Strategic Financial Concepts, LLC | 0 | −100,00 | 0 | −100,00 | ||||
| 2025-08-08 | 13F | Advisors Capital Management, LLC | 83 176 | −15,72 | 569 | −18,04 | ||||
| 2025-07-30 | 13F | Denali Advisors Llc | 106 775 | −1,82 | 730 | −4,45 | ||||
| 2025-08-15 | 13F | Tower Research Capital LLC (TRC) | 0 | −100,00 | 0 | |||||
| 2025-08-07 | 13F | Allworth Financial LP | 9 254 | 7 742,37 | 63 | |||||
| 2025-08-08 | 13F | Creative Planning | 33 369 | 26,37 | 228 | 23,24 | ||||
| 2025-08-12 | 13F | Steward Partners Investment Advisory, Llc | 1 865 | 0,00 | 13 | −7,69 | ||||
| 2025-08-14 | 13F | Citadel Advisors Llc | Put | 0 | −100,00 | 0 | ||||
| 2025-04-17 | 13F | FNY Investment Advisers, LLC | 0 | −100,00 | 0 | |||||
| 2025-04-29 | 13F | Envestnet Asset Management Inc | 0 | −100,00 | 0 | |||||
| 2025-08-11 | 13F | EMC Capital Management | 13 321 | −58,10 | 0 | |||||
| 2025-08-12 | 13F | XTX Topco Ltd | 0 | −100,00 | 0 | |||||
| 2025-08-12 | 13F | Global Retirement Partners, LLC | 7 283 | −72,29 | 50 | −73,66 | ||||
| 2025-04-23 | NP | First Trust Specialty Finance & Financial Opportunities Fund This fund is a listed as child fund of First Trust Advisors Lp and if that institution has disclosed ownership in this security, then these positions will not be double counted when calculating total shares and total value | 106 000 | −58,59 | 771 | −55,57 | ||||
| 2025-04-29 | 13F | Raleigh Capital Management Inc. | 0 | −100,00 | 0 | |||||
| 2025-08-13 | 13F | Virtus Investment Advisers, Inc. | 147 296 | −12,77 | 1 008 | −15,16 | ||||
| 2025-08-14 | 13F | Jane Street Group, Llc | 0 | −100,00 | 0 | −100,00 | ||||
| 2025-08-12 | 13F | BlackRock, Inc. | 500 390 | 21,06 | 3 423 | 17,80 | ||||
| 2025-07-03 | 13F | Garde Capital, Inc. | 1 110 | 0,00 | 8 | 0,00 | ||||
| 2025-07-21 | 13F | Catalina Capital Group, LLC | 0 | −100,00 | 0 | |||||
| 2025-08-11 | 13F | Citigroup Inc | 1 439 | 0,00 | 10 | −10,00 | ||||
| 2025-05-02 | 13F/A | Mackenzie Financial Corp | 0 | −100,00 | 0 | |||||
| 2025-08-14 | 13F | Mariner, LLC | 12 630 | 86 | ||||||
| 2025-08-14 | 13F | Verition Fund Management LLC | 25 775 | 176 | ||||||
| 2025-08-11 | 13F | Hexagon Capital Partners LLC | 0 | −100,00 | 0 | |||||
| 2025-08-13 | 13F | Cresset Asset Management, LLC | 23 002 | 2,22 | 159 | 0,00 | ||||
| 2025-05-05 | 13F | IFP Advisors, Inc | 0 | −100,00 | 0 | |||||
| 2025-07-25 | 13F | Atria Wealth Solutions, Inc. | 0 | −100,00 | 0 | |||||
| 2025-08-04 | 13F | Arkadios Wealth Advisors | 30 061 | 0,00 | 206 | −2,84 | ||||
| 2025-08-13 | 13F | Quadrant Capital Group Llc | 0 | −100,00 | 0 | |||||
| 2025-05-12 | 13F | Virtu Financial LLC | 0 | −100,00 | 0 | |||||
| 2025-08-05 | 13F | Simplex Trading, Llc | Put | 400 | 0,00 | 0 | ||||
| 2025-08-13 | 13F | Northern Trust Corp | 46 204 | 90,85 | 316 | 85,88 | ||||
| 2025-08-05 | 13F | Simplex Trading, Llc | Call | 39 100 | 272,38 | 0 | ||||
| 2025-08-14 | 13F/A | Rockefeller Capital Management L.P. | 195 676 | 0,00 | 1 338 | −2,69 | ||||
| 2025-08-08 | 13F | Pnc Financial Services Group, Inc. | 2 635 | 0,00 | 18 | 0,00 | ||||
| 2025-08-14 | 13F | Brevan Howard Capital Management LP | 39 347 | 269 | ||||||
| 2025-08-14 | 13F | Royal Bank Of Canada | 65 208 | 62,39 | 446 | 58,16 | ||||
| 2025-08-13 | 13F | Baird Financial Group, Inc. | 13 725 | 0,00 | 94 | −3,12 | ||||
| 2025-05-29 | NP | JAFEX - Total Stock Market Index Trust NAV | 25 | −98,48 | 0 | −100,00 | ||||
| 2025-08-13 | 13F | Truvestments Capital Llc | 595 000 | −0,26 | 4 070 | −2,96 | ||||
| 2025-06-27 | NP | LBO - WHITEWOLF Publicly Listed Private Equity ETF | 5 739 | 14,28 | 37 | 5,71 | ||||
| 2025-08-11 | 13F | Principal Securities, Inc. | 500 | 3 | ||||||
| 2025-08-13 | 13F | Quantbot Technologies LP | 19 229 | 132 | ||||||
| 2025-04-18 | 13F | Cornerstone Wealth Management, LLC | 0 | −100,00 | 0 | −100,00 | ||||
| 2025-08-11 | 13F | Lsv Asset Management | 1 782 360 | −3,33 | 12 | 0,00 | ||||
| 2025-08-13 | 13F | Texas Capital Bank Wealth Management Services Inc | 152 033 | 0,00 | 1 040 | −2,72 | ||||
| 2025-08-14 | 13F | Aquatic Capital Management LLC | 24 616 | 168 | ||||||
| 2025-08-06 | 13F | Smh Capital Advisors Inc | 68 210 | 0,00 | 467 | −2,71 | ||||
| 2025-07-28 | 13F | Harbour Investments, Inc. | 160 | 0,00 | 1 | 0,00 | ||||
| 2025-08-08 | 13F | Alberta Investment Management Corp | 0 | −100,00 | 0 | |||||
| 2025-05-14 | 13F | Group One Trading, L.p. | Put | 0 | −100,00 | 0 | −100,00 | |||
| 2025-08-14 | 13F | Raymond James Financial Inc | 90 525 | −0,83 | 619 | −3,43 | ||||
| 2025-07-17 | 13F | Sound Income Strategies, LLC | 2 573 | 0,00 | 18 | −5,56 | ||||
| 2025-07-29 | 13F | International Assets Investment Management, Llc | 31 350 | 0,00 | 214 | −2,73 | ||||
| 2025-08-11 | 13F | NewEdge Wealth, LLC | 255 399 | −9,42 | 1 847 | −6,86 | ||||
| 2025-08-11 | 13F | HighTower Advisors, LLC | 23 373 | −35,55 | 160 | −37,40 | ||||
| 2025-07-16 | 13F | Beaumont Financial Advisors, LLC | 25 343 | 3,61 | 173 | 1,17 | ||||
| 2025-08-26 | 13F/A | Thrivent Financial For Lutherans | 48 285 | 0 | ||||||
| 2025-05-06 | 13F | Cetera Investment Advisers | 0 | −100,00 | 0 | |||||
| 2025-07-17 | 13F | Janney Montgomery Scott LLC | 132 518 | 1,13 | 1 | |||||
| 2025-08-14 | 13F | LaSalle St. Investment Advisors, LLC | 19 559 | −13,16 | 0 | |||||
| 2025-07-14 | 13F | Ridgewood Investments LLC | 1 000 | 0,00 | 7 | −14,29 | ||||
| 2025-08-14 | 13F | Bank Of America Corp /de/ | 93 985 | −4,84 | 643 | −7,49 | ||||
| 2025-08-14 | 13F | Wells Fargo & Company/mn | 47 914 | 28,84 | 328 | 25,29 | ||||
| 2025-07-17 | 13F | Sterneck Capital Management, LLC | 72 894 | 14,09 | 499 | 10,91 | ||||
| 2025-08-14 | 13F | Two Sigma Securities, Llc | 11 427 | 8,74 | 78 | 6,85 | ||||
| 2025-08-12 | 13F | MAI Capital Management | 235 | 2 | ||||||
| 2025-08-14 | 13F | Susquehanna International Group, Llp | 19 148 | −59,51 | 131 | −60,84 | ||||
| 2025-07-29 | NP | SLPAX - Siit Small Cap Fund - Class A | 43 000 | 0,00 | 286 | −8,33 | ||||
| 2025-07-11 | 13F | Farther Finance Advisors, LLC | 325 | 2,52 | 2 | 0,00 | ||||
| 2025-08-14 | 13F | Susquehanna International Group, Llp | Call | 112 100 | −24,00 | 767 | −26,06 | |||
| 2025-08-14 | 13F | Group One Trading, L.p. | Call | 54 200 | 2 752,63 | 371 | 2 746,15 | |||
| 2025-08-14 | 13F | Susquehanna International Group, Llp | Put | 24 400 | 167 | |||||
| 2025-08-05 | 13F | Dunhill Financial, LLC | 7 927 | 54 | ||||||
| 2025-08-12 | 13F | Trexquant Investment LP | 0 | −100,00 | 0 | |||||
| 2025-06-25 | NP | VPC - Virtus Private Credit Strategy ETF | 154 242 | 5,04 | 1 006 | −3,74 | ||||
| 2025-07-16 | 13F | Signaturefd, Llc | 37 539 | 3,10 | 257 | 0,39 | ||||
| 2025-06-26 | NP | LSVQX - LSV Small Cap Value Fund Institutional Class Shares | 195 900 | 0,00 | 1 277 | −8,26 | ||||
| 2025-07-22 | 13F | Grimes & Company, Inc. | 38 788 | −24,87 | 265 | −26,80 | ||||
| 2025-07-29 | 13F | Regions Financial Corp | 20 000 | 0,00 | 137 | −2,86 | ||||
| 2025-08-14 | 13F | Stifel Financial Corp | 18 708 | −16,33 | 128 | −19,11 | ||||
| 2025-08-14 | 13F | Citadel Advisors Llc | Call | 36 300 | 168,89 | 248 | 163,83 | |||
| 2025-07-18 | 13F | Trust Co Of Vermont | 1 050 | 7 | ||||||
| 2025-07-21 | 13F | Ameriflex Group, Inc. | 0 | −100,00 | 0 | |||||
| 2025-08-12 | 13F | CIBC Private Wealth Group, LLC | 6 600 | 0,00 | 45 | 15,38 | ||||
| 2025-08-12 | 13F | Proequities, Inc. | Put | 0 | 0 | |||||
| 2025-08-14 | 13F | Quarry LP | 0 | −100,00 | 0 | |||||
| 2025-05-15 | 13F | Millennium Management Llc | 0 | −100,00 | 0 | −100,00 | ||||
| 2025-07-30 | 13F | Brookstone Capital Management | 10 415 | 3,61 | 71 | 1,43 | ||||
| 2025-08-07 | 13F | Hennion & Walsh Asset Management, Inc. | 462 709 | −25,88 | 3 165 | −27,89 | ||||
| 2025-08-12 | 13F | Proequities, Inc. | Call | 0 | 0 | |||||
| 2025-08-13 | 13F | EverSource Wealth Advisors, LLC | 3 695 | 100,60 | 25 | 108,33 | ||||
| 2025-08-12 | 13F | Proequities, Inc. | 0 | 0 | ||||||
| 2025-08-14 | 13F | Abbot Financial Management, Inc. | 74 511 | 0,01 | 510 | −2,68 | ||||
| 2025-08-14 | 13F | Two Sigma Advisers, Lp | 1 276 218 | −5,02 | 8 729 | −7,59 | ||||
| 2025-08-15 | 13F | Morgan Stanley | 477 967 | −2,51 | 3 269 | −5,14 | ||||
| 2025-07-14 | 13F | Crew Capital Management, Ltd. | 0 | −100,00 | 0 | |||||
| 2025-06-12 | 13F/A | Deutsche Bank Ag\ | 0 | −100,00 | 0 | |||||
| 2025-08-28 | NP | SMVIX - Simt Small Cap Value Fund Class I | 8 318 | −71,58 | 57 | −72,68 | ||||
| 2025-08-14 | 13F | Qube Research & Technologies Ltd | 0 | −100,00 | 0 | |||||
| 2025-08-14 | 13F | BI Asset Management Fondsmaeglerselskab A/S | 89 022 | 0,00 | 1 | |||||
| 2025-05-14 | 13F | Congress Wealth Management LLC / DE / | 0 | −100,00 | 0 | |||||
| 2025-08-12 | 13F | Advisors Asset Management, Inc. | 526 754 | −13,67 | 3 603 | −16,02 | ||||
| 2025-08-14 | 13F | UBS Group AG | 154 394 | 48,08 | 1 056 | 44,26 | ||||
| 2025-08-13 | 13F | Marshall Wace, Llp | 0 | −100,00 | 0 | |||||
| 2025-04-22 | 13F | TrueMark Investments, LLC | 0 | −100,00 | 0 | |||||
| 2025-08-14 | 13F | Evergreen Capital Management Llc | 21 167 | −20,94 | 146 | −23,16 | ||||
| 2025-04-04 | 13F | Webster Bank, N. A. | 0 | −100,00 | 0 | |||||
| 2025-07-24 | 13F | Us Bancorp \de\ | 40 | 0,00 | 0 | |||||
| 2025-07-28 | NP | KBWD - Invesco KBW High Dividend Yield Financial ETF This fund is a listed as child fund of Invesco Ltd. and if that institution has disclosed ownership in this security, then these positions will not be double counted when calculating total shares and total value | 1 836 639 | 0,00 | 12 232 | −8,39 | ||||
| 2025-08-13 | 13F | Lido Advisors, LLC | 246 312 | 0,00 | 1 704 | −2,68 | ||||
| 2025-08-08 | 13F | Cedar Wealth Management, LLC | 3 940 | 0,00 | 27 | −3,70 | ||||
| 2025-08-12 | 13F | Jpmorgan Chase & Co | 200 | −96,64 | 1 | −97,56 | ||||
| 2025-08-12 | 13F | Founders Financial Alliance, LLC | 62 127 | −2,15 | 425 | −4,93 | ||||
| 2025-07-31 | 13F | Cambridge Investment Research Advisors, Inc. | 37 894 | 5,61 | 0 | |||||
| 2025-05-23 | 13F | SWAN Capital LLC | 0 | −100,00 | 0 | |||||
| 2025-09-04 | 13F/A | Advisor Group Holdings, Inc. | 75 046 | −2,31 | 513 | −5,00 | ||||
| 2025-08-13 | 13F | Invesco Ltd. | 1 836 639 | 0,00 | 12 563 | −2,70 | ||||
| 2025-08-05 | 13F | Huntington National Bank | 1 | 0,00 | 0 | |||||
| 2025-05-02 | 13F | Legacy Capital Wealth Partners, LLC | 0 | −100,00 | 0 | |||||
| 2025-08-01 | 13F | Rossby Financial, LCC | 1 500 | 0,00 | 10 | 11,11 | ||||
| 2025-08-28 | NP | TRIFX - Catalyst/SMH Total Return Income Fund Class A | 68 210 | 0,00 | 467 | −2,71 | ||||
| 2025-08-04 | 13F | Roble, Belko & Company, Inc | 124 | 3,33 | 0 | |||||
| 2025-08-14 | 13F | Hrt Financial Lp | 21 250 | 0 | ||||||
| 2025-08-04 | 13F | Spire Wealth Management | 1 134 | 8 | ||||||
| 2025-08-14 | 13F | Jane Street Group, Llc | Put | 20 300 | 139 | |||||
| 2025-08-12 | 13F | Close Asset Management Ltd | 23 800 | −38,66 | 0 | |||||
| 2025-08-12 | 13F | Legal & General Group Plc | 430 816 | −1,53 | 2 942 | −4,26 | ||||
| 2025-08-06 | 13F | First Horizon Advisors, Inc. | 5 179 | 35 | ||||||
| 2025-08-15 | 13F | Caxton Associates Llp | 48 210 | 0,00 | 330 | −2,66 | ||||
| 2025-08-25 | NP | TMVAX - RBC Microcap Value Fund A Shares | 24 100 | 0,00 | 165 | −2,96 | ||||
| 2025-07-14 | 13F | Gries Financial Llc | 43 935 | 0,00 | 301 | −2,60 | ||||
| 2025-08-04 | 13F | Integrity Alliance, Llc. | 11 935 | 0,81 | 82 | −2,41 | ||||
| 2025-07-14 | 13F | UMA Financial Services, Inc. | 175 | 1 | ||||||
| 2025-08-08 | 13F | Foundations Investment Advisors, LLC | 29 465 | 0,03 | 202 | −2,90 | ||||
| 2025-08-06 | 13F | Ethos Financial Group, LLC | 28 212 | 0,00 | 193 | −3,03 | ||||
| 2025-08-13 | 13F | Northwestern Mutual Wealth Management Co | 7 275 | 0,00 | 50 | −3,92 | ||||
| 2025-08-14 | 13F | Two Sigma Investments, Lp | 928 171 | −4,01 | 6 349 | −6,61 | ||||
| 2025-08-15 | 13F | Great West Life Assurance Co /can/ | 67 685 | 6,55 | 0 | |||||
| 2025-08-11 | 13F | Universal- Beteiligungs- und Servicegesellschaft mbH | 348 800 | 0,00 | 2 386 | −2,73 | ||||
| 2025-07-22 | 13F | Sage Investment Counsel LLC | 17 000 | −15,00 | 116 | −17,14 | ||||
| 2025-07-16 | 13F | Meridian Investment Counsel Inc. | 45 200 | −2,16 | 309 | −4,63 | ||||
| 2025-08-08 | 13F | Fortis Group Advisors, LLC | 523 | 0,00 | 4 | 0,00 | ||||
| 2025-07-08 | 13F | Parallel Advisors, LLC | 11 199 | −5,04 | 77 | −7,32 | ||||
| 2025-07-31 | 13F | Catalyst Capital Advisors LLC | 68 210 | 0,00 | 467 | −2,71 |