Grundläggande statistik
| Institutionella ägare | 163 total, 163 long only, 0 short only, 0 long/short - change of −1,81% MRQ |
| Genomsnittlig portföljallokering | 0.0514 % - change of −2,98% MRQ |
| Institutionella aktier (lång) | 10 540 940 (ex 13D/G) - change of −0,07MM shares −0,62% MRQ |
| Institutionellt värde (lång) | $ 143 851 USD ($1000) |
Institutionellt ägande och aktieägare
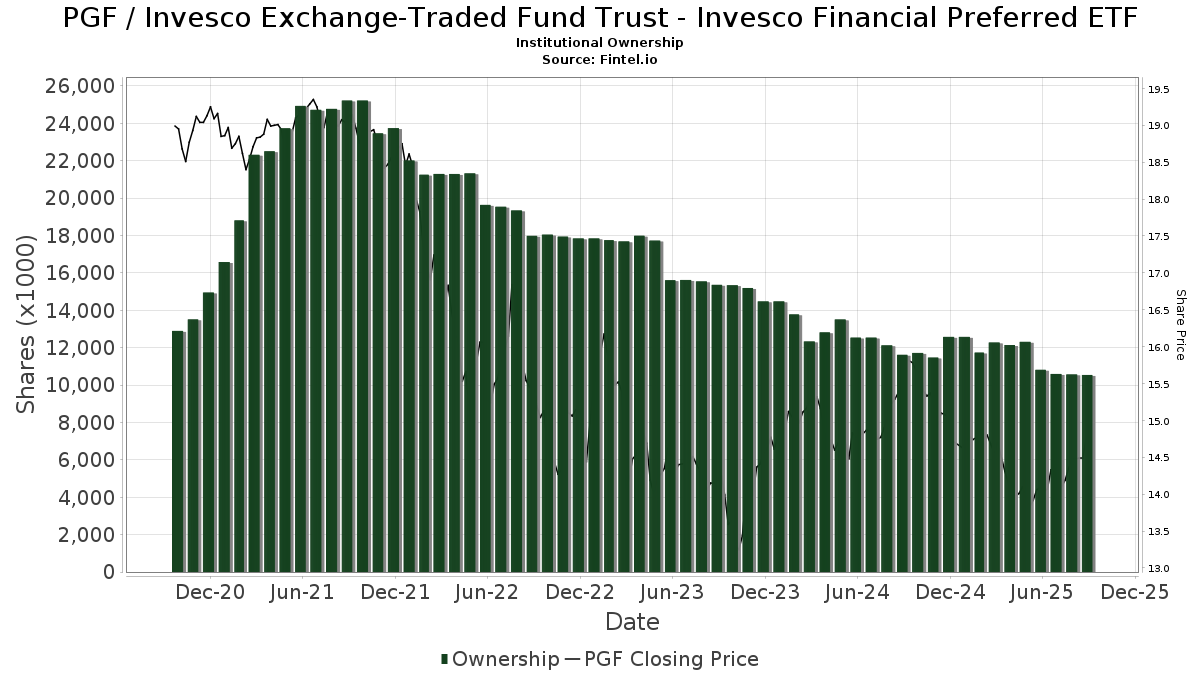
Invesco Exchange-Traded Fund Trust - Invesco Financial Preferred ETF (US:PGF) har 163 Institutionella ägare och aktieägare som har lämnat in 13D/G- eller 13F-formulär till Securities Exchange Commission (SEC). Dessa institut innehar totalt 10,540,940 aktier. Största aktieägare inkluderar Morgan Stanley, UBS Group AG, LPL Financial LLC, Wells Fargo & Company/mn, Bank Of America Corp /de/, Private Advisor Group, LLC, Evoke Wealth, Llc, North Star Investment Management Corp., Investors Research Corp, and Orion Portfolio Solutions, LLC .
Invesco Exchange-Traded Fund Trust - Invesco Financial Preferred ETF (ARCA:PGF) Institutionell ägarstruktur visar institutioners och fonders nuvarande positioner i företaget, samt de senaste förändringarna i positionernas storlek. Större aktieägare kan vara enskilda investerare, fonder, hedgefonder eller institutioner. Bilaga 13D visar att investeraren äger (eller ägde) mer än 5% av företaget och avser (eller avsåg) att aktivt eftersträva en förändring av affärsstrategin. Schedule 13G indikerar en passiv investering på över 5%.
The share price as of September 8, 2025 is 14,78 / share. Previously, on September 9, 2024, the share price was 15,50 / share. This represents a decline of 4,65% over that period.
Fondsentimentets poäng
Fondsentimentet poängen(fka Ägarackumulation-poäng) visar vilka aktier som är mest köpta av fonder. Det är resultatet av en sofistikerad kvantitativ flerfaktormodell som identifierar företag med de högsta nivåerna av institutionell ackumulering. Poängsättningsmodellen använder en kombination av den totala ökningen av redovisade ägare, förändringarna i portföljallokeringarna för dessa ägare och andra mått. Siffran sträcker sig från 0 till 100, där högre siffror indikerar en högre nivå av ackumulering i förhållande till sina konkurrenter, och 50 är genomsnittet.
Uppdateringsfrekvens: Dagligen
Se Ownership Explorer, som innehåller en lista över de högst rankade företagen.
Institutionell sälj/köp-kvot
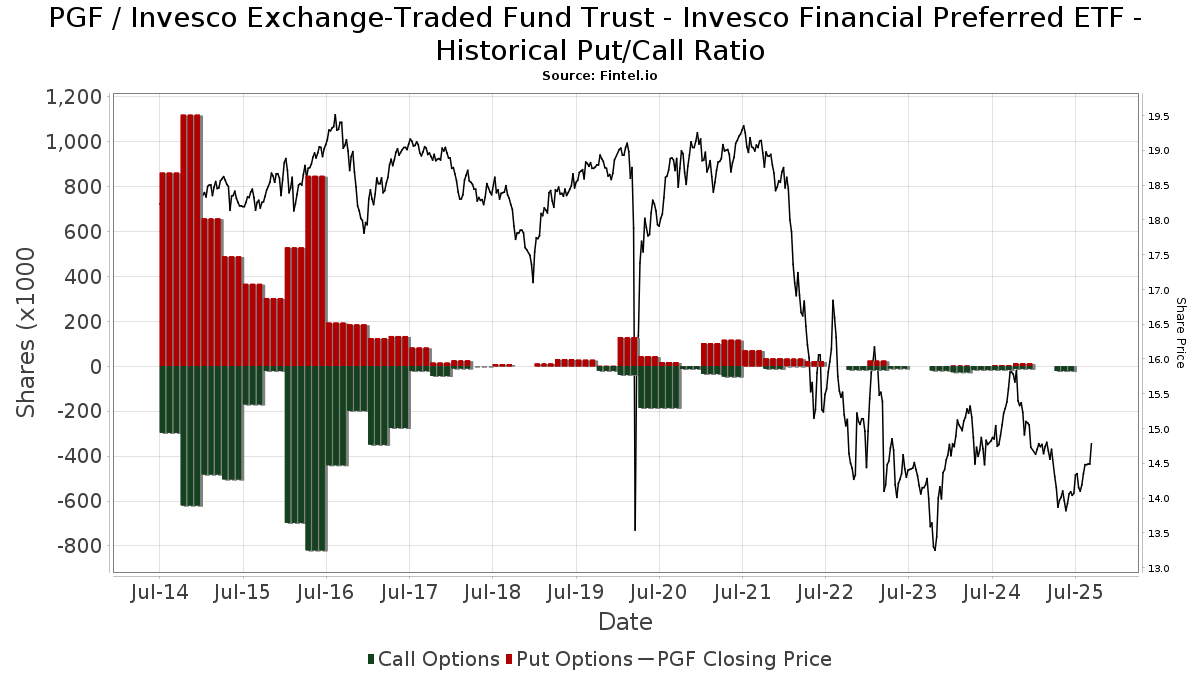
Förutom att rapportera vanliga eget kapital- och skuldemissioner måste institutioner med mer än 100MM tillgångar under förvaltning också avslöja sina innehav av sälj- och köpoptioner. Eftersom säljoptioner i allmänhet indikerar ett negativt sentiment och köpoptioner indikerar ett positivt sentiment, kan vi få en uppfattning om det övergripande institutionella sentimentet genom att plotta förhållandet mellan säljoptioner och köpoptioner. Diagrammet till höger visar det historiska förhållandet mellan sälj- och köpoptioner för detta instrument.
Genom att använda sälj/köp-kvoten som en indikator på aktieägarnas sentiment undviker man en av de största bristerna med att använda det totala institutionella ägandet, nämligen att en betydande del av de förvaltade tillgångarna investeras passivt för att följa index. Passivt förvaltade fonder köper vanligtvis inte optioner, så indikatorn för sälj/köp-kvoten ger en bättre bild av stämningen i aktivt förvaltade fonder.
13F- och NPORT-arkiveringar
Detaljer om 13F-arkiveringar är gratis. Detaljer om NP-arkiveringar kräver ett premiummedlemskap. Gröna rader indikerar nya positioner. Röda rader indikerar stängda positioner. Klicka på länk symbolen för att se hela transaktionshistoriken.
Uppgradera
för att låsa upp premiumdata och exportera till Excel ![]() .
.
| Fil Datum | Källa | Investerare | Typ | Genomsnittligt pris (beräknat) |
Aktier | Δ Aktier (%) |
Rapporterat värde (1000 USD) |
Δ Värde (%) |
Portföljallokering (%) |
|
|---|---|---|---|---|---|---|---|---|---|---|
| 2025-08-14 | 13F | Comerica Bank | 27 096 | −10,41 | 382 | −11,37 | ||||
| 2025-08-14 | 13F | Susquehanna International Group, Llp | 78 246 | 56,62 | 1 104 | 54,84 | ||||
| 2025-08-08 | 13F | Cetera Investment Advisers | 49 445 | −6,76 | 698 | −7,93 | ||||
| 2025-08-15 | 13F | Kestra Advisory Services, LLC | 29 614 | 3,09 | 418 | 1,71 | ||||
| 2025-05-15 | 13F | Citadel Advisors Llc | 0 | −100,00 | 0 | −100,00 | ||||
| 2025-04-25 | 13F | Essex Financial Services, Inc. | 0 | −100,00 | 0 | |||||
| 2025-08-08 | 13F | Emerald Investment Partners, Llc | 145 | −88,92 | 2 | −88,89 | ||||
| 2025-08-12 | 13F | Global Retirement Partners, LLC | 300 | 0,00 | 4 | 0,00 | ||||
| 2025-08-11 | 13F | HighTower Advisors, LLC | 72 147 | 0,21 | 1 018 | −1,07 | ||||
| 2025-08-08 | 13F | Fiera Capital Corp | 17 275 | 0,00 | 244 | −1,22 | ||||
| 2025-07-22 | 13F | Wealthcare Advisory Partners LLC | 29 994 | 0,08 | 423 | −0,94 | ||||
| 2025-08-06 | 13F | Mcrae Capital Management Inc | 16 203 | 0,00 | 229 | −1,30 | ||||
| 2025-07-10 | 13F | Triangle Securities Wealth Management | 10 147 | −5,00 | 143 | −5,92 | ||||
| 2025-07-24 | 13F | IFP Advisors, Inc | 0 | −100,00 | 0 | −100,00 | ||||
| 2025-08-11 | 13F | Delta Asset Management Llc/tn | 124 | 0,00 | 2 | 0,00 | ||||
| 2025-08-12 | 13F | Ameritas Investment Partners, Inc. | 665 | 1,53 | 9 | 0,00 | ||||
| 2025-07-17 | 13F | Alpine Bank Wealth Management | 0 | −100,00 | 0 | |||||
| 2025-08-01 | 13F | Envestnet Asset Management Inc | 52 277 | −15,77 | 738 | −16,82 | ||||
| 2025-08-08 | 13F | Advisors Capital Management, LLC | 12 938 | 1,55 | 183 | 0,55 | ||||
| 2025-08-11 | 13F | Principal Securities, Inc. | 4 260 | −25,24 | 60 | −26,83 | ||||
| 2025-07-21 | 13F | Ameritas Advisory Services, LLC | 5 948 | 84 | ||||||
| 2025-08-13 | 13F | Northwestern Mutual Wealth Management Co | 15 366 | −14,17 | 217 | −15,29 | ||||
| 2025-07-11 | 13F | Farther Finance Advisors, LLC | 11 685 | 1,71 | 165 | 0,00 | ||||
| 2025-04-22 | 13F | Synergy Financial Management, LLC | 0 | −100,00 | 0 | |||||
| 2025-08-14 | 13F | Abbot Financial Management, Inc. | 13 792 | 0,12 | 195 | −1,02 | ||||
| 2025-07-24 | 13F | Blair William & Co/il | 150 | −88,89 | 2 | −89,47 | ||||
| 2025-09-04 | 13F/A | Advisor Group Holdings, Inc. | 88 414 | 12,50 | 1 248 | 11,14 | ||||
| 2025-07-18 | 13F | Rogco, Lp | 3 619 | 147,71 | 51 | 155,00 | ||||
| 2025-08-18 | 13F | Wolverine Trading, Llc | 0 | −100,00 | 0 | |||||
| 2025-08-12 | 13F | Prudential Plc | 3 900 | 0,00 | 55 | 0,00 | ||||
| 2025-05-14 | 13F | Guggenheim Capital Llc | 0 | −100,00 | 0 | |||||
| 2025-08-12 | 13F | Boreal Capital Management LLC | 5 846 | 82 | ||||||
| 2025-08-14 | 13F | Bank Of America Corp /de/ | 676 150 | 10,69 | 9 540 | 9,38 | ||||
| 2025-05-15 | 13F | Citadel Advisors Llc | Put | 0 | −100,00 | 0 | −100,00 | |||
| 2025-08-07 | 13F | McClarren Financial Advisors, Inc. | 0 | −100,00 | 0 | |||||
| 2025-08-14 | 13F | Wealth Preservation Advisors, LLC | 500 | 0,00 | 7 | 0,00 | ||||
| 2025-08-11 | 13F | Aptus Capital Advisors, LLC | 8 194 | 47,53 | 116 | 45,57 | ||||
| 2025-08-06 | 13F | Prospera Financial Services Inc | 101 268 | −0,88 | 1 429 | −2,12 | ||||
| 2025-04-21 | 13F | Nelson, Van Denburg & Campbell Wealth Management Group, LLC | 0 | −100,00 | 0 | |||||
| 2025-07-03 | 13F | City Center Advisors, LLC | 10 052 | 142 | ||||||
| 2025-04-25 | 13F | Westside Investment Management, Inc. | 0 | −100,00 | 0 | |||||
| 2025-07-08 | 13F | Nbc Securities, Inc. | 850 | 16,44 | 0 | |||||
| 2025-08-07 | 13F | Evoke Wealth, Llc | 318 111 | 5,72 | 4 489 | 4,47 | ||||
| 2025-07-21 | 13F | Matauro, Llc | 10 008 | 141 | ||||||
| 2025-08-04 | 13F | Spire Wealth Management | 0 | −100,00 | 0 | |||||
| 2025-08-12 | 13F | CIBC Private Wealth Group, LLC | 1 | 0,00 | 0 | |||||
| 2025-07-29 | 13F | Private Trust Co Na | 11 330 | 0,00 | 160 | −1,24 | ||||
| 2025-07-10 | 13F | Signal Advisors Wealth, LLC | 177 919 | 73,82 | 2 510 | 71,80 | ||||
| 2025-08-13 | 13F/A | StoneX Group Inc. | 0 | −100,00 | 0 | −100,00 | ||||
| 2025-08-14 | 13F | Jane Street Group, Llc | 0 | −100,00 | 0 | |||||
| 2025-07-14 | 13F | Wealth Advisory Solutions, LLC | 127 078 | 1,69 | 1 793 | 0,50 | ||||
| 2025-08-05 | 13F | Garrison Bradford & Associates Inc | 5 000 | 0,00 | 71 | −1,41 | ||||
| 2025-08-08 | 13F | WASHINGTON TRUST Co | 0 | −100,00 | 0 | |||||
| 2025-08-14 | 13F | UBS Group AG | 1 111 940 | 73,32 | 15 689 | 71,26 | ||||
| 2025-08-11 | 13F | Novak & Powell Financial Services, Inc. | 12 974 | −2,44 | 183 | −3,17 | ||||
| 2025-05-09 | 13F | GeoWealth Management, LLC | 0 | −100,00 | 0 | |||||
| 2025-08-12 | 13F | Jpmorgan Chase & Co | 6 | −86,05 | 0 | |||||
| 2025-05-15 | 13F | Bank Of America Corp /de/ | Call | 0 | −100,00 | 0 | −100,00 | |||
| 2025-08-05 | 13F | Dunhill Financial, LLC | 25 | 0,00 | 0 | |||||
| 2025-08-13 | 13F | Brown Advisory Inc | 13 758 | −37,06 | 194 | −37,82 | ||||
| 2025-08-12 | 13F | Running Point Capital Advisors, LLC | 8 506 | 9,67 | 120 | 9,09 | ||||
| 2025-07-29 | 13F | Stephens Inc /ar/ | 10 971 | −10,11 | 155 | −11,49 | ||||
| 2025-08-12 | 13F | Integrated Advisors Network LLC | 81 734 | −50,64 | 1 153 | −51,23 | ||||
| 2025-08-12 | 13F | Proequities, Inc. | 0 | 0 | ||||||
| 2025-07-09 | 13F | Byrne Asset Management LLC | 1 350 | 0,00 | 19 | 0,00 | ||||
| 2025-08-14 | 13F | Mariner, LLC | 0 | −100,00 | 0 | |||||
| 2025-07-31 | 13F | Optimum Investment Advisors | 1 350 | 0,00 | 19 | 0,00 | ||||
| 2025-07-17 | 13F | Independence Bank of Kentucky | 0 | −100,00 | 0 | |||||
| 2025-08-04 | 13F | Field & Main Bank | 106 852 | −0,29 | 1 508 | −1,50 | ||||
| 2025-07-17 | 13F | Sound Income Strategies, LLC | 178 | 0,00 | 3 | 0,00 | ||||
| 2025-08-13 | 13F | Rosenblum Silverman Sutton S F Inc /ca | 57 850 | 13,61 | 816 | 12,24 | ||||
| 2025-07-31 | 13F | Avory & Company, LLC | 30 990 | −24,56 | 437 | −25,43 | ||||
| 2025-08-01 | 13F | Motco | 2 700 | 39 | ||||||
| 2025-04-30 | 13F | M&t Bank Corp | 0 | −100,00 | 0 | |||||
| 2025-08-04 | 13F | Arkadios Wealth Advisors | 10 356 | 146 | ||||||
| 2025-08-13 | 13F | Jones Financial Companies Lllp | 30 904 | 0,67 | 435 | −1,36 | ||||
| 2025-08-06 | 13F | Wedbush Securities Inc | 13 827 | −38,69 | 0 | |||||
| 2025-08-04 | 13F | JDM Financial Group LLC | 1 805 | 1,52 | 25 | 0,00 | ||||
| 2025-07-31 | 13F/A | Avion Wealth | 9 063 | 0 | ||||||
| 2025-07-14 | 13F | Farmers & Merchants Investments Inc | 0 | −100,00 | 0 | |||||
| 2025-08-11 | 13F | Heritage Wealth Advisors | 484 | 0,00 | 7 | 0,00 | ||||
| 2025-08-26 | 13F/A | Thrivent Financial For Lutherans | 16 522 | 0 | ||||||
| 2025-07-11 | 13F | Pinnacle Bancorp, Inc. | 1 000 | 0,00 | 14 | 0,00 | ||||
| 2025-07-30 | 13F | Rehmann Capital Advisory Group | 16 838 | 31,34 | 238 | 29,51 | ||||
| 2025-08-12 | 13F | Maripau Wealth Management Llc | 58 141 | 50,63 | 823 | 49,18 | ||||
| 2025-08-08 | 13F | Capital Investment Advisory Services, LLC | 562 | 1,63 | 8 | 0,00 | ||||
| 2025-08-06 | 13F | AE Wealth Management LLC | 2 350 | −2,97 | 33 | −2,94 | ||||
| 2025-07-28 | 13F | Cushing Capital Partners, LLC | 43 862 | 8,07 | 619 | 6,74 | ||||
| 2025-07-10 | 13F | Wealth Enhancement Advisory Services, Llc | 52 779 | 10,14 | 755 | 10,38 | ||||
| 2025-08-04 | 13F | Assetmark, Inc | 14 | 0 | ||||||
| 2025-07-15 | 13F | North Star Investment Management Corp. | 286 523 | −1,22 | 4 043 | −2,39 | ||||
| 2025-07-18 | 13F | Bartlett & Co. Wealth Management Llc | 950 | 0,00 | 13 | 0,00 | ||||
| 2025-08-12 | 13F | SRS Capital Advisors, Inc. | 5 185 | −7,16 | 73 | −7,59 | ||||
| 2025-07-18 | 13F | Truist Financial Corp | 23 812 | −23,20 | 332 | −25,11 | ||||
| 2025-08-01 | 13F | Vision Financial Markets Llc | 4 000 | 0,00 | 56 | −1,75 | ||||
| 2025-08-13 | 13F | Quadrant Capital Group Llc | 0 | −100,00 | 0 | |||||
| 2025-08-14 | 13F | Oxford Financial Group Ltd | 252 | 1,61 | 4 | 0,00 | ||||
| 2025-08-14 | 13F | Kovitz Investment Group Partners, LLC | 15 350 | 217 | ||||||
| 2025-07-21 | 13F | Credential Securities Inc. | 0 | −100,00 | 0 | |||||
| 2025-08-18 | 13F | Geneos Wealth Management Inc. | 150 | 0,00 | 2 | 0,00 | ||||
| 2025-07-22 | 13F | Accel Wealth Management | 52 637 | −0,60 | 743 | −1,85 | ||||
| 2025-08-12 | 13F | Steward Partners Investment Advisory, Llc | 1 122 | 0,00 | 16 | −6,25 | ||||
| 2025-08-14 | 13F | Qube Research & Technologies Ltd | 439 | 0,00 | 6 | 0,00 | ||||
| 2025-08-14 | 13F | Dearborn Partners Llc | 17 647 | −3,97 | 249 | −5,34 | ||||
| 2025-07-22 | 13F | Financial Insights, Inc. | 10 000 | 0,00 | 141 | −0,70 | ||||
| 2025-08-11 | 13F | Private Advisor Group, LLC | 370 136 | −17,15 | 5 223 | −18,14 | ||||
| 2025-07-23 | 13F | Friedenthal Financial | 5 120 | 1,55 | 72 | 0,00 | ||||
| 2025-07-25 | 13F | Valley Brook Capital Group, Inc. | 12 600 | 0,00 | 178 | −1,12 | ||||
| 2025-07-28 | 13F | Duncker Streett & Co Inc | 272 | 0,00 | 4 | 0,00 | ||||
| 2025-07-24 | 13F | MSH Capital Advisors LLC | 10 566 | −2,72 | 149 | −3,87 | ||||
| 2025-08-11 | 13F | Rothschild Investment Llc | 1 169 | 0,00 | 16 | 0,00 | ||||
| 2025-08-08 | 13F | Capital Investment Counsel, Inc | 0 | −100,00 | 0 | |||||
| 2025-05-15 | 13F | Two Sigma Securities, Llc | 0 | −100,00 | 0 | −100,00 | ||||
| 2025-08-01 | 13F | Brinker Capital Investments, LLC | 0 | −100,00 | 0 | −100,00 | ||||
| 2025-08-18 | 13F/A | National Bank Of Canada /fi/ | 7 873 | 0,00 | 111 | −0,89 | ||||
| 2025-07-22 | 13F | Appleton Partners Inc/ma | 0 | −100,00 | 0 | |||||
| 2025-08-05 | 13F | Lord & Richards Wealth Management, LLC | 83 216 | 127,49 | 1 174 | 124,90 | ||||
| 2025-05-14 | 13F | Orion Portfolio Solutions, LLC | 185 065 | 0,00 | 2 134 | 0,00 | ||||
| 2025-07-21 | 13F | Empirical Financial Services, LLC d.b.a. Empirical Wealth Management | 0 | −100,00 | 0 | |||||
| 2025-07-31 | 13F | Cambridge Investment Research Advisors, Inc. | 83 919 | −6,19 | 1 | 0,00 | ||||
| 2025-07-10 | 13F | HF Advisory Group, LLC | 21 079 | 4,66 | 297 | 3,48 | ||||
| 2025-08-06 | 13F | Nvwm, Llc | 2 431 | 34 | ||||||
| 2025-05-14 | 13F | Van Hulzen Asset Management, LLC | 0 | −100,00 | 0 | −100,00 | ||||
| 2025-07-07 | 13F | Investors Research Corp | 275 264 | 11,99 | 3 884 | 10,66 | ||||
| 2025-08-19 | 13F | Cim, Llc | 29 181 | 0,00 | 412 | −1,20 | ||||
| 2025-07-29 | 13F | International Assets Investment Management, Llc | 77 042 | 9,38 | 1 087 | 8,16 | ||||
| 2025-08-12 | 13F | AlphaCore Capital LLC | 500 | 0,00 | 7 | 0,00 | ||||
| 2025-07-25 | 13F | Cwm, Llc | 276 | −72,97 | 0 | |||||
| 2025-04-03 | 13F | Central Pacific Bank - Trust Division | 0 | −100,00 | 0 | |||||
| 2025-05-12 | 13F | Founders Financial Alliance, LLC | 0 | −100,00 | 0 | |||||
| 2025-07-14 | 13F | Sowell Financial Services LLC | 49 229 | 0,10 | 695 | −1,14 | ||||
| 2025-07-25 | 13F | Concord Wealth Partners | 695 | 1,61 | 10 | 0,00 | ||||
| 2025-07-17 | 13F | Sterneck Capital Management, LLC | 120 520 | −0,18 | 1 701 | −1,39 | ||||
| 2025-08-14 | 13F | MGB Wealth Management, LLC | 27 764 | 0,00 | 392 | −1,26 | ||||
| 2025-07-22 | 13F | Kessler Investment Group, LLC | 1 508 | 0,00 | 21 | 0,00 | ||||
| 2025-08-14 | 13F | Wells Fargo & Company/mn | 820 396 | −0,28 | 11 576 | −1,47 | ||||
| 2025-08-04 | 13F | Integrity Alliance, Llc. | 14 638 | 4,33 | 207 | 3,00 | ||||
| 2025-08-06 | 13F | Commonwealth Equity Services, Llc | 92 725 | 1,35 | 1 | 0,00 | ||||
| 2025-08-14 | 13F | GWM Advisors LLC | 26 979 | 26,04 | 381 | 24,59 | ||||
| 2025-07-18 | 13F | Institute for Wealth Management, LLC. | 18 847 | −1,84 | 266 | −3,28 | ||||
| 2025-08-19 | 13F | Anchor Investment Management, LLC | 4 000 | 0,00 | 56 | −1,75 | ||||
| 2025-08-25 | 13F/A | Promus Capital, LLC | 2 117 | 0,00 | 30 | −3,33 | ||||
| 2025-08-04 | 13F | Premier Path Wealth Partners, LLC | 10 245 | 0,00 | 145 | −1,37 | ||||
| 2025-07-30 | 13F | Bogart Wealth, LLC | 1 060 | 0,00 | 15 | −6,67 | ||||
| 2025-07-31 | 13F | Richards, Merrill & Peterson, Inc. | 1 942 | 0,00 | 27 | 0,00 | ||||
| 2025-08-14 | 13F | Guardian Wealth Advisors, Llc / Nc | 2 881 | 9,92 | 41 | 8,11 | ||||
| 2025-08-14 | 13F | Ameriprise Financial Inc | 67 225 | 27,54 | 949 | 26,06 | ||||
| 2025-07-24 | 13F | Costello Asset Management, INC | 252 | 1,61 | 4 | 0,00 | ||||
| 2025-08-05 | 13F | Bank Of Montreal /can/ | 22 259 | −9,51 | 314 | −10,54 | ||||
| 2025-08-15 | 13F | Morgan Stanley | 1 707 295 | −7,94 | 24 090 | −9,04 | ||||
| 2025-07-16 | 13F | Leading Edge Financial Planning LLC | 14 572 | −13,24 | 206 | −14,23 | ||||
| 2025-07-07 | 13F | Thurston, Springer, Miller, Herd & Titak, Inc. | 325 | 0,00 | 5 | 0,00 | ||||
| 2025-07-29 | 13F | Ballast, Inc. | 20 276 | 286 | ||||||
| 2025-07-30 | 13F | D.a. Davidson & Co. | 76 101 | −1,97 | 1 074 | −3,16 | ||||
| 2025-05-15 | 13F | Creative Planning | 0 | −100,00 | 0 | |||||
| 2025-08-14 | 13F | Citadel Advisors Llc | Call | 21 100 | 298 | |||||
| 2025-05-12 | 13F | Independent Advisor Alliance | 0 | −100,00 | 0 | |||||
| 2025-08-07 | 13F | Palouse Capital Management, Inc. | 2 588 | 0,00 | 37 | 0,00 | ||||
| 2025-08-07 | 13F | Allworth Financial LP | 275 | 0,00 | 4 | 0,00 | ||||
| 2025-07-16 | 13F | Signaturefd, Llc | 0 | −100,00 | 0 | |||||
| 2025-07-31 | 13F | Oppenheimer & Co Inc | 22 860 | 0,43 | 323 | −0,92 | ||||
| 2025-08-04 | 13F | Joseph P. Lucia & Associates, LLC | 20 276 | 1,08 | 286 | 0,00 | ||||
| 2025-07-14 | 13F | GAMMA Investing LLC | 2 180 | 0,00 | 31 | −3,23 | ||||
| 2025-08-08 | 13F | ProVise Management Group, LLC | 25 042 | 0,00 | 353 | −1,12 | ||||
| 2025-08-14 | 13F | Royal Bank Of Canada | 159 796 | 13,67 | 2 254 | 12,20 | ||||
| 2025-08-15 | 13F | Captrust Financial Advisors | 54 914 | −0,60 | 775 | −1,78 | ||||
| 2025-08-13 | 13F | Alerus Financial Na | 1 000 | 14 | ||||||
| 2025-08-13 | 13F | Fort Sheridan Advisors Llc | 11 800 | −17,48 | 166 | −18,63 | ||||
| 2025-08-14 | 13F | Fmr Llc | 160 | 56,86 | 2 | 100,00 | ||||
| 2025-08-15 | 13F | Tower Research Capital LLC (TRC) | 65 | 1 | ||||||
| 2025-08-07 | 13F | Kestra Private Wealth Services, Llc | 15 585 | 0,00 | 220 | −1,35 | ||||
| 2025-05-15 | 13F | CAPROCK Group, Inc. | 26 218 | 0,00 | 374 | −1,84 | ||||
| 2025-08-12 | 13F | LPL Financial LLC | 975 225 | −21,47 | 13 760 | −22,40 | ||||
| 2025-07-30 | 13F | Eqis Capital Management, Inc. | 65 640 | −1,85 | 926 | −2,94 | ||||
| 2025-08-05 | 13F | Simplex Trading, Llc | 633 | 90,09 | 0 | |||||
| 2025-07-10 | 13F | Rfg Holdings, Inc. | 61 231 | −33,59 | 864 | −34,42 | ||||
| 2025-07-14 | 13F | Pacifica Partners Inc. | 447 | 0,00 | 6 | 0,00 | ||||
| 2025-08-08 | 13F | Citizens Financial Group Inc/ri | 17 950 | −14,94 | 253 | −15,95 | ||||
| 2025-07-17 | 13F | Park Place Capital Corp | 1 120 | 0,00 | 16 | 0,00 | ||||
| 2025-07-28 | 13F | Harbour Investments, Inc. | 2 415 | 0,00 | 34 | 0,00 | ||||
| 2025-05-23 | 13F | Twin Lakes Capital Management, LLC | 0 | −100,00 | 0 | |||||
| 2025-08-12 | 13F | MAI Capital Management | 21 962 | −4,71 | 310 | −6,08 | ||||
| 2025-08-14 | 13F | Ancora Advisors, LLC | 20 000 | 100,00 | 282 | 98,59 | ||||
| 2025-07-16 | 13F | Register Financial Advisors LLC | 2 104 | 1,54 | 30 | 0,00 | ||||
| 2025-07-17 | 13F | Walker Asset Management, LLC | 40 170 | −2,64 | 567 | −3,90 | ||||
| 2025-07-24 | 13F | Us Bancorp \de\ | 2 250 | 0,00 | 32 | −3,12 | ||||
| 2025-07-28 | 13F | Essex LLC | 20 200 | 0,00 | 285 | −1,04 | ||||
| 2025-08-08 | 13F | Symphony Financial Services, Inc. | 11 896 | −17,43 | 168 | −18,54 | ||||
| 2025-05-06 | 13F | Avantax Advisory Services, Inc. | 0 | −100,00 | 0 | |||||
| 2025-07-31 | 13F | LJI Wealth Management, LLC | 40 371 | −5,50 | 570 | −6,72 | ||||
| 2025-08-19 | 13F | National Asset Management, Inc. | 22 350 | 315 | ||||||
| 2025-07-17 | 13F/A | Capital Investment Advisors, LLC | 28 894 | −4,24 | 408 | −5,35 | ||||
| 2025-07-10 | 13F | Rockland Trust Co | 0 | −100,00 | 0 | |||||
| 2025-07-17 | 13F | Janney Montgomery Scott LLC | 28 333 | −0,74 | 0 | |||||
| 2025-07-17 | 13F | Western Financial Corp/CA | 21 960 | −0,00 | 310 | −1,28 | ||||
| 2025-08-05 | 13F | Huntington National Bank | 1 | 0,00 | 0 | |||||
| 2025-04-17 | 13F | Monticello Wealth Management, Llc | 0 | −100,00 | 0 | |||||
| 2025-08-14 | 13F | Mml Investors Services, Llc | 61 724 | −18,82 | 1 | −100,00 | ||||
| 2025-08-14 | 13F | Stifel Financial Corp | 148 560 | 0,07 | 2 096 | −1,09 | ||||
| 2025-07-09 | 13F | Fiduciary Alliance LLC | 13 267 | −37,32 | 187 | −38,08 | ||||
| 2025-07-16 | 13F | Magnus Financial Group LLC | 82 509 | 1,55 | 1 164 | 0,34 | ||||
| 2025-08-11 | 13F | SFI Advisors, LLC | 0 | −100,00 | 0 | |||||
| 2025-08-14 | 13F | Raymond James Financial Inc | 123 594 | −20,35 | 1 744 | −21,31 | ||||
| 2025-05-08 | 13F | We Are One Seven, LLC | 0 | −100,00 | 0 |