Grundläggande statistik
| Institutionella ägare | 190 total, 190 long only, 0 short only, 0 long/short - change of −1,55% MRQ |
| Genomsnittlig portföljallokering | 0.1041 % - change of −24,51% MRQ |
| Institutionella aktier (lång) | 38 368 024 (ex 13D/G) - change of −4,86MM shares −11,24% MRQ |
| Institutionellt värde (lång) | $ 773 809 USD ($1000) |
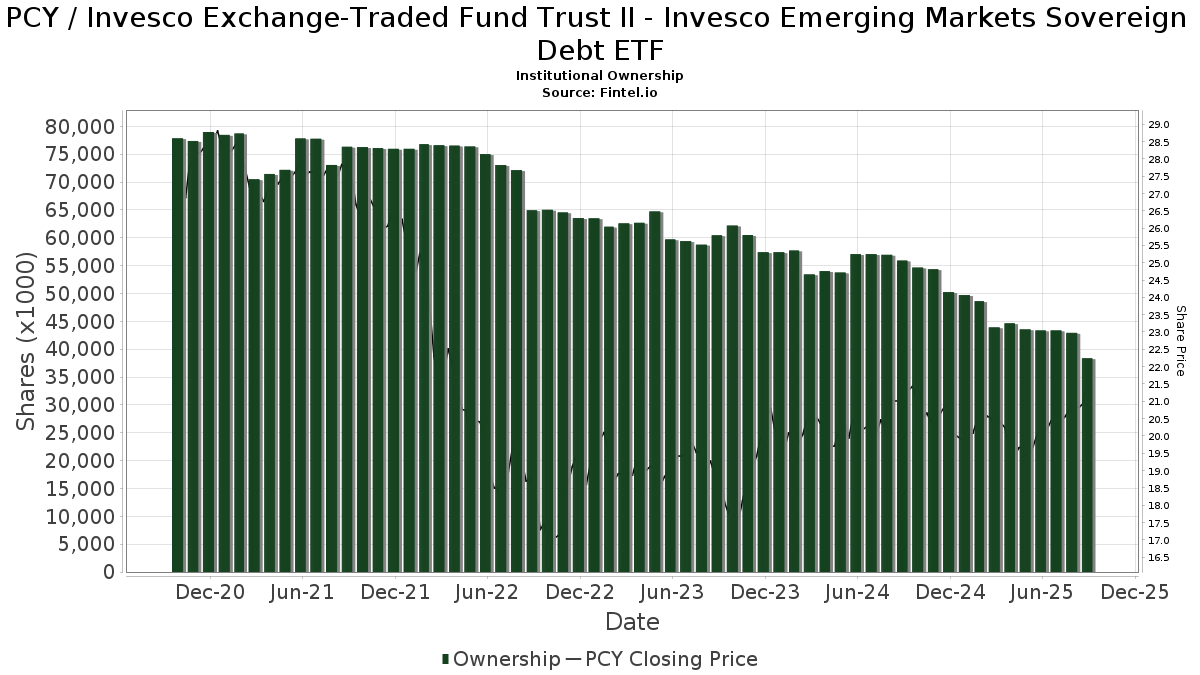
Institutionellt ägande och aktieägare
Invesco Exchange-Traded Fund Trust II - Invesco Emerging Markets Sovereign Debt ETF (US:PCY) har 190 Institutionella ägare och aktieägare som har lämnat in 13D/G- eller 13F-formulär till Securities Exchange Commission (SEC). Dessa institut innehar totalt 38,368,024 aktier. Största aktieägare inkluderar Bank Of America Corp /de/, Wells Fargo & Company/mn, Invesco Ltd., Syon Capital Llc, UBS Group AG, LPL Financial LLC, AIM GROWTH SERIES (INVESCO GROWTH SERIES) - Invesco Oppenheimer Portfolio Series: Moderate Investor Fund Class C, Wealth Enhancement Advisory Services, Llc, Raymond James Financial Inc, and Morgan Stanley .
Invesco Exchange-Traded Fund Trust II - Invesco Emerging Markets Sovereign Debt ETF (ARCA:PCY) Institutionell ägarstruktur visar institutioners och fonders nuvarande positioner i företaget, samt de senaste förändringarna i positionernas storlek. Större aktieägare kan vara enskilda investerare, fonder, hedgefonder eller institutioner. Bilaga 13D visar att investeraren äger (eller ägde) mer än 5% av företaget och avser (eller avsåg) att aktivt eftersträva en förändring av affärsstrategin. Schedule 13G indikerar en passiv investering på över 5%.
The share price as of September 19, 2025 is 21,63 / share. Previously, on September 20, 2024, the share price was 21,58 / share. This represents an increase of 0,23% over that period.
Fondsentimentets poäng
Fondsentimentet poängen(fka Ägarackumulation-poäng) visar vilka aktier som är mest köpta av fonder. Det är resultatet av en sofistikerad kvantitativ flerfaktormodell som identifierar företag med de högsta nivåerna av institutionell ackumulering. Poängsättningsmodellen använder en kombination av den totala ökningen av redovisade ägare, förändringarna i portföljallokeringarna för dessa ägare och andra mått. Siffran sträcker sig från 0 till 100, där högre siffror indikerar en högre nivå av ackumulering i förhållande till sina konkurrenter, och 50 är genomsnittet.
Uppdateringsfrekvens: Dagligen
Se Ownership Explorer, som innehåller en lista över de högst rankade företagen.
AI+ Ask Fintel’s AI assistant about Invesco Exchange-Traded Fund Trust II - Invesco Emerging Markets Sovereign Debt ETF.
Thinking of good questions…
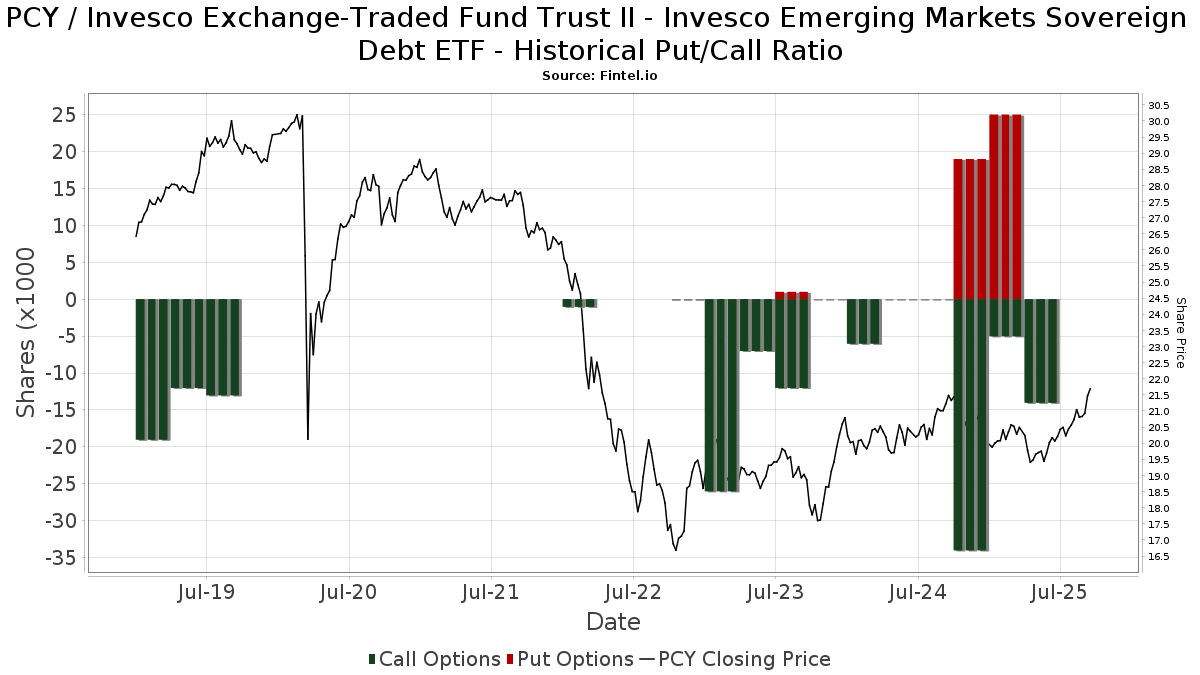
Institutionell sälj/köp-kvot
Förutom att rapportera vanliga eget kapital- och skuldemissioner måste institutioner med mer än 100MM tillgångar under förvaltning också avslöja sina innehav av sälj- och köpoptioner. Eftersom säljoptioner i allmänhet indikerar ett negativt sentiment och köpoptioner indikerar ett positivt sentiment, kan vi få en uppfattning om det övergripande institutionella sentimentet genom att plotta förhållandet mellan säljoptioner och köpoptioner. Diagrammet till höger visar det historiska förhållandet mellan sälj- och köpoptioner för detta instrument.
Genom att använda sälj/köp-kvoten som en indikator på aktieägarnas sentiment undviker man en av de största bristerna med att använda det totala institutionella ägandet, nämligen att en betydande del av de förvaltade tillgångarna investeras passivt för att följa index. Passivt förvaltade fonder köper vanligtvis inte optioner, så indikatorn för sälj/köp-kvoten ger en bättre bild av stämningen i aktivt förvaltade fonder.
13F- och NPORT-arkiveringar
Detaljer om 13F-arkiveringar är gratis. Detaljer om NP-arkiveringar kräver ett premiummedlemskap. Gröna rader indikerar nya positioner. Röda rader indikerar stängda positioner. Klicka på länk symbolen för att se hela transaktionshistoriken.
Uppgradera
för att låsa upp premiumdata och exportera till Excel ![]() .
.
| Fil Datum | Källa | Investerare | Typ | Genomsnittligt pris (beräknat) |
Aktier | Δ Aktier (%) |
Rapporterat värde (1000 USD) |
Δ Värde (%) |
Portföljallokering (%) |
|
|---|---|---|---|---|---|---|---|---|---|---|
| 2025-07-18 | 13F/A | MJT & Associates Financial Advisory Group, Inc. | 1 563 | 0,00 | 32 | 0,00 | ||||
| 2025-08-07 | 13F | Alliance Wealth Management Group | 250 641 | −2,37 | 5 121 | −1,12 | ||||
| 2025-08-14 | 13F | Ausdal Financial Partners, Inc. | 11 822 | 242 | ||||||
| 2025-07-17 | 13F | Janney Montgomery Scott LLC | 10 427 | 0 | ||||||
| 2025-08-12 | 13F | Founders Financial Alliance, LLC | 1 507 | 0,67 | 31 | 0,00 | ||||
| 2025-07-24 | 13F | Blair William & Co/il | 5 192 | −15,20 | 106 | −13,82 | ||||
| 2025-08-13 | 13F | Continuum Advisory, LLC | 0 | −100,00 | 0 | |||||
| 2025-08-14 | 13F/A | Bank Julius Baer & Co. Ltd, Zurich | 803 | −0,37 | 16 | 0,00 | ||||
| 2025-07-25 | 13F | NorthRock Partners, LLC | 140 | 0,00 | 3 | 0,00 | ||||
| 2025-05-14 | 13F | Oarsman Capital, Inc. | 0 | −100,00 | 0 | −100,00 | ||||
| 2025-08-04 | 13F | Spire Wealth Management | 117 | 0,00 | 2 | 0,00 | ||||
| 2025-08-07 | 13F | Verus Capital Partners, Llc | 34 998 | −4,47 | 715 | −3,12 | ||||
| 2025-08-14 | 13F | Arete Wealth Advisors, LLC | 10 435 | −3,25 | 0 | |||||
| 2025-07-10 | 13F | Stewardship Advisors, LLC | 20 487 | −0,30 | 419 | 0,97 | ||||
| 2025-08-14 | 13F | IHT Wealth Management, LLC | 11 243 | −0,43 | 230 | 0,88 | ||||
| 2025-08-14 | 13F | Warren Averett Asset Management, LLC | 312 664 | −1,44 | 6 388 | −0,17 | ||||
| 2025-07-09 | 13F | Dynamic Advisor Solutions LLC | 17 401 | 1,04 | 356 | 2,31 | ||||
| 2025-07-25 | 13F | Northwest Capital Management Inc | 170 | 0,00 | 3 | 0,00 | ||||
| 2025-08-12 | 13F | Archer Investment Corp | 308 | 0,00 | 6 | 0,00 | ||||
| 2025-08-14 | 13F | UBS Group AG | 935 115 | −67,85 | 19 104 | −67,44 | ||||
| 2025-07-25 | 13F | Cwm, Llc | 1 596 | 528,35 | 0 | |||||
| 2025-08-13 | 13F | Capital Analysts, Inc. | 0 | −100,00 | 0 | |||||
| 2025-08-14 | 13F | Peapack Gladstone Financial Corp | 0 | −100,00 | 0 | |||||
| 2025-05-06 | 13F | Venturi Wealth Management, LLC | 0 | −100,00 | 0 | |||||
| 2025-08-28 | NP | AIM GROWTH SERIES (INVESCO GROWTH SERIES) - Invesco Oppenheimer Portfolio Series: Active Allocation Fund Class R5 | 320 606 | −44,77 | 6 550 | −44,07 | ||||
| 2025-07-28 | 13F | Harbour Investments, Inc. | 965 | −3,50 | 20 | −5,00 | ||||
| 2025-08-01 | 13F | Boyd Watterson Asset Management Llc/oh | 0 | −100,00 | 0 | |||||
| 2025-07-30 | 13F | Cullen/frost Bankers, Inc. | 246 | 0,82 | 5 | 25,00 | ||||
| 2025-07-21 | 13F | Ameritas Advisory Services, LLC | 200 | 4 | ||||||
| 2025-07-25 | 13F | Total Clarity Wealth Management, Inc. | 33 786 | 52,69 | 690 | 57,53 | ||||
| 2025-08-05 | 13F | Westside Investment Management, Inc. | 198 | 0,00 | 4 | 33,33 | ||||
| 2025-08-11 | 13F | Aptus Capital Advisors, LLC | 602 | −41,72 | 12 | −40,00 | ||||
| 2025-08-13 | 13F | Virtue Capital Management, LLC | 0 | −100,00 | 0 | |||||
| 2025-07-10 | 13F | Rockland Trust Co | 16 581 | −0,71 | 339 | 0,60 | ||||
| 2025-07-24 | 13F | Mainstay Capital Management Llc /adv | 14 770 | 302 | ||||||
| 2025-09-04 | 13F/A | Advisor Group Holdings, Inc. | 101 058 | −23,80 | 2 065 | −22,84 | ||||
| 2025-08-14 | 13F | Comerica Bank | 7 526 | −9,10 | 154 | −7,83 | ||||
| 2025-07-07 | 13F | Thurston, Springer, Miller, Herd & Titak, Inc. | 164 | 0,00 | 3 | 0,00 | ||||
| 2025-08-18 | 13F | Geneos Wealth Management Inc. | 3 298 | −0,36 | 67 | 1,52 | ||||
| 2025-08-14 | 13F | Syon Capital Llc | 1 262 281 | −31,06 | 25 788 | −30,17 | ||||
| 2025-08-13 | 13F | Cerity Partners LLC | 76 196 | −0,21 | 1 557 | 1,04 | ||||
| 2025-07-30 | 13F/A | Old Point Trust & Financial Services N A | 64 | 0,00 | 1 | 0,00 | ||||
| 2025-08-12 | 13F | Bokf, Na | 0 | −100,00 | 0 | |||||
| 2025-07-11 | 13F | Farther Finance Advisors, LLC | 865 | −31,46 | 18 | −32,00 | ||||
| 2025-08-06 | 13F | AE Wealth Management LLC | 1 330 | −18,60 | 27 | −15,62 | ||||
| 2025-08-14 | 13F | Quantinno Capital Management LP | 22 594 | 83,78 | 462 | 86,64 | ||||
| 2025-05-13 | 13F | Sequent Planning LLC | 0 | −100,00 | 0 | |||||
| 2025-08-08 | 13F | Omega Financial Group, LLC | 86 738 | −6,34 | 1 772 | −5,09 | ||||
| 2025-08-13 | 13F | Congress Wealth Management LLC / DE / | 20 186 | −3,06 | 412 | 2 188,89 | ||||
| 2025-08-13 | 13F | Crabel Capital Management, LLC | 21 023 | 430 | ||||||
| 2025-08-11 | 13F | Tidemark, LLC | 611 | −29,04 | 12 | −29,41 | ||||
| 2025-08-12 | 13F | Choate Investment Advisors | 1 513 | 31 | ||||||
| 2025-08-15 | 13F | Morgan Stanley | 410 890 | −8,17 | 8 394 | −6,98 | ||||
| 2025-08-12 | 13F | Jpmorgan Chase & Co | 56 484 | −12,06 | 1 154 | −10,97 | ||||
| 2025-07-24 | 13F | IFP Advisors, Inc | 928 | −32,90 | 19 | −33,33 | ||||
| 2025-07-31 | 13F | Wealthfront Advisers Llc | 370 355 | −47,18 | 7 566 | −46,50 | ||||
| 2025-05-15 | 13F | D. E. Shaw & Co., Inc. | 0 | −100,00 | 0 | |||||
| 2025-07-03 | 13F | City Center Advisors, LLC | 20 856 | 13,97 | 426 | 15,45 | ||||
| 2025-07-17 | 13F | Global Trust Asset Management, LLC | 2 500 | 51 | ||||||
| 2025-08-12 | 13F | OneAscent Financial Services LLC | 26 387 | −0,49 | 1 | |||||
| 2025-08-14 | 13F | Mercer Global Advisors Inc /adv | 24 729 | −13,09 | 505 | −11,87 | ||||
| 2025-07-21 | 13F | Ameriflex Group, Inc. | 231 | 0,00 | 5 | 0,00 | ||||
| 2025-08-13 | 13F | Flow Traders U.s. Llc | 202 480 | 285,69 | 4 | 300,00 | ||||
| 2025-07-09 | 13F | Post Resch Tallon Group Inc. | 11 393 | 9,62 | 233 | 11,00 | ||||
| 2025-07-31 | 13F | Red Wave Investments LLC | 40 551 | −5,88 | 828 | −4,72 | ||||
| 2025-08-12 | 13F | PSI Advisors, LLC | 0 | −100,00 | 0 | |||||
| 2025-05-01 | 13F | Auour Investments LLC | 0 | −100,00 | 0 | |||||
| 2025-07-07 | 13F | First Community Trust Na | 500 | −50,00 | 10 | −50,00 | ||||
| 2025-08-14 | 13F | Royal Bank Of Canada | 75 140 | −5,42 | 1 535 | −4,18 | ||||
| 2025-08-14 | 13F | Wells Fargo & Company/mn | 2 174 504 | −0,10 | 44 425 | 1,18 | ||||
| 2025-08-14 | 13F | Jane Street Group, Llc | 403 322 | 230,95 | 8 240 | 235,19 | ||||
| 2025-07-28 | 13F | RFG Advisory, LLC | 111 352 | 5,71 | 2 275 | 7,06 | ||||
| 2025-07-25 | 13F | Concurrent Investment Advisors, LLC | 24 566 | 15,92 | 502 | 17,33 | ||||
| 2025-08-04 | 13F | Simon Quick Advisors, Llc | 76 125 | 1 555 | ||||||
| 2025-07-16 | 13F | Perigon Wealth Management, LLC | 14 806 | −48,96 | 302 | −48,38 | ||||
| 2025-08-08 | 13F | Pnc Financial Services Group, Inc. | 5 826 | −3,70 | 119 | −2,46 | ||||
| 2025-08-13 | 13F | Jones Financial Companies Lllp | 24 386 | 26,00 | 494 | 27,32 | ||||
| 2025-07-10 | 13F | Oliver Lagore Vanvalin Investment Group | 80 931 | 1,35 | 1 632 | 3,16 | ||||
| 2025-08-14 | 13F | CoreCap Advisors, LLC | 583 | −99,61 | 12 | −99,64 | ||||
| 2025-08-11 | 13F | Citigroup Inc | 338 936 | −11,44 | 6 924 | −10,30 | ||||
| 2025-07-17 | 13F | Sound Income Strategies, LLC | 4 171 | −14,09 | 85 | −12,37 | ||||
| 2025-08-12 | 13F | CIBC Private Wealth Group, LLC | 4 850 | 0,00 | 99 | 8,79 | ||||
| 2025-08-28 | NP | AIM GROWTH SERIES (INVESCO GROWTH SERIES) - Invesco Oppenheimer Portfolio Series: Moderate Investor Fund Class C | 514 964 | −42,17 | 10 521 | −41,42 | ||||
| 2025-05-07 | 13F | Objective Capital Management, LLC | 0 | −100,00 | 0 | −100,00 | ||||
| 2025-08-13 | 13F | Twin Peaks Wealth Advisors, LLC | 1 | 0 | ||||||
| 2025-08-14 | 13F | Murphy & Mullick Capital Management Corp | 10 432 | −31,31 | 214 | −30,07 | ||||
| 2025-07-21 | 13F | DHJJ Financial Advisors, Ltd. | 0 | −100,00 | 0 | |||||
| 2025-08-11 | 13F | Principal Securities, Inc. | 251 | 0,00 | 5 | 25,00 | ||||
| 2025-08-28 | NP | AIM GROWTH SERIES (INVESCO GROWTH SERIES) - Invesco Oppenheimer Portfolio Series: Growth Investor Fund Class R6 | 69 719 | −43,70 | 1 424 | −42,97 | ||||
| 2025-07-22 | 13F | Simplicity Wealth,LLC | 0 | −100,00 | 0 | |||||
| 2025-08-14 | 13F | GWM Advisors LLC | 4 360 | 1,44 | 89 | 3,49 | ||||
| 2025-08-28 | NP | CMAIX - Invesco Conservative Allocation Fund CLASS R5 | 123 538 | −37,63 | 2 524 | −36,85 | ||||
| 2025-05-13 | 13F | Kepos Capital LP | 0 | −100,00 | 0 | |||||
| 2025-08-14 | 13F/A | Rockefeller Capital Management L.P. | 37 235 | 84,95 | 761 | 87,19 | ||||
| 2025-08-11 | 13F | Cornerstone Planning Group LLC | 41 | 0,00 | 1 | |||||
| 2025-08-05 | 13F | EPG Wealth Management LLC | 0 | −100,00 | 0 | |||||
| 2025-06-30 | NP | AIM INVESTMENT FUNDS (INVESCO INVESTMENT FUNDS) - Invesco Oppenheimer Global Allocation Fund Class R | 383 000 | 0,00 | 7 530 | −2,25 | ||||
| 2025-07-28 | NP | FXED - Sound Enhanced Fixed Income ETF | 42 637 | 1,12 | 844 | −3,21 | ||||
| 2025-08-06 | 13F | Commonwealth Equity Services, Llc | 32 372 | −53,18 | 1 | −100,00 | ||||
| 2025-07-11 | 13F | Annex Advisory Services, LLC | 0 | −100,00 | 0 | |||||
| 2025-08-04 | 13F | Pensionmark Financial Group, Llc | 59 708 | 5,17 | 1 220 | 6,46 | ||||
| 2025-08-12 | 13F | Proequities, Inc. | 0 | 0 | ||||||
| 2025-08-05 | 13F | Fourth Dimension Wealth, LLC | 931 | −41,63 | 19 | −40,62 | ||||
| 2025-07-31 | 13F | Sharper & Granite LLC | 91 935 | 1,89 | 1 878 | 3,24 | ||||
| 2025-05-15 | 13F | Ashton Thomas Securities, Llc | 0 | −100,00 | 0 | |||||
| 2025-08-04 | 13F | Creative Financial Designs Inc /adv | 90 | 0,00 | 2 | 0,00 | ||||
| 2025-07-23 | 13F | Dohj, Llc | 0 | −100,00 | 0 | |||||
| 2025-08-04 | 13F | Wolverine Asset Management Llc | 15 092 | 308 | ||||||
| 2025-05-19 | 13F/A | Kovitz Investment Group Partners, LLC | 0 | −100,00 | 0 | −100,00 | ||||
| 2025-08-28 | NP | AIM GROWTH SERIES (INVESCO GROWTH SERIES) - Invesco Oppenheimer Portfolio Series: Conservative Investor Fund Class R6 | 229 100 | −37,02 | 4 681 | −36,21 | ||||
| 2025-07-31 | 13F | City State Bank | 10 250 | 0,00 | 209 | 1,46 | ||||
| 2025-08-15 | 13F | WFA of San Diego, LLC | 15 728 | 674,78 | 321 | 646,51 | ||||
| 2025-08-11 | 13F | Private Advisor Group, LLC | 48 188 | 3,00 | 984 | 4,35 | ||||
| 2025-07-30 | 13F | Clune & Associates, Ltd. | 13 035 | 0,18 | 266 | 1,53 | ||||
| 2025-08-14 | 13F | Integrated Wealth Concepts LLC | 0 | −100,00 | 0 | |||||
| 2025-08-14 | 13F | Sunbelt Securities, Inc. | 5 | 0,00 | 0 | |||||
| 2025-05-15 | 13F | Proquility Private Wealth Partners, LLC | 72 283 | 1 458 | ||||||
| 2025-08-12 | 13F | SRS Capital Advisors, Inc. | 1 | 0 | ||||||
| 2025-08-18 | 13F/A | National Bank Of Canada /fi/ | 109 393 | 0,89 | 2 234 | 2,20 | ||||
| 2025-07-22 | 13F | Net Worth Advisory Group | 28 397 | 1,87 | 580 | 3,20 | ||||
| 2025-05-06 | 13F | Advisors Preferred, LLC | 0 | −100,00 | 0 | |||||
| 2025-08-14 | 13F | Citadel Advisors Llc | Put | 0 | −100,00 | 0 | ||||
| 2025-08-14 | 13F | Qube Research & Technologies Ltd | 2 558 | 52 | ||||||
| 2025-08-04 | 13F | Assetmark, Inc | 82 | 1,23 | 2 | 0,00 | ||||
| 2025-07-28 | 13F | Duncker Streett & Co Inc | 14 750 | 0,00 | 301 | 1,35 | ||||
| 2025-07-25 | 13F | Concord Wealth Partners | 3 017 | −6,59 | 62 | −6,15 | ||||
| 2025-08-14 | 13F | Mml Investors Services, Llc | 44 776 | 0,63 | 1 | |||||
| 2025-08-04 | 13F | Center for Financial Planning, Inc. | 17 | 0,00 | 0 | |||||
| 2025-05-14 | 13F | Renaissance Technologies Llc | 0 | −100,00 | 0 | |||||
| 2025-07-24 | 13F | Zullo Investment Group, Inc. | 10 388 | 1,96 | 212 | 3,41 | ||||
| 2025-07-10 | 13F | Wealth Enhancement Advisory Services, Llc | 456 200 | −11,57 | 9 357 | −10,08 | ||||
| 2025-07-25 | 13F | Atria Wealth Solutions, Inc. | 0 | −100,00 | 0 | |||||
| 2025-08-18 | 13F | Hollencrest Capital Management | 37 | 0,00 | 1 | |||||
| 2025-07-08 | 13F | Parallel Advisors, LLC | 5 | 0 | ||||||
| 2025-04-21 | 13F | Nelson, Van Denburg & Campbell Wealth Management Group, LLC | 0 | −100,00 | 0 | |||||
| 2025-08-13 | 13F | Blue Fin Capital, Inc. | 25 348 | −0,29 | 518 | 2,78 | ||||
| 2025-07-23 | 13F | Friedenthal Financial | 11 062 | −0,41 | 226 | 0,45 | ||||
| 2025-08-18 | 13F | Front Row Advisors LLC | 475 | −21,49 | 10 | −25,00 | ||||
| 2025-07-10 | 13F | Worth Asset Management, LLC | 0 | −100,00 | 0 | |||||
| 2025-07-30 | 13F | Wbh Advisory Inc | 25 683 | −2,42 | 525 | −1,13 | ||||
| 2025-07-24 | 13F | Ronald Blue Trust, Inc. | 211 | 21,26 | 4 | 33,33 | ||||
| 2025-07-16 | 13F | Legend Financial Advisors, Inc. | 17 | 0 | ||||||
| 2025-07-17 | 13F | Wagner Wealth Management, Llc | 68 | 3,03 | 1 | 0,00 | ||||
| 2025-08-11 | 13F | Delta Asset Management Llc/tn | 598 | 0,00 | 12 | 0,00 | ||||
| 2025-08-14 | 13F | Boston Private Wealth Llc | 0 | −100,00 | 0 | |||||
| 2025-08-11 | 13F | Strategic Wealth Partners, Ltd. | 77 | 2 | ||||||
| 2025-08-11 | 13F | Wealthspire Advisors, LLC | 23 846 | −7,75 | 487 | −6,53 | ||||
| 2025-07-22 | 13F | Coastal Investment Advisors, Inc. | 568 | −27,37 | 12 | −26,67 | ||||
| 2025-07-14 | 13F | Sowell Financial Services LLC | 33 346 | 1,97 | 681 | 3,34 | ||||
| 2025-07-23 | 13F | WestEnd Advisors, LLC | 18 | 0 | ||||||
| 2025-08-14 | 13F | Citadel Advisors Llc | 0 | −100,00 | 0 | |||||
| 2025-08-05 | 13F | Mission Wealth Management, Lp | 40 924 | −11,96 | 836 | −10,78 | ||||
| 2025-08-13 | 13F | First Trust Advisors Lp | 18 890 | 0,71 | 386 | 1,85 | ||||
| 2025-08-13 | 13F | RPg Family Wealth Advisory, LLC | 15 265 | −4,65 | 312 | −3,42 | ||||
| 2025-08-12 | 13F | Global Retirement Partners, LLC | 142 | 12,70 | 3 | 0,00 | ||||
| 2025-07-30 | 13F | Fairway Wealth LLC | 0 | −100,00 | 0 | |||||
| 2025-08-11 | 13F | Greykasell Wealth Strategies, Inc. | 0 | −100,00 | 0 | |||||
| 2025-08-07 | 13F | Allworth Financial LP | 1 006 | 11,16 | 21 | 17,65 | ||||
| 2025-08-28 | NP | AADAX - INVESCO Growth Allocation Fund Class A | 165 990 | −42,99 | 3 391 | −42,25 | ||||
| 2025-08-05 | 13F | Towercrest Capital Management | 264 590 | −2,38 | 5 406 | −1,13 | ||||
| 2025-08-14 | 13F | Raymond James Financial Inc | 418 211 | −0,23 | 8 544 | 1,06 | ||||
| 2025-08-07 | 13F | Winthrop Capital Management, LLC | 292 | 0,00 | 0 | |||||
| 2025-08-14 | 13F | Citadel Advisors Llc | Call | 14 200 | 149,12 | 290 | 154,39 | |||
| 2025-08-07 | 13F | Cypress Capital Management LLC (WY) | 80 | 2 | ||||||
| 2025-08-14 | 13F | Bnp Paribas Arbitrage, Sa | 3 252 | −6,34 | 66 | −5,71 | ||||
| 2025-08-19 | 13F | Cape Investment Advisory, Inc. | 859 | 1,66 | 18 | 0,00 | ||||
| 2025-08-12 | 13F | Steward Partners Investment Advisory, Llc | 17 939 | −2,77 | 366 | −1,61 | ||||
| 2025-07-18 | 13F | SOA Wealth Advisors, LLC. | 1 211 | 1,68 | 25 | 0,00 | ||||
| 2025-07-28 | 13F | Kiker Wealth Management, LLC | 68 | 0,00 | 1 | 0,00 | ||||
| 2025-07-23 | 13F | Vontobel Holding Ltd. | 356 139 | −10,18 | 7 276 | −9,03 | ||||
| 2025-08-05 | 13F | Bank of New York Mellon Corp | 31 810 | 0,66 | 650 | 1,88 | ||||
| 2025-07-25 | 13F | Endowment Wealth Management, Inc. | 51 328 | 12,93 | 1 049 | 14,41 | ||||
| 2025-07-29 | 13F | Salomon & Ludwin, LLC | 405 | 3,58 | 8 | 14,29 | ||||
| 2025-08-13 | 13F | Northwestern Mutual Wealth Management Co | 10 116 | −3,68 | 207 | −2,37 | ||||
| 2025-05-16 | 13F | Coppell Advisory Solutions LLC | 0 | −100,00 | 0 | |||||
| 2025-07-14 | 13F | Abacus Wealth Partners, LLC | 9 826 | 201 | ||||||
| 2025-07-15 | 13F | Fifth Third Bancorp | 71 428 | −6,15 | 1 459 | −4,95 | ||||
| 2025-04-29 | 13F | Capital Investment Advisory Services, LLC | 0 | −100,00 | 0 | |||||
| 2025-08-05 | 13F | Prosperity Consulting Group, LLC | 39 983 | −3,90 | 817 | −2,74 | ||||
| 2025-06-02 | 13F/A | Modern Wealth Management, LLC | 12 812 | 0,00 | 258 | −0,77 | ||||
| 2025-08-01 | 13F | Envestnet Asset Management Inc | 149 841 | −28,94 | 3 061 | −28,03 | ||||
| 2025-08-14 | 13F | Old Mission Capital Llc | 0 | −100,00 | 0 | |||||
| 2025-08-14 | 13F | Bank Of America Corp /de/ | 21 234 203 | 0,89 | 433 815 | 2,19 | ||||
| 2025-08-12 | 13F | MAI Capital Management | 9 591 | −3,76 | 196 | −2,99 | ||||
| 2025-07-25 | 13F | Sequoia Financial Advisors, LLC | 20 701 | −3,96 | 423 | −2,76 | ||||
| 2025-08-13 | 13F | Fortress Financial Solutions, LLC | 23 162 | 3,42 | 473 | 4,88 | ||||
| 2025-08-14 | 13F | Evergreen Capital Management Llc | 286 765 | −0,56 | 5 859 | 0,72 | ||||
| 2025-08-14 | 13F | Stifel Financial Corp | 87 548 | −2,59 | 1 789 | −1,32 | ||||
| 2025-08-13 | 13F | Transce3nd, LLC | 69 | 0,00 | 1 | 0,00 | ||||
| 2025-08-15 | 13F | Kestra Advisory Services, LLC | 13 444 | −18,49 | 275 | −17,47 | ||||
| 2025-07-30 | 13F | Whittier Trust Co Of Nevada Inc | 0 | −100,00 | 0 | |||||
| 2025-08-04 | 13F | Clear Investment Research, Llc | 4 | 0,00 | 0 | |||||
| 2025-07-30 | 13F | Legacy Wealth Asset Management, LLC | 34 830 | 0,29 | 712 | 1,57 | ||||
| 2025-07-29 | 13F | Ballast, Inc. | 9 885 | 202 | ||||||
| 2025-08-14 | 13F | Ameriprise Financial Inc | 330 468 | −0,42 | 6 725 | 0,36 | ||||
| 2025-08-19 | 13F | Advisory Services Network, LLC | 19 268 | 396 | ||||||
| 2025-08-15 | 13F | Asset Allocation Strategies LLC | 22 559 | −73,55 | 461 | −73,26 | ||||
| 2025-08-14 | 13F | Hrt Financial Lp | 0 | −100,00 | 0 | |||||
| 2025-04-22 | 13F | Synergy Financial Management, LLC | 0 | −100,00 | 0 | |||||
| 2025-07-28 | 13F | Rosenberg Matthew Hamilton | 7 834 | −13,92 | 160 | −12,57 | ||||
| 2025-08-04 | 13F | Joseph P. Lucia & Associates, LLC | 9 885 | −1,89 | 202 | −0,99 | ||||
| 2025-08-14 | 13F | Betterment LLC | 117 997 | 168,38 | 2 | |||||
| 2025-08-14 | 13F | Mariner, LLC | 64 071 | 10,33 | 1 309 | 11,70 | ||||
| 2025-08-05 | 13F | Key FInancial Inc | 300 | 0,00 | 6 | 0,00 | ||||
| 2025-07-11 | 13F | Seacrest Wealth Management, Llc | 186 670 | 254,47 | 3 814 | 259,04 | ||||
| 2025-08-12 | 13F | LPL Financial LLC | 719 257 | 5,09 | 14 694 | 6,45 | ||||
| 2025-08-13 | 13F | MONECO Advisors, LLC | 131 530 | −4,17 | 2 687 | −2,93 | ||||
| 2025-07-31 | 13F | Cambridge Investment Research Advisors, Inc. | 21 884 | −1,40 | 0 | |||||
| 2025-04-28 | 13F | Mainstream Capital Management LLC | 0 | −100,00 | 0 | |||||
| 2025-08-05 | 13F | Sigma Planning Corp | 0 | −100,00 | 0 | |||||
| 2025-07-15 | 13F | Mather Group, Llc. | 0 | −100,00 | 0 | |||||
| 2025-08-14 | 13F | Susquehanna International Group, Llp | 94 629 | 6,41 | 1 933 | 7,81 | ||||
| 2025-07-09 | 13F | Breakwater Investment Management | 2 230 | −52,90 | 46 | −52,63 | ||||
| 2025-08-05 | 13F | Bank Of Montreal /can/ | 1 000 | 0,00 | 20 | 0,00 | ||||
| 2025-07-15 | 13F | Td Private Client Wealth Llc | 378 | 6,48 | 8 | 0,00 | ||||
| 2025-07-11 | 13F | Great Waters Wealth Management | 24 110 | −5,75 | 493 | −4,47 | ||||
| 2025-07-17 | 13F | Flywheel Private Wealth LLC | 13 926 | −0,06 | 285 | 1,07 | ||||
| 2025-05-12 | 13F | Independent Advisor Alliance | 0 | −100,00 | 0 | |||||
| 2025-07-30 | 13F | Probity Advisors, Inc. | 83 498 | −8,60 | 1 706 | −7,44 | ||||
| 2025-08-12 | 13F | O'shaughnessy Asset Management, Llc | 15 | −65,12 | 0 | |||||
| 2025-07-21 | 13F | HighMark Wealth Management LLC | 48 | 1 | ||||||
| 2025-08-15 | 13F | Tower Research Capital LLC (TRC) | 213 | −80,48 | 4 | −81,82 | ||||
| 2025-08-13 | 13F | Invesco Ltd. | 2 086 761 | −33,29 | 42 633 | −32,43 | ||||
| 2025-07-23 | 13F | SGL Investment Advisors, Inc. | 12 558 | 13,20 | 254 | 17,05 | ||||
| 2025-08-08 | 13F | Cetera Investment Advisers | 29 945 | −0,31 | 612 | 0,99 | ||||
| 2025-04-28 | 13F | Strategic Financial Concepts, LLC | 0 | −100,00 | 0 | −100,00 | ||||
| 2025-08-19 | 13F | National Asset Management, Inc. | 23 869 | 39,32 | 488 | 43,66 | ||||
| 2025-05-06 | 13F | Atria Investments Llc | 0 | −100,00 | 0 | |||||
| 2025-08-14 | 13F | Fmr Llc | 47 | 2,17 | 1 | |||||
| 2025-08-05 | 13F | Huntington National Bank | 25 | 0,00 | ||||||
| 2025-07-18 | 13F | SigFig Wealth Management, LLC | 195 065 | 3,11 | 3 952 | 66,75 | ||||
| 2025-05-07 | 13F | First Heartland Consultants, Inc. | 0 | −100,00 | 0 | |||||
| 2025-07-22 | 13F | Three Bridge Wealth Advisors, LLC | 14 561 | −5,31 | 297 | −4,19 | ||||
| 2025-07-07 | 13F | Versant Capital Management, Inc | 0 | −100,00 | 0 | |||||
| 2025-07-24 | 13F | Us Bancorp \de\ | 320 | 7 | ||||||
| 2025-07-14 | 13F | U.S. Capital Wealth Advisors, LLC | 13 763 | 0,00 | 281 | 1,44 | ||||
| 2025-08-11 | 13F | FSC Wealth Advisors, LLC | 1 | 0,00 | 0 | |||||
| 2025-08-14 | 13F | Toroso Investments, LLC | 43 110 | 2,24 | 881 | 3,53 |
Other Listings
| MX:PCY |