Grundläggande statistik
| Institutionella ägare | 111 total, 111 long only, 0 short only, 0 long/short - change of −4,31% MRQ |
| Genomsnittlig portföljallokering | 0.2985 % - change of 64,94% MRQ |
| Institutionella aktier (lång) | 6 255 245 (ex 13D/G) - change of −0,02MM shares −0,32% MRQ |
| Institutionellt värde (lång) | $ 670 005 USD ($1000) |
Institutionellt ägande och aktieägare
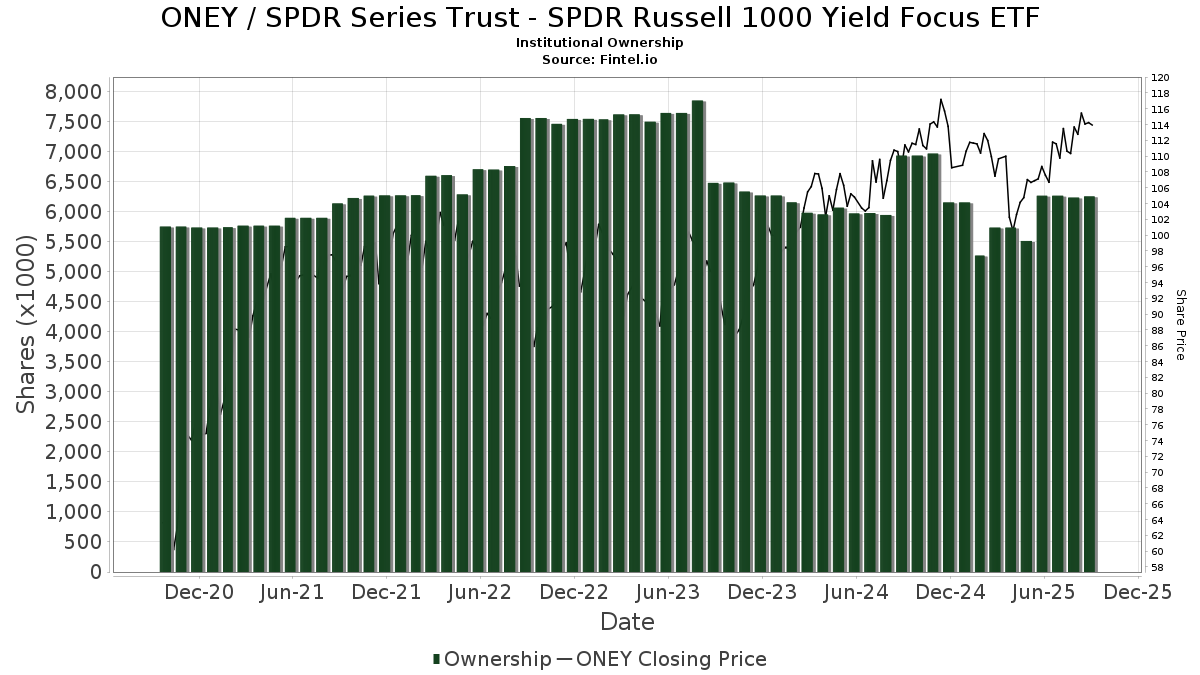
SPDR Series Trust - SPDR Russell 1000 Yield Focus ETF (US:ONEY) har 111 Institutionella ägare och aktieägare som har lämnat in 13D/G- eller 13F-formulär till Securities Exchange Commission (SEC). Dessa institut innehar totalt 6,255,245 aktier. Största aktieägare inkluderar Alaska Permanent Fund Corp, Ameriprise Financial Inc, LPL Financial LLC, Kestra Investment Management, LLC, Creative Planning, Raymond James Financial Inc, Mariner, LLC, Lebenthal Global Advisors, LLC, Cambridge Investment Research Advisors, Inc., and Northwestern Mutual Wealth Management Co .
SPDR Series Trust - SPDR Russell 1000 Yield Focus ETF (ARCA:ONEY) Institutionell ägarstruktur visar institutioners och fonders nuvarande positioner i företaget, samt de senaste förändringarna i positionernas storlek. Större aktieägare kan vara enskilda investerare, fonder, hedgefonder eller institutioner. Bilaga 13D visar att investeraren äger (eller ägde) mer än 5% av företaget och avser (eller avsåg) att aktivt eftersträva en förändring av affärsstrategin. Schedule 13G indikerar en passiv investering på över 5%.
The share price as of September 19, 2025 is 113,63 / share. Previously, on September 20, 2024, the share price was 111,70 / share. This represents an increase of 1,73% over that period.
Fondsentimentets poäng
Fondsentimentet poängen(fka Ägarackumulation-poäng) visar vilka aktier som är mest köpta av fonder. Det är resultatet av en sofistikerad kvantitativ flerfaktormodell som identifierar företag med de högsta nivåerna av institutionell ackumulering. Poängsättningsmodellen använder en kombination av den totala ökningen av redovisade ägare, förändringarna i portföljallokeringarna för dessa ägare och andra mått. Siffran sträcker sig från 0 till 100, där högre siffror indikerar en högre nivå av ackumulering i förhållande till sina konkurrenter, och 50 är genomsnittet.
Uppdateringsfrekvens: Dagligen
Se Ownership Explorer, som innehåller en lista över de högst rankade företagen.
AI+ Ask Fintel’s AI assistant about SPDR Series Trust - SPDR Russell 1000 Yield Focus ETF.
Thinking of good questions…
Institutionell sälj/köp-kvot
Förutom att rapportera vanliga eget kapital- och skuldemissioner måste institutioner med mer än 100MM tillgångar under förvaltning också avslöja sina innehav av sälj- och köpoptioner. Eftersom säljoptioner i allmänhet indikerar ett negativt sentiment och köpoptioner indikerar ett positivt sentiment, kan vi få en uppfattning om det övergripande institutionella sentimentet genom att plotta förhållandet mellan säljoptioner och köpoptioner. Diagrammet till höger visar det historiska förhållandet mellan sälj- och köpoptioner för detta instrument.
Genom att använda sälj/köp-kvoten som en indikator på aktieägarnas sentiment undviker man en av de största bristerna med att använda det totala institutionella ägandet, nämligen att en betydande del av de förvaltade tillgångarna investeras passivt för att följa index. Passivt förvaltade fonder köper vanligtvis inte optioner, så indikatorn för sälj/köp-kvoten ger en bättre bild av stämningen i aktivt förvaltade fonder.
13F- och NPORT-arkiveringar
Detaljer om 13F-arkiveringar är gratis. Detaljer om NP-arkiveringar kräver ett premiummedlemskap. Gröna rader indikerar nya positioner. Röda rader indikerar stängda positioner. Klicka på länk symbolen för att se hela transaktionshistoriken.
Uppgradera
för att låsa upp premiumdata och exportera till Excel ![]() .
.
| Fil Datum | Källa | Investerare | Typ | Genomsnittligt pris (beräknat) |
Aktier | Δ Aktier (%) |
Rapporterat värde (1000 USD) |
Δ Värde (%) |
Portföljallokering (%) |
|
|---|---|---|---|---|---|---|---|---|---|---|
| 2025-07-21 | 13F | DHJJ Financial Advisors, Ltd. | 93 | 0,00 | 10 | 0,00 | ||||
| 2025-08-06 | 13F | Golden State Wealth Management, LLC | 15 | 0,00 | 2 | 0,00 | ||||
| 2025-07-02 | 13F | Central Pacific Bank - Trust Division | 17 | 0,00 | 2 | 0,00 | ||||
| 2025-08-15 | 13F | Morgan Stanley | 2 788 | 12,06 | 302 | 11,07 | ||||
| 2025-08-05 | 13F | Strategic Financial Concepts, LLC | 7 388 | −22,70 | 800 | −23,39 | ||||
| 2025-08-11 | 13F | Cornerstone Planning Group LLC | 2 772 | 5,48 | 306 | 13,75 | ||||
| 2025-07-15 | 13F | Financial Partners Group, Inc | 2 629 | −7,72 | 285 | −8,68 | ||||
| 2025-07-30 | 13F | Insight Advisors, LLC/ PA | 4 178 | −5,71 | 452 | −6,61 | ||||
| 2025-08-06 | 13F | Commonwealth Equity Services, Llc | 16 994 | 1,55 | 2 | 0,00 | ||||
| 2025-08-07 | 13F | Winthrop Capital Management, LLC | 225 | −4,66 | 0 | |||||
| 2025-08-08 | 13F | Larson Financial Group LLC | 211 | −30,82 | 23 | −33,33 | ||||
| 2025-08-12 | 13F | Proequities, Inc. | 0 | 0 | ||||||
| 2025-07-31 | 13F | Cambridge Investment Research Advisors, Inc. | 65 856 | 3,55 | 7 | 16,67 | ||||
| 2025-08-01 | 13F | Envestnet Asset Management Inc | 57 776 | 14,57 | 6 255 | 13,56 | ||||
| 2025-08-12 | 13F | Bokf, Na | 0 | −100,00 | 0 | |||||
| 2025-07-29 | 13F | Private Trust Co Na | 160 | 0,00 | 17 | 0,00 | ||||
| 2025-08-14 | 13F | Integrated Wealth Concepts LLC | 4 125 | −3,80 | 447 | −4,70 | ||||
| 2025-08-12 | 13F | Indie Asset Partners, LLC | 0 | −100,00 | 0 | |||||
| 2025-08-05 | 13F | GPS Wealth Strategies Group, LLC | 268 | 0,00 | 29 | 0,00 | ||||
| 2025-08-12 | 13F | Global Retirement Partners, LLC | 10 680 | 7,37 | 1 156 | 6,84 | ||||
| 2025-07-07 | 13F | Nova Wealth Management, Inc. | 275 | 0,00 | 30 | −3,33 | ||||
| 2025-07-31 | 13F | Glass Jacobson Investment Advisors llc | 1 207 | 1,60 | 131 | 0,78 | ||||
| 2025-08-12 | 13F | Gladstone Institutional Advisory LLC | 3 549 | 3,11 | 384 | 2,13 | ||||
| 2025-08-13 | 13F | Mayfair Advisory Group, LLC | 2 048 | −66,83 | 226 | −66,47 | ||||
| 2025-04-25 | 13F | Sovran Advisors, LLC | 0 | −100,00 | 0 | |||||
| 2025-08-13 | 13F | Financial Freedom, LLC | 2 188 | 0,32 | 237 | −0,84 | ||||
| 2025-08-13 | 13F | Northwestern Mutual Wealth Management Co | 58 027 | −2,07 | 6 282 | −2,94 | ||||
| 2025-07-28 | 13F | RFG Advisory, LLC | 0 | −100,00 | 0 | |||||
| 2025-08-14 | 13F | Ameriprise Financial Inc | 1 270 103 | 8,92 | 137 039 | 7,54 | ||||
| 2025-08-14 | 13F | Smartleaf Asset Management LLC | 0 | −100,00 | 0 | |||||
| 2025-08-26 | 13F/A | Thrivent Financial For Lutherans | 0 | −100,00 | 0 | −100,00 | ||||
| 2025-05-15 | 13F | Hrt Financial Lp | 0 | −100,00 | 0 | |||||
| 2025-08-15 | 13F | Kestra Advisory Services, LLC | 2 204 | 11,76 | 239 | 10,70 | ||||
| 2025-08-05 | 13F | Bank of New York Mellon Corp | 2 903 | 314 | ||||||
| 2025-08-13 | 13F | Continuum Advisory, LLC | 0 | −100,00 | 0 | |||||
| 2025-07-15 | 13F | World Equity Group, Inc. | 3 413 | 2,93 | 370 | 1,93 | ||||
| 2025-04-14 | 13F | RDA Financial Network | 0 | −100,00 | 0 | |||||
| 2025-07-22 | 13F | IVC Wealth Advisors LLC | 2 900 | 0,00 | 314 | −0,95 | ||||
| 2025-07-25 | 13F | Atria Wealth Solutions, Inc. | 2 001 | 217 | ||||||
| 2025-07-28 | 13F | Harbour Investments, Inc. | 108 | −91,22 | 12 | −91,79 | ||||
| 2025-08-12 | 13F | Financial Advocates Investment Management | 5 903 | −2,88 | 639 | −3,62 | ||||
| 2025-08-14 | 13F | Lebenthal Global Advisors, LLC | 113 429 | −0,99 | 12 281 | −1,86 | ||||
| 2025-08-14 | 13F | Main Street Financial Solutions, LLC | 2 110 | 0,00 | 228 | −0,87 | ||||
| 2025-08-08 | 13F | Collaborative Wealth Managment Inc. | 24 132 | 7,35 | 2 613 | 6,40 | ||||
| 2025-08-08 | 13F | Avantax Advisory Services, Inc. | 8 191 | −1,55 | 887 | −2,42 | ||||
| 2025-07-21 | 13F | Precedent Wealth Partners, Llc | 10 395 | −16,43 | 1 125 | −17,16 | ||||
| 2025-07-23 | 13F | Valmark Advisers, Inc. | 2 424 | 7,21 | 262 | 6,50 | ||||
| 2025-07-29 | 13F | Portland Financial Advisors Inc | 2 775 | −15,40 | 300 | −16,20 | ||||
| 2025-08-12 | 13F | Quadcap Wealth Management, LLC | 2 019 | −12,10 | 219 | −12,80 | ||||
| 2025-08-07 | 13F | Cascade Financial Partners, LLC | 2 399 | −29,92 | 260 | −30,56 | ||||
| 2025-08-08 | 13F | Pnc Financial Services Group, Inc. | 29 | 0,00 | 3 | 0,00 | ||||
| 2025-08-15 | 13F | Equitable Holdings, Inc. | 31 959 | 17,43 | 3 460 | 16,42 | ||||
| 2025-07-28 | 13F | Copia Wealth Management | 114 | 0,00 | 12 | 0,00 | ||||
| 2025-08-14 | 13F | Goldman Sachs Group Inc | 17 877 | 1 935 | ||||||
| 2025-07-28 | 13F | BRYN MAWR TRUST Co | 25 | 0,00 | 3 | 0,00 | ||||
| 2025-08-11 | 13F | Western Wealth Management, LLC | 2 804 | 0,00 | 304 | −0,98 | ||||
| 2025-08-12 | 13F | Steward Partners Investment Advisory, Llc | 53 032 | 4,48 | 5 742 | 3,55 | ||||
| 2025-07-21 | 13F | Ameriflex Group, Inc. | 0 | −100,00 | 0 | |||||
| 2025-08-14 | 13F | CoreCap Advisors, LLC | 0 | −100,00 | 0 | |||||
| 2025-08-04 | 13F | Horizon Wealth Management, LLC | 9 768 | −18,29 | 1 058 | −19,00 | ||||
| 2025-04-21 | 13F | Nelson, Van Denburg & Campbell Wealth Management Group, LLC | 0 | −100,00 | 0 | |||||
| 2025-07-31 | 13F | Leavell Investment Management, Inc. | 17 144 | 0,85 | 1 856 | 0,00 | ||||
| 2025-08-14 | 13F | Bank Of America Corp /de/ | 24 078 | −0,18 | 2 607 | −1,06 | ||||
| 2025-08-18 | 13F/A | Kestra Investment Management, LLC | 252 445 | −40,05 | 27 332 | −40,59 | ||||
| 2025-08-18 | 13F | Geneos Wealth Management Inc. | 600 | 0,00 | 65 | −1,54 | ||||
| 2025-07-18 | 13F | Truist Financial Corp | 2 887 | −40,03 | 313 | −40,57 | ||||
| 2025-08-14 | 13F | UBS Group AG | 1 351 | 16 787,50 | 146 | |||||
| 2025-09-04 | 13F/A | Advisor Group Holdings, Inc. | 16 111 | 5,91 | 1 744 | 5,00 | ||||
| 2025-07-17 | 13F | Fifth Third Securities, Inc. | 10 493 | 17,08 | 1 136 | 16,16 | ||||
| 2025-05-14 | 13F | Triad Wealth Partners, LLC | 0 | −100,00 | 0 | |||||
| 2025-07-15 | 13F | Family Investment Center, Inc. | 36 674 | 2,73 | 3 971 | 1,82 | ||||
| 2025-07-16 | 13F | Essex Financial Services, Inc. | 7 241 | −3,79 | 784 | −4,74 | ||||
| 2025-08-12 | 13F | Jpmorgan Chase & Co | 368 | −50,47 | 40 | −51,85 | ||||
| 2025-05-07 | 13F | Vista Private Wealth Partners. LLC | 0 | −100,00 | 0 | |||||
| 2025-07-31 | 13F | CAP Partners, LLC | 2 289 | −0,56 | 248 | −1,59 | ||||
| 2025-08-14 | 13F | Mariner, LLC | 188 405 | 8,79 | 20 398 | 7,83 | ||||
| 2025-07-07 | 13F | Capital Asset Advisory Services LLC | 0 | −100,00 | 0 | −100,00 | ||||
| 2025-07-29 | 13F | Lutz Financial Services LLC | 2 295 | −31,33 | 248 | −32,05 | ||||
| 2025-08-12 | 13F | MAI Capital Management | 19 | 0,00 | 2 | 0,00 | ||||
| 2025-08-13 | 13F | Jones Financial Companies Lllp | 9 502 | 28,60 | 1 024 | 28,04 | ||||
| 2025-08-13 | 13F | Capital Analysts, Inc. | 10 813 | 25,62 | 1 | |||||
| 2025-07-02 | 13F | Crumly & Associates Inc. | 13 723 | 0,00 | 1 486 | −0,93 | ||||
| 2025-08-14 | 13F | GWM Advisors LLC | 200 | 0,00 | 22 | 0,00 | ||||
| 2025-08-13 | 13F | Virtue Capital Management, LLC | 0 | −100,00 | 0 | |||||
| 2025-08-15 | 13F | Tower Research Capital LLC (TRC) | 2 728 | 34,65 | 295 | 33,48 | ||||
| 2025-07-25 | 13F | Cwm, Llc | 218 | 0 | ||||||
| 2025-04-30 | 13F | Stratos Wealth Partners, LTD. | 0 | −100,00 | 0 | |||||
| 2025-07-09 | 13F | Dynamic Advisor Solutions LLC | 1 901 | −0,37 | 206 | −1,44 | ||||
| 2025-08-08 | 13F | Kingsview Wealth Management, LLC | 36 904 | 5,35 | 3 995 | 4,42 | ||||
| 2025-08-11 | 13F | Principal Securities, Inc. | 413 | 11,02 | 45 | 10,00 | ||||
| 2025-07-11 | 13F | Meriwether Wealth & Planning, LLC | 3 057 | −0,36 | 331 | −1,49 | ||||
| 2025-07-17 | 13F | Venture Visionary Partners LLC | 8 696 | 0,00 | 941 | −0,84 | ||||
| 2025-07-11 | 13F | Farther Finance Advisors, LLC | 55 | 0,00 | 6 | −16,67 | ||||
| 2025-07-29 | 13F | Rodgers & Associates, LTD | 2 061 | 0,00 | 223 | −0,89 | ||||
| 2025-08-14 | 13F | Alaska Permanent Fund Corp | 2 420 919 | 0,00 | 266 180 | 5,58 | ||||
| 2025-08-04 | 13F | Assetmark, Inc | 82 | 9 | ||||||
| 2025-08-13 | 13F | Ally Invest Advisors Inc. | 2 313 | −7,33 | 250 | −8,09 | ||||
| 2025-07-25 | 13F | Concurrent Investment Advisors, LLC | 1 851 | −41,35 | 200 | −41,86 | ||||
| 2025-07-30 | 13F | Bogart Wealth, LLC | 1 104 | 0,00 | 120 | −0,83 | ||||
| 2025-08-12 | 13F | Cornerstone Wealth Management, LLC | 2 717 | 12,09 | 294 | 11,36 | ||||
| 2025-08-13 | 13F | Congress Wealth Management LLC / DE / | 0 | −100,00 | 0 | |||||
| 2025-07-23 | 13F | Prime Capital Investment Advisors, LLC | 2 603 | 0,00 | 282 | −1,06 | ||||
| 2025-08-14 | 13F | Mml Investors Services, Llc | 2 659 | 7,09 | 0 | |||||
| 2025-07-16 | 13F | Brown, Lisle/cummings, Inc. | 6 805 | 0,00 | 737 | −0,94 | ||||
| 2025-08-13 | 13F | Holos Integrated Wealth LLC | 57 730 | 0,61 | 6 382 | 1,82 | ||||
| 2025-08-06 | 13F | Bonfire Financial | 14 811 | −1,30 | 1 604 | −2,20 | ||||
| 2025-07-09 | 13F | Pallas Capital Advisors LLC | 37 319 | 3,69 | 4 040 | 2,77 | ||||
| 2025-08-14 | 13F | Jane Street Group, Llc | 3 002 | 21,15 | 325 | 20,37 | ||||
| 2025-08-14 | 13F | CoreFirst Bank & Trust | 11 058 | 2,45 | 1 197 | 1,53 | ||||
| 2025-07-15 | 13F | FMA Wealth Management, LLC | 37 594 | 2,34 | 4 070 | −1,48 | ||||
| 2025-07-17 | 13F | XML Financial, LLC | 2 535 | 12,72 | 274 | 11,84 | ||||
| 2025-08-19 | 13F | Newbridge Financial Services Group, Inc. | 635 | −44,78 | 69 | −45,60 | ||||
| 2025-08-11 | 13F | Private Advisor Group, LLC | 44 561 | −5,70 | 4 825 | −6,55 | ||||
| 2025-04-17 | 13F | Lockerman Financial Group, Inc. | 0 | −100,00 | 0 | −100,00 | ||||
| 2025-07-29 | 13F | Angeles Wealth Management, Llc | 2 616 | 0,00 | 283 | −0,70 | ||||
| 2025-07-28 | 13F | Axxcess Wealth Management, Llc | 0 | −100,00 | 0 | |||||
| 2025-08-08 | 13F | Thoroughbred Financial Services, Llc | 4 260 | 68,51 | 0 | |||||
| 2025-07-10 | 13F | Wealth Enhancement Advisory Services, Llc | 2 712 | −4,00 | 303 | −1,62 | ||||
| 2025-07-29 | 13F | Creekside Partners | 5 661 | 0,86 | 613 | −0,16 | ||||
| 2025-08-14 | 13F | Wells Fargo & Company/mn | 2 652 | 5,66 | 287 | 4,74 | ||||
| 2025-08-14 | 13F | IHT Wealth Management, LLC | 16 798 | −9,82 | 1 819 | −10,62 | ||||
| 2025-05-08 | 13F | We Are One Seven, LLC | 0 | −100,00 | 0 | |||||
| 2025-07-15 | 13F | McAdam, LLC | 2 765 | 1,02 | 299 | 0,34 | ||||
| 2025-08-14 | 13F | Royal Bank Of Canada | 1 312 | 4,21 | 142 | 2,90 | ||||
| 2025-08-05 | 13F | Fourth Dimension Wealth, LLC | 46 | 5 | ||||||
| 2025-08-14 | 13F | Raymond James Financial Inc | 191 520 | −6,02 | 20 735 | −6,86 | ||||
| 2025-05-15 | 13F | Baird Financial Group, Inc. | 0 | −100,00 | 0 | |||||
| 2025-08-14 | 13F | Susquehanna International Group, Llp | 13 318 | 1 442 | ||||||
| 2025-08-08 | 13F | Creative Planning | 251 328 | −1,17 | 27 211 | −2,05 | ||||
| 2025-08-12 | 13F | LPL Financial LLC | 615 970 | 1,20 | 66 689 | 0,30 | ||||
| 2025-08-14 | 13F | Fmr Llc | 233 | 72,59 | 25 | 78,57 | ||||
| 2025-07-14 | 13F | AdvisorNet Financial, Inc | 61 | 0,00 | 7 | 0,00 | ||||
| 2025-08-08 | 13F | Cetera Investment Advisers | 24 528 | −4,39 | 2 656 | −5,25 | ||||
| 2025-08-11 | 13F | Aptus Capital Advisors, LLC | 10 | 0,00 | 1 | 0,00 |