Grundläggande statistik
| Institutionella ägare | 127 total, 127 long only, 0 short only, 0 long/short - change of −3,05% MRQ |
| Genomsnittlig portföljallokering | 0.0988 % - change of 0,86% MRQ |
| Institutionella aktier (lång) | 8 383 991 (ex 13D/G) - change of −0,26MM shares −2,98% MRQ |
| Institutionellt värde (lång) | $ 293 464 USD ($1000) |
Institutionellt ägande och aktieägare
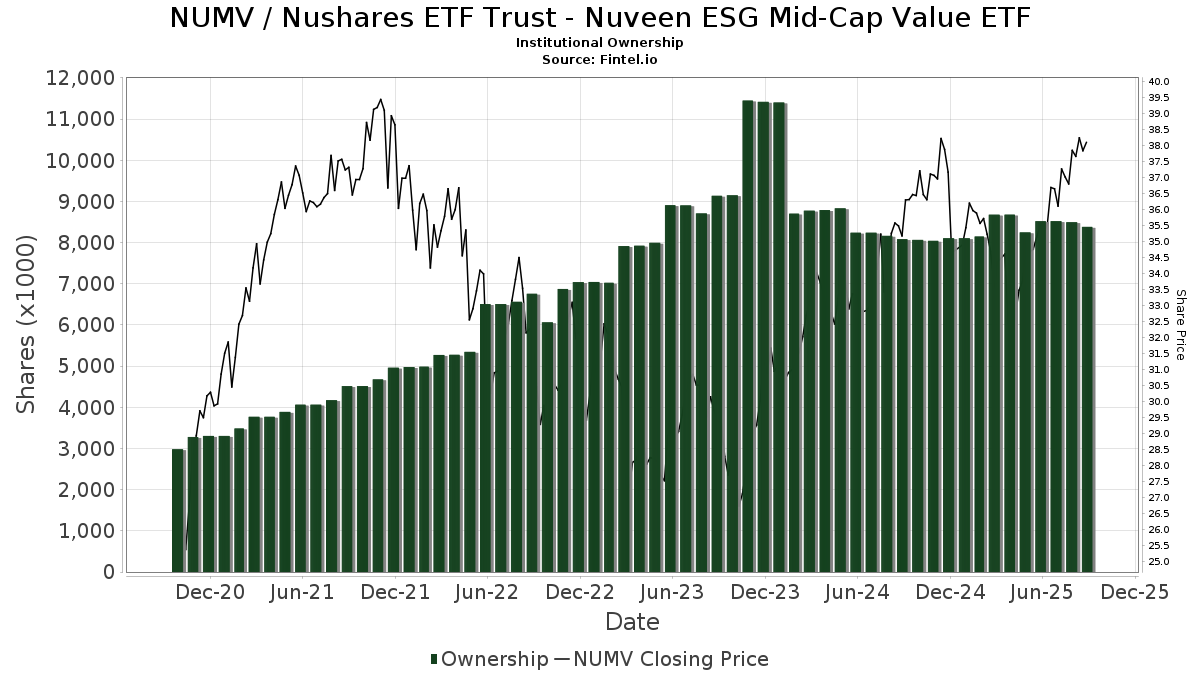
Nushares ETF Trust - Nuveen ESG Mid-Cap Value ETF (US:NUMV) har 127 Institutionella ägare och aktieägare som har lämnat in 13D/G- eller 13F-formulär till Securities Exchange Commission (SEC). Dessa institut innehar totalt 8,383,991 aktier. Största aktieägare inkluderar Morgan Stanley, Tiaa Trust, National Association, Abacus Wealth Partners, LLC, LPL Financial LLC, Royal Bank Of Canada, Raymond James Financial Inc, Bank of New York Mellon Corp, Bank Of America Corp /de/, UBS Group AG, and Empirical Financial Services, LLC d.b.a. Empirical Wealth Management .
Nushares ETF Trust - Nuveen ESG Mid-Cap Value ETF (BATS:NUMV) Institutionell ägarstruktur visar institutioners och fonders nuvarande positioner i företaget, samt de senaste förändringarna i positionernas storlek. Större aktieägare kan vara enskilda investerare, fonder, hedgefonder eller institutioner. Bilaga 13D visar att investeraren äger (eller ägde) mer än 5% av företaget och avser (eller avsåg) att aktivt eftersträva en förändring av affärsstrategin. Schedule 13G indikerar en passiv investering på över 5%.
The share price as of September 8, 2025 is 38,49 / share. Previously, on September 9, 2024, the share price was 35,26 / share. This represents an increase of 9,16% over that period.
Fondsentimentets poäng
Fondsentimentet poängen(fka Ägarackumulation-poäng) visar vilka aktier som är mest köpta av fonder. Det är resultatet av en sofistikerad kvantitativ flerfaktormodell som identifierar företag med de högsta nivåerna av institutionell ackumulering. Poängsättningsmodellen använder en kombination av den totala ökningen av redovisade ägare, förändringarna i portföljallokeringarna för dessa ägare och andra mått. Siffran sträcker sig från 0 till 100, där högre siffror indikerar en högre nivå av ackumulering i förhållande till sina konkurrenter, och 50 är genomsnittet.
Uppdateringsfrekvens: Dagligen
Se Ownership Explorer, som innehåller en lista över de högst rankade företagen.
Institutionell sälj/köp-kvot
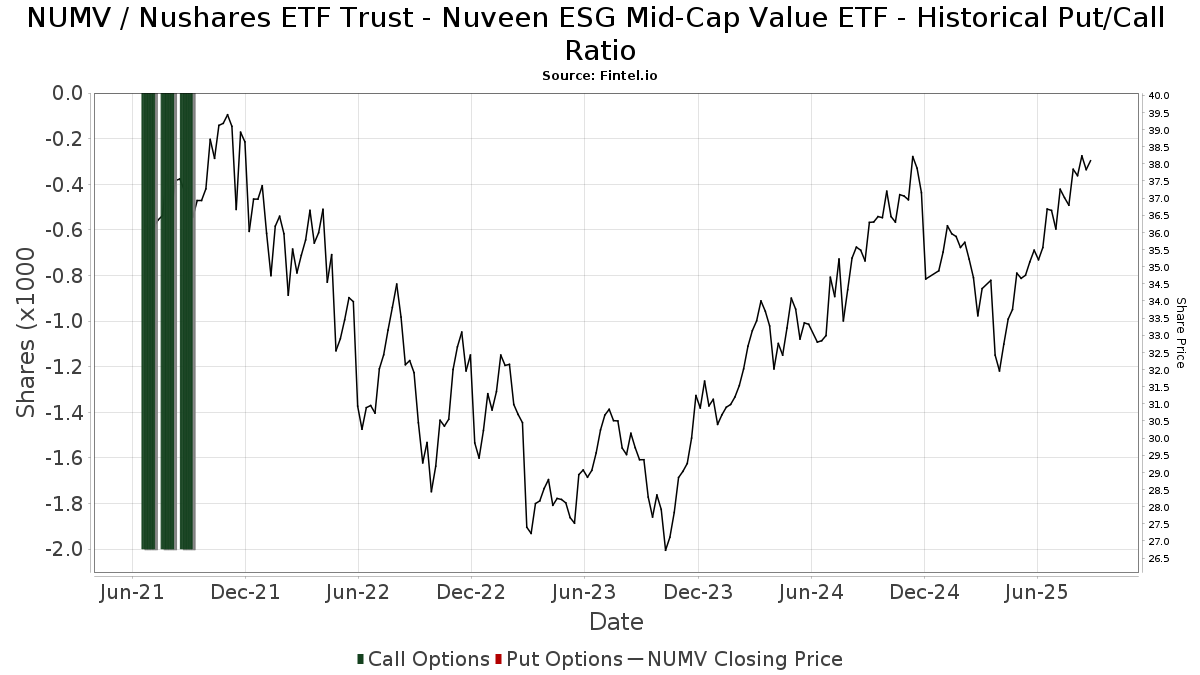
Förutom att rapportera vanliga eget kapital- och skuldemissioner måste institutioner med mer än 100MM tillgångar under förvaltning också avslöja sina innehav av sälj- och köpoptioner. Eftersom säljoptioner i allmänhet indikerar ett negativt sentiment och köpoptioner indikerar ett positivt sentiment, kan vi få en uppfattning om det övergripande institutionella sentimentet genom att plotta förhållandet mellan säljoptioner och köpoptioner. Diagrammet till höger visar det historiska förhållandet mellan sälj- och köpoptioner för detta instrument.
Genom att använda sälj/köp-kvoten som en indikator på aktieägarnas sentiment undviker man en av de största bristerna med att använda det totala institutionella ägandet, nämligen att en betydande del av de förvaltade tillgångarna investeras passivt för att följa index. Passivt förvaltade fonder köper vanligtvis inte optioner, så indikatorn för sälj/köp-kvoten ger en bättre bild av stämningen i aktivt förvaltade fonder.
13F- och NPORT-arkiveringar
Detaljer om 13F-arkiveringar är gratis. Detaljer om NP-arkiveringar kräver ett premiummedlemskap. Gröna rader indikerar nya positioner. Röda rader indikerar stängda positioner. Klicka på länk symbolen för att se hela transaktionshistoriken.
Uppgradera
för att låsa upp premiumdata och exportera till Excel ![]() .
.
| Fil Datum | Källa | Investerare | Typ | Genomsnittligt pris (beräknat) |
Aktier | Δ Aktier (%) |
Rapporterat värde (1000 USD) |
Δ Värde (%) |
Portföljallokering (%) |
|
|---|---|---|---|---|---|---|---|---|---|---|
| 2025-08-13 | 13F | Millstone Evans Group, LLC | 519 | 0,00 | 19 | 5,88 | ||||
| 2025-08-14 | 13F | Comerica Bank | 1 833 | −39,54 | 66 | −35,92 | ||||
| 2025-08-12 | 13F | LPL Financial LLC | 547 029 | 2,93 | 19 720 | 8,46 | ||||
| 2025-08-07 | 13F | Allworth Financial LP | 256 | 0,00 | 9 | 12,50 | ||||
| 2025-08-08 | 13F | Cetera Investment Advisers | 44 774 | −4,88 | 1 614 | 0,25 | ||||
| 2025-08-11 | 13F | Annis Gardner Whiting Capital Advisors, LLC | 236 | 3,96 | 9 | 14,29 | ||||
| 2025-07-24 | 13F | IFP Advisors, Inc | 217 | 102,80 | 8 | 133,33 | ||||
| 2025-08-12 | 13F | Proequities, Inc. | 0 | 0 | ||||||
| 2025-07-15 | 13F | McAdam, LLC | 6 992 | 8,44 | 252 | 14,55 | ||||
| 2025-08-05 | 13F | GPS Wealth Strategies Group, LLC | 61 | 0,00 | 2 | 0,00 | ||||
| 2025-08-06 | 13F | SOUTH STATE Corp | 17 | 0,00 | 1 | |||||
| 2025-04-22 | 13F | Synergy Financial Management, LLC | 0 | −100,00 | 0 | |||||
| 2025-07-25 | 13F | NorthRock Partners, LLC | 56 | 0,00 | 2 | 100,00 | ||||
| 2025-08-14 | 13F | UBS Group AG | 278 749 | 4,58 | 10 049 | 10,20 | ||||
| 2025-08-08 | 13F | ERTS Wealth Advisors, LLC | 0 | −100,00 | 0 | |||||
| 2025-07-21 | 13F | Empirical Financial Services, LLC d.b.a. Empirical Wealth Management | 256 110 | −0,23 | 9 233 | 5,14 | ||||
| 2025-07-25 | 13F | Fifth Third Wealth Advisors LLC | 10 720 | 0,00 | 386 | 5,46 | ||||
| 2025-07-25 | 13F | Concord Wealth Partners | 821 | −76,09 | 30 | −75,21 | ||||
| 2025-07-16 | 13F | Falcon Wealth Planning | 7 269 | 10,17 | 262 | 16,44 | ||||
| 2025-08-26 | 13F/A | Thrivent Financial For Lutherans | 12 057 | −77,83 | 0 | −100,00 | ||||
| 2025-07-16 | 13F/A | CX Institutional | 6 447 | −5,21 | 0 | |||||
| 2025-08-12 | 13F | O'shaughnessy Asset Management, Llc | 14 | 0,00 | 1 | |||||
| 2025-08-13 | 13F | SageView Advisory Group, LLC | 14 500 | 0,00 | 540 | 8,67 | ||||
| 2025-08-13 | 13F | Jones Financial Companies Lllp | 96 611 | 9,36 | 3 460 | 15,38 | ||||
| 2025-08-14 | 13F | Bank Of America Corp /de/ | 303 998 | −0,01 | 10 959 | 5,36 | ||||
| 2025-08-08 | 13F | Pnc Financial Services Group, Inc. | 28 713 | −4,70 | 1 035 | 0,49 | ||||
| 2025-07-09 | 13F | Dynamic Advisor Solutions LLC | 41 661 | −20,18 | 1 502 | −15,91 | ||||
| 2025-08-14 | 13F | Citadel Advisors Llc | 13 446 | 485 | ||||||
| 2025-07-30 | 13F | Fingerlakes Wealth Management, Inc. | 18 438 | 1,65 | 665 | 7,10 | ||||
| 2025-08-12 | 13F | MAI Capital Management | 530 | 1,53 | 19 | 11,76 | ||||
| 2025-08-15 | 13F | Equitable Holdings, Inc. | 7 660 | 18,69 | 276 | 25,45 | ||||
| 2025-08-14 | 13F | Mariner, LLC | 26 120 | 0,00 | 942 | 5,38 | ||||
| 2025-08-14 | 13F | Susquehanna International Group, Llp | 41 847 | 183,98 | 1 509 | 199,21 | ||||
| 2025-07-29 | 13F | Harbor Asset Planning, Inc. | 318 | 11 | ||||||
| 2025-07-17 | 13F | Neumann Capital Management, LLC | 15 560 | 0,00 | 561 | 5,26 | ||||
| 2025-08-12 | 13F | Investor's Fiduciary Advisor Network, LLC | 7 852 | 0 | ||||||
| 2025-07-31 | 13F | Cambridge Investment Research Advisors, Inc. | 11 615 | −1,01 | 0 | |||||
| 2025-08-14 | 13F | Wiley Bros.-aintree Capital, Llc | 17 566 | 0,00 | 633 | 6,21 | ||||
| 2025-08-14 | 13F | Raymond James Financial Inc | 538 787 | 3,94 | 19 423 | 9,53 | ||||
| 2025-07-15 | 13F | RTD Financial Advisors, Inc. | 24 825 | −3,98 | 895 | 1,13 | ||||
| 2025-05-07 | 13F | Vista Private Wealth Partners. LLC | 0 | −100,00 | 0 | |||||
| 2025-07-08 | 13F | Parallel Advisors, LLC | 1 018 | 19,34 | 37 | 24,14 | ||||
| 2025-08-06 | 13F | Simmons Bank | 11 066 | −2,34 | 399 | 2,84 | ||||
| 2025-08-05 | 13F | Tiaa Trust, National Association | 1 004 386 | −17,57 | 36 208 | −13,13 | ||||
| 2025-07-29 | 13F | Private Trust Co Na | 0 | −100,00 | 0 | |||||
| 2025-08-14 | 13F | Stage Harbor Financial, Llc | 6 473 | −25,02 | 233 | −21,02 | ||||
| 2025-08-13 | 13F | Beacon Pointe Advisors, LLC | 139 271 | −0,68 | 5 021 | 4,65 | ||||
| 2025-07-31 | 13F | Opes Wealth Management LLC | 38 115 | 0,40 | 1 374 | 5,86 | ||||
| 2025-07-28 | 13F | Revolve Wealth Partners, LLC | 27 485 | 2,02 | 991 | 7,49 | ||||
| 2025-07-29 | 13F | Private Wealth Management Group, LLC | 9 491 | 1,38 | 342 | 6,88 | ||||
| 2025-08-07 | 13F | CENTRAL TRUST Co | 13 550 | −11,27 | 488 | −6,51 | ||||
| 2025-08-13 | 13F | WCG Wealth Advisors LLC | 35 710 | 0,74 | 1 287 | 6,19 | ||||
| 2025-08-13 | 13F | Northwestern Mutual Wealth Management Co | 29 298 | 12,08 | 1 056 | 18,12 | ||||
| 2025-08-14 | 13F | Fmr Llc | 1 373 | 17,55 | 49 | 25,64 | ||||
| 2025-08-07 | 13F | McClarren Financial Advisors, Inc. | 0 | −100,00 | 0 | |||||
| 2025-08-14 | 13F | Betterment LLC | 8 225 | 25,67 | 0 | |||||
| 2025-08-06 | 13F | AE Wealth Management LLC | 0 | −100,00 | 0 | |||||
| 2025-04-30 | 13F | Stratos Wealth Advisors, LLC | 0 | −100,00 | 0 | |||||
| 2025-07-07 | 13F | Trust Co | 9 744 | −4,68 | 351 | 0,57 | ||||
| 2025-08-11 | 13F | Heritage Wealth Advisors | 25 648 | −5,17 | 925 | −0,11 | ||||
| 2025-08-01 | 13F | Envestnet Asset Management Inc | 100 714 | −0,47 | 3 631 | 4,88 | ||||
| 2025-07-16 | 13F | Evergreen Private Wealth LLC | 9 677 | −16,40 | 349 | −11,90 | ||||
| 2025-08-15 | 13F | Morgan Stanley | 1 463 546 | 2,13 | 52 761 | 7,63 | ||||
| 2025-08-13 | 13F | Lido Advisors, LLC | 11 762 | −59,73 | 424 | −57,56 | ||||
| 2025-07-17 | 13F | LexAurum Advisors, LLC | 12 721 | 0,32 | 459 | 5,77 | ||||
| 2025-08-14 | 13F | Bragg Financial Advisors, Inc | 8 611 | 4,21 | 310 | 9,93 | ||||
| 2025-08-14 | 13F | GWM Advisors LLC | 20 040 | 10,59 | 722 | 16,64 | ||||
| 2025-07-08 | 13F | Nbc Securities, Inc. | 68 | 0,00 | 0 | |||||
| 2025-08-19 | 13F | Cape Investment Advisory, Inc. | 499 | 0,00 | 18 | 0,00 | ||||
| 2025-07-21 | 13F | DHJJ Financial Advisors, Ltd. | 35 | 0,00 | 1 | 0,00 | ||||
| 2025-08-11 | 13F | Private Advisor Group, LLC | 9 325 | −9,72 | 336 | −4,82 | ||||
| 2025-05-15 | 13F | Baird Financial Group, Inc. | 0 | −100,00 | 0 | |||||
| 2025-07-11 | 13F/A | Umb Bank N A/mo | 2 183 | −31,37 | 79 | −27,78 | ||||
| 2025-08-11 | 13F | Aptus Capital Advisors, LLC | 465 | 0,00 | 17 | 6,67 | ||||
| 2025-08-13 | 13F | Flow Traders U.s. Llc | 6 589 | −28,55 | 0 | |||||
| 2025-08-04 | 13F | Assetmark, Inc | 6 680 | 108,36 | 241 | 120,18 | ||||
| 2025-07-18 | 13F | Vicus Capital | 9 643 | 0,73 | 348 | 6,12 | ||||
| 2025-07-31 | 13F | LongView Asset Management LLC | 8 032 | −11,42 | 290 | −6,77 | ||||
| 2025-08-14 | 13F | Mercer Global Advisors Inc /adv | 0 | −100,00 | 0 | |||||
| 2025-08-01 | 13F | Bessemer Group Inc | 2 909 | 0,00 | 0 | |||||
| 2025-08-13 | 13F | EverSource Wealth Advisors, LLC | 68 | 0,00 | 2 | 0,00 | ||||
| 2025-07-24 | 13F | Us Bancorp \de\ | 0 | −100,00 | 0 | |||||
| 2025-09-04 | 13F/A | Advisor Group Holdings, Inc. | 24 747 | 27,70 | 892 | 34,59 | ||||
| 2025-08-13 | 13F | Cresset Asset Management, LLC | 26 583 | 3,40 | 958 | 8,99 | ||||
| 2025-08-14 | 13F | Evergreen Capital Management Llc | 9 246 | −2,89 | 333 | 2,46 | ||||
| 2025-08-11 | 13F | Citigroup Inc | 380 | 0,00 | 14 | 0,00 | ||||
| 2025-08-14 | 13F/A | Rockefeller Capital Management L.P. | 28 280 | 0,00 | 1 019 | 5,38 | ||||
| 2025-08-14 | 13F | EP Wealth Advisors, Inc. | 2 980 | 107 | ||||||
| 2025-07-10 | 13F | Wealth Enhancement Advisory Services, Llc | 7 482 | −3,38 | 275 | 4,17 | ||||
| 2025-08-05 | 13F | Bank of New York Mellon Corp | 446 116 | 9,51 | 16 082 | 15,40 | ||||
| 2025-07-15 | 13F | MCF Advisors LLC | 0 | −100,00 | 0 | |||||
| 2025-07-22 | 13F | DT Investment Partners, LLC | 175 | −15,46 | 6 | −14,29 | ||||
| 2025-08-12 | 13F | Ameritas Investment Partners, Inc. | 1 208 | 0,00 | 44 | 4,88 | ||||
| 2025-07-08 | 13F | Canandaigua National Bank & Trust Co | 48 152 | −10,90 | 1 736 | −6,11 | ||||
| 2025-08-07 | 13F | Commerce Bank | 15 030 | −11,25 | 542 | −6,56 | ||||
| 2025-07-15 | 13F | Signet Financial Management, Llc | 6 280 | 0,00 | 226 | 5,61 | ||||
| 2025-07-15 | 13F | RVW Wealth, LLC | 17 964 | −1,55 | 648 | 3,69 | ||||
| 2025-07-09 | 13F | Bruce G. Allen Investments, LLC | 370 | 0,00 | 13 | 8,33 | ||||
| 2025-08-12 | 13F | Coldstream Capital Management Inc | 18 007 | 0,00 | 649 | 5,36 | ||||
| 2025-08-15 | 13F | CI Private Wealth, LLC | 14 818 | 118,88 | 534 | 131,17 | ||||
| 2025-05-02 | 13F | Invera Wealth Advisors, LLC | 63 582 | 0,35 | 2 175 | −5,15 | ||||
| 2025-08-06 | 13F | Commonwealth Equity Services, Llc | 150 875 | −11,76 | 5 | 0,00 | ||||
| 2025-08-14 | 13F | Mml Investors Services, Llc | 8 916 | 34,08 | 0 | |||||
| 2025-04-09 | 13F | West Financial Advisors, LLC | 0 | −100,00 | 0 | |||||
| 2025-08-14 | 13F | Clarity Asset Management, Inc. | 405 | 0,00 | 15 | 7,69 | ||||
| 2025-07-30 | 13F | Crewe Advisors LLC | 401 | 0,00 | 14 | 7,69 | ||||
| 2025-07-24 | 13F | Stonebridge Financial Group, LLC | 0 | −100,00 | 0 | |||||
| 2025-07-14 | 13F | Abacus Wealth Partners, LLC | 902 286 | −3,09 | 32 527 | 2,13 | ||||
| 2025-08-13 | 13F | VestGen Advisors, LLC | 6 774 | 0,00 | 244 | 5,63 | ||||
| 2025-08-07 | 13F | Parkside Financial Bank & Trust | 18 962 | 0,00 | 684 | 5,40 | ||||
| 2025-08-14 | 13F | Fiduciary Trust Co | 89 246 | 0,00 | 3 217 | 5,37 | ||||
| 2025-08-12 | 13F | Steward Partners Investment Advisory, Llc | 2 294 | 3,10 | 83 | 7,89 | ||||
| 2025-04-21 | 13F | Nelson, Van Denburg & Campbell Wealth Management Group, LLC | 0 | −100,00 | 0 | |||||
| 2025-07-29 | 13F | Fundamentun, Llc | 11 450 | 0,00 | 413 | 5,37 | ||||
| 2025-08-12 | 13F | Global Retirement Partners, LLC | 194 | −17,09 | 7 | −25,00 | ||||
| 2025-08-07 | 13F | Addison Advisors LLC | 19 097 | −3,61 | 688 | 1,62 | ||||
| 2025-08-14 | 13F | Colony Group, LLC | 8 253 | 0,00 | 298 | 5,32 | ||||
| 2025-07-11 | 13F | Farther Finance Advisors, LLC | 2 575 | 0,00 | 93 | 4,55 | ||||
| 2025-08-08 | 13F | Creative Planning | 108 300 | 0,00 | 3 904 | 5,40 | ||||
| 2025-07-14 | 13F | AdvisorNet Financial, Inc | 259 | 0,00 | 9 | 12,50 | ||||
| 2025-07-15 | 13F | Regatta Capital Group, Llc | 36 010 | −3,20 | 1 298 | 2,04 | ||||
| 2025-07-25 | 13F | Cwm, Llc | 9 522 | 169,82 | 0 | |||||
| 2025-08-14 | 13F | Marshall Investment Management, Llc | 0 | −100,00 | 0 | |||||
| 2025-08-14 | 13F | Royal Bank Of Canada | 540 324 | −0,82 | 19 478 | 4,51 | ||||
| 2025-08-14 | 13F | Wells Fargo & Company/mn | 136 996 | 7,03 | 4 939 | 12,79 | ||||
| 2025-08-13 | 13F | Natixis Advisors, L.p. | 13 723 | 11,20 | 0 | |||||
| 2025-08-14 | 13F | Abound Financial, Llc | 7 915 | 24,53 | 285 | 31,34 | ||||
| 2025-08-15 | 13F | Tower Research Capital LLC (TRC) | 14 503 | 258,45 | 523 | 278,26 | ||||
| 2025-08-13 | 13F | IAG Wealth Partners, LLC | 634 | 0,00 | 23 | 4,76 | ||||
| 2025-08-01 | 13F | Rossby Financial, LCC | 61 | 0,00 | 2 | 0,00 | ||||
| 2025-08-11 | 13F | Principal Securities, Inc. | 869 | 0,00 | 31 | 3,33 | ||||
| 2025-08-05 | 13F | Carson Advisory Inc. | 18 970 | 0,00 | 684 | 5,40 | ||||
| 2025-08-12 | 13F | Jpmorgan Chase & Co | 15 827 | 19,97 | 571 | 26,39 | ||||
| 2025-07-30 | 13F | Greenup Street Wealth Management Llc | 6 540 | 4,11 | 236 | 9,81 | ||||
| 2025-07-22 | 13F | Wealthcare Advisory Partners LLC | 5 860 | 0,00 | 211 | 5,50 | ||||
| 2025-07-30 | 13F | Whittier Trust Co | 12 433 | 0,00 | 448 | 5,41 | ||||
| 2025-05-09 | 13F | Avalon Trust Co | 0 | −100,00 | 0 | |||||
| 2025-07-24 | 13F | rebel Financial LLC | 29 542 | 1 065 | ||||||
| 2025-08-08 | 13F | Emerald Investment Partners, Llc | 22 427 | −25,79 | 808 | −21,78 | ||||
| 2025-07-25 | 13F | Joel Adams & Associates, Inc. | 9 686 | 349 | ||||||
| 2025-07-28 | 13F | Harbour Investments, Inc. | 1 829 | 20,49 | 66 | 27,45 | ||||
| 2025-08-14 | 13F | Stifel Financial Corp | 17 473 | 2,21 | 630 | 7,71 | ||||
| 2025-08-15 | 13F | Urban Financial Advisory Corp | 682 | 0,00 | 25 | 4,35 | ||||
| 2025-08-11 | 13F | Greykasell Wealth Strategies, Inc. | 1 834 | 0,00 | 66 | 6,45 |