Grundläggande statistik
| Institutionella ägare | 106 total, 105 long only, 0 short only, 1 long/short - change of 24,42% MRQ |
| Genomsnittlig portföljallokering | 0.2307 % - change of 1,14% MRQ |
| Institutionella aktier (lång) | 2 512 213 (ex 13D/G) - change of 0,29MM shares 13,09% MRQ |
| Institutionellt värde (lång) | $ 223 349 USD ($1000) |
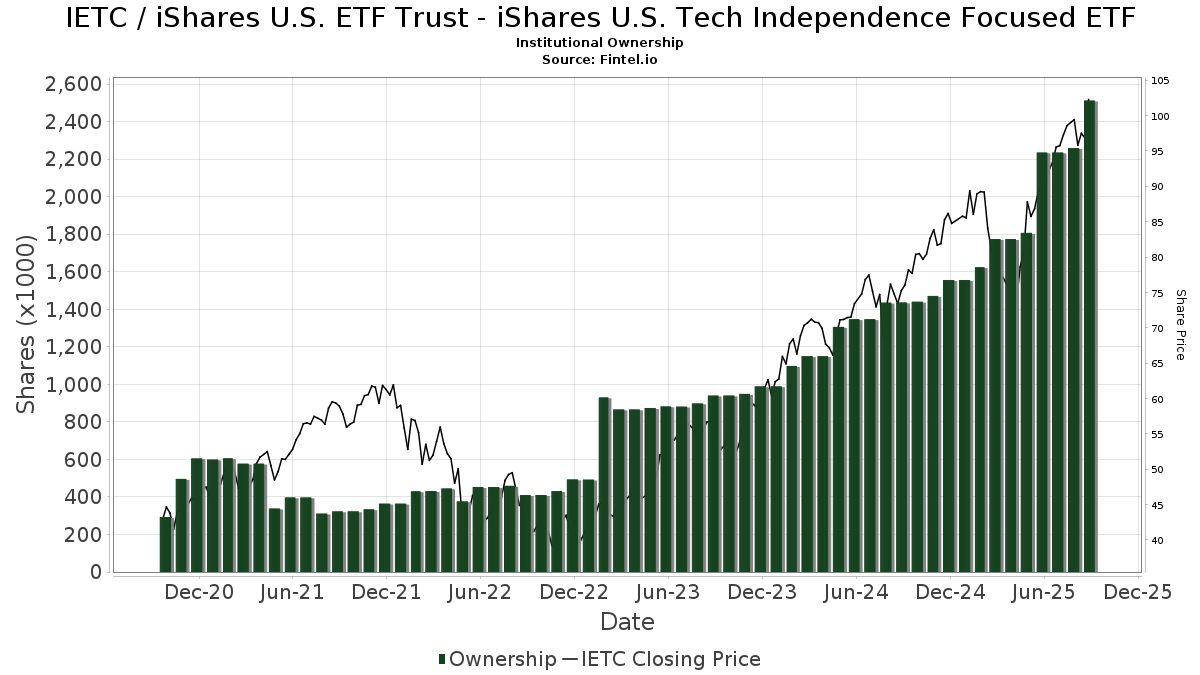
Institutionellt ägande och aktieägare
iShares U.S. ETF Trust - iShares U.S. Tech Independence Focused ETF (US:IETC) har 106 Institutionella ägare och aktieägare som har lämnat in 13D/G- eller 13F-formulär till Securities Exchange Commission (SEC). Dessa institut innehar totalt 2,512,213 aktier. Största aktieägare inkluderar Kozak & Associates, Inc., Mirae Asset Global Investments Co., Ltd., Beacon Harbor Wealth Advisors, Inc., Gradient Investments LLC, Jpmorgan Chase & Co, LPL Financial LLC, Mml Investors Services, Llc, Raymond James Financial Inc, Integrated Wealth Concepts LLC, and Apexium Financial, Lp .
iShares U.S. ETF Trust - iShares U.S. Tech Independence Focused ETF (BATS:IETC) Institutionell ägarstruktur visar institutioners och fonders nuvarande positioner i företaget, samt de senaste förändringarna i positionernas storlek. Större aktieägare kan vara enskilda investerare, fonder, hedgefonder eller institutioner. Bilaga 13D visar att investeraren äger (eller ägde) mer än 5% av företaget och avser (eller avsåg) att aktivt eftersträva en förändring av affärsstrategin. Schedule 13G indikerar en passiv investering på över 5%.
The share price as of September 8, 2025 is 99,55 / share. Previously, on September 9, 2024, the share price was 72,38 / share. This represents an increase of 37,54% over that period.
Fondsentimentets poäng
Fondsentimentet poängen(fka Ägarackumulation-poäng) visar vilka aktier som är mest köpta av fonder. Det är resultatet av en sofistikerad kvantitativ flerfaktormodell som identifierar företag med de högsta nivåerna av institutionell ackumulering. Poängsättningsmodellen använder en kombination av den totala ökningen av redovisade ägare, förändringarna i portföljallokeringarna för dessa ägare och andra mått. Siffran sträcker sig från 0 till 100, där högre siffror indikerar en högre nivå av ackumulering i förhållande till sina konkurrenter, och 50 är genomsnittet.
Uppdateringsfrekvens: Dagligen
Se Ownership Explorer, som innehåller en lista över de högst rankade företagen.
Institutionell sälj/köp-kvot
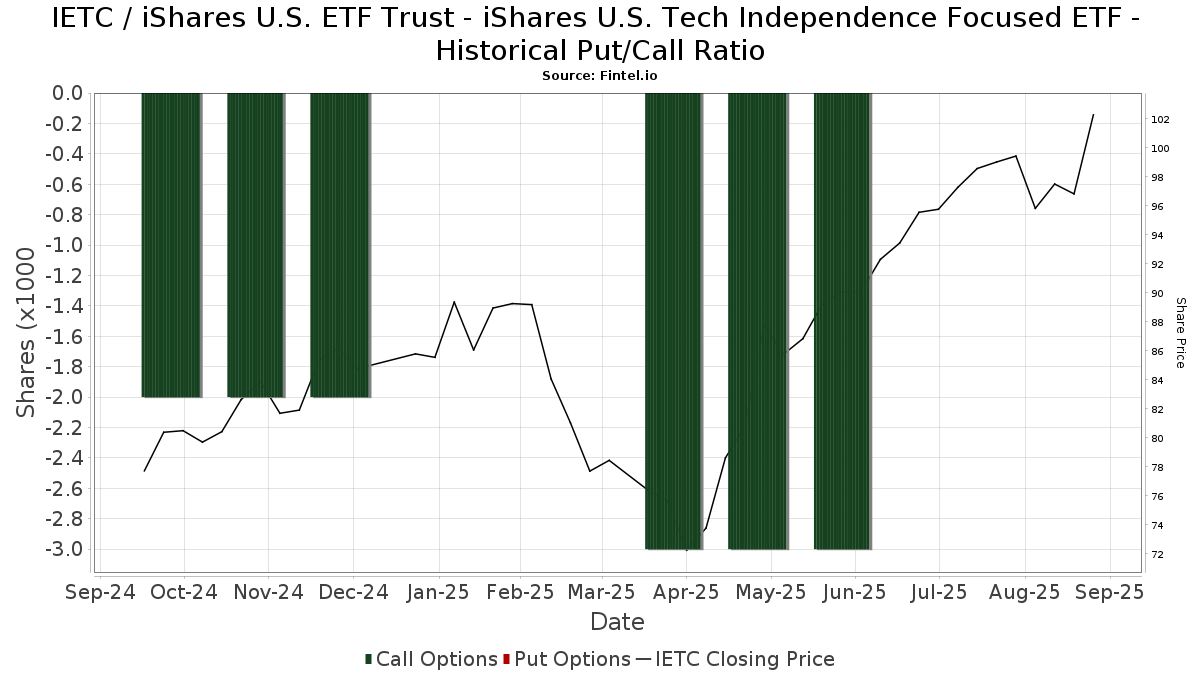
Förutom att rapportera vanliga eget kapital- och skuldemissioner måste institutioner med mer än 100MM tillgångar under förvaltning också avslöja sina innehav av sälj- och köpoptioner. Eftersom säljoptioner i allmänhet indikerar ett negativt sentiment och köpoptioner indikerar ett positivt sentiment, kan vi få en uppfattning om det övergripande institutionella sentimentet genom att plotta förhållandet mellan säljoptioner och köpoptioner. Diagrammet till höger visar det historiska förhållandet mellan sälj- och köpoptioner för detta instrument.
Genom att använda sälj/köp-kvoten som en indikator på aktieägarnas sentiment undviker man en av de största bristerna med att använda det totala institutionella ägandet, nämligen att en betydande del av de förvaltade tillgångarna investeras passivt för att följa index. Passivt förvaltade fonder köper vanligtvis inte optioner, så indikatorn för sälj/köp-kvoten ger en bättre bild av stämningen i aktivt förvaltade fonder.
13F- och NPORT-arkiveringar
Detaljer om 13F-arkiveringar är gratis. Detaljer om NP-arkiveringar kräver ett premiummedlemskap. Gröna rader indikerar nya positioner. Röda rader indikerar stängda positioner. Klicka på länk symbolen för att se hela transaktionshistoriken.
Uppgradera
för att låsa upp premiumdata och exportera till Excel ![]() .
.
| Fil Datum | Källa | Investerare | Typ | Genomsnittligt pris (beräknat) |
Aktier | Δ Aktier (%) |
Rapporterat värde (1000 USD) |
Δ Värde (%) |
Portföljallokering (%) |
|
|---|---|---|---|---|---|---|---|---|---|---|
| 2025-08-05 | 13F | Sigma Planning Corp | 8 667 | 13,35 | 815 | 42,06 | ||||
| 2025-07-10 | 13F | Sovran Advisors, LLC | 3 232 | 306 | ||||||
| 2025-07-02 | 13F | Central Pacific Bank - Trust Division | 71 | 0,00 | 7 | 20,00 | ||||
| 2025-05-12 | 13F | Fmr Llc | 0 | −100,00 | 0 | |||||
| 2025-07-29 | 13F | Mattson Financial Services, LLC | 22 382 | 10,51 | 2 104 | 38,63 | ||||
| 2025-08-04 | 13F | Assetmark, Inc | 21 624 | 70,24 | 2 033 | 113,67 | ||||
| 2025-08-12 | 13F | Steward Partners Investment Advisory, Llc | 267 | 25 | ||||||
| 2025-08-14 | 13F | Citadel Advisors Llc | 0 | −100,00 | 0 | |||||
| 2025-05-15 | 13F | Mariner, LLC | 0 | −100,00 | 0 | |||||
| 2025-08-13 | 13F | Northwestern Mutual Wealth Management Co | 45 676 | 740,10 | 4 294 | 954,79 | ||||
| 2025-08-06 | 13F | Mascagni Wealth Management, Inc. | 4 840 | 455 | ||||||
| 2025-08-12 | 13F | Proequities, Inc. | 0 | 0 | ||||||
| 2025-08-01 | 13F | Bessemer Group Inc | 2 165 | 0 | ||||||
| 2025-08-01 | 13F | Belvedere Trading LLC | Call | 3 900 | 367 | |||||
| 2025-08-01 | 13F | Belvedere Trading LLC | Put | 200 | 19 | |||||
| 2025-07-25 | 13F | Atria Wealth Solutions, Inc. | 55 773 | −4,40 | 5 243 | 19,90 | ||||
| 2025-07-08 | 13F | Gradient Investments LLC | 123 960 | 16,34 | 11 652 | 45,94 | ||||
| 2025-07-30 | 13F | TFB Advisors LLC | 4 080 | 34,65 | 384 | 68,72 | ||||
| 2025-08-15 | 13F | Equitable Holdings, Inc. | 8 508 | 2,43 | 800 | 28,46 | ||||
| 2025-08-05 | 13F | Tsfg, Llc | 100 | 0,00 | 0 | |||||
| 2025-07-24 | 13F | IFP Advisors, Inc | 45 | 4 | ||||||
| 2025-07-22 | 13F | Sutton Place Investors Llc | 27 491 | 0,42 | 2 584 | 25,99 | ||||
| 2025-08-11 | 13F | Regal Investment Advisors LLC | 4 428 | 0,05 | 416 | 25,68 | ||||
| 2025-07-28 | 13F | Private Wealth Asset Management, LLC | 267 | 0,00 | 25 | 25,00 | ||||
| 2025-08-14 | 13F | GWM Advisors LLC | 6 677 | 1 012,83 | 628 | 1 325,00 | ||||
| 2025-08-12 | 13F | Jpmorgan Chase & Co | 103 959 | 228,16 | 9 772 | 311,63 | ||||
| 2025-08-12 | 13F | BlackRock, Inc. | 62 | 0,00 | 6 | 25,00 | ||||
| 2025-07-21 | 13F | Ameritas Advisory Services, LLC | 12 951 | −26,95 | 1 217 | −18,43 | ||||
| 2025-08-14 | 13F | Hilltop Holdings Inc. | 2 167 | 204 | ||||||
| 2025-08-01 | 13F | Rossby Financial, LCC | 8 | 0,00 | 1 | |||||
| 2025-08-14 | 13F | Wells Fargo & Company/mn | 0 | 0 | ||||||
| 2025-07-29 | 13F | Hoese & Co LLP | 1 165 | 110 | ||||||
| 2025-07-08 | 13F | RMR Wealth Builders | 8 398 | −0,34 | 789 | 25,04 | ||||
| 2025-07-23 | 13F | Lansing Street Advisors | 12 331 | 5,82 | 1 159 | 32,76 | ||||
| 2025-08-13 | 13F | Continuum Advisory, LLC | 0 | −100,00 | 0 | |||||
| 2025-08-14 | 13F | Wiley Bros.-aintree Capital, Llc | 9 339 | 13,75 | 878 | 42,14 | ||||
| 2025-07-31 | 13F | Cambridge Investment Research Advisors, Inc. | 30 224 | 16,86 | 3 | 100,00 | ||||
| 2025-08-14 | 13F | Icon Wealth Advisors, LLC | 4 715 | 0,11 | 443 | 25,85 | ||||
| 2025-08-11 | 13F | Principal Securities, Inc. | 1 187 | 3 993,10 | 112 | 5 450,00 | ||||
| 2025-08-05 | 13F | Simplex Trading, Llc | 0 | −100,00 | 0 | |||||
| 2025-07-10 | 13F | Wealth Enhancement Advisory Services, Llc | 2 465 | 234 | ||||||
| 2025-08-08 | 13F | Creative Planning | 5 265 | −0,49 | 495 | 24,75 | ||||
| 2025-07-09 | 13F | Pallas Capital Advisors LLC | 2 383 | −81,44 | 224 | −76,80 | ||||
| 2025-08-08 | 13F | Beacon Harbor Wealth Advisors, Inc. | 129 257 | 12 150 | ||||||
| 2025-07-08 | 13F | Zrc Wealth Management, Llc | 1 | 0,00 | 0 | |||||
| 2025-08-08 | 13F | KM Capital Management Ltd. | 16 548 | −6,78 | 1 556 | 16,92 | ||||
| 2025-08-14 | 13F | Glen Eagle Advisors, LLC | 5 631 | 1,24 | 529 | 27,16 | ||||
| 2025-07-17 | 13F | Sound Income Strategies, LLC | 176 | 0,00 | 17 | 23,08 | ||||
| 2025-08-12 | 13F | Vestor Capital, Llc | 2 034 | 0 | ||||||
| 2025-08-04 | 13F | Spire Wealth Management | 20 | 0,00 | 2 | 0,00 | ||||
| 2025-07-22 | 13F | Bay Harbor Wealth Management, LLC | 5 849 | 0,00 | 550 | 25,34 | ||||
| 2025-08-06 | 13F | AE Wealth Management LLC | 10 959 | 16,02 | 1 030 | 45,69 | ||||
| 2025-08-14 | 13F | Comerica Bank | 317 | 30 | ||||||
| 2025-08-08 | 13F | Advisors Capital Management, LLC | 14 661 | 2,13 | 1 378 | 28,19 | ||||
| 2025-07-11 | 13F | Farther Finance Advisors, LLC | 398 | −5,01 | 37 | 19,35 | ||||
| 2025-08-08 | 13F | Comprehensive Financial Planning, Inc./PA | 4 793 | 13,61 | 451 | 42,41 | ||||
| 2025-07-08 | 13F | Ehrlich Financial Group | 2 790 | 262 | ||||||
| 2025-07-18 | 13F | Parsons Capital Management Inc/ri | 3 288 | 0,00 | 309 | 25,61 | ||||
| 2025-08-14 | 13F | Mml Investors Services, Llc | 98 609 | −4,83 | 9 | 28,57 | ||||
| 2025-07-24 | 13F | Fischer Investment Strategies, Llc | 2 932 | 276 | ||||||
| 2025-08-08 | 13F | Larson Financial Group LLC | 137 | 21,24 | 13 | 50,00 | ||||
| 2025-08-12 | 13F | LPL Financial LLC | 100 891 | 73,12 | 9 484 | 117,15 | ||||
| 2025-07-23 | 13F | BankPlus Trust Department | 71 | 0,00 | 7 | 20,00 | ||||
| 2025-08-13 | 13F | BCJ Capital Management, LLC | 54 527 | 20,18 | 5 126 | 50,74 | ||||
| 2025-08-14 | 13F | Federation des caisses Desjardins du Quebec | 708 | 0,00 | 67 | 24,53 | ||||
| 2025-08-14 | 13F | Kovitz Investment Group Partners, LLC | 5 125 | 482 | ||||||
| 2025-08-14 | 13F | McIlrath & Eck, LLC | 293 | 0,00 | 28 | 28,57 | ||||
| 2025-08-11 | 13F | Western Wealth Management, LLC | 2 258 | 212 | ||||||
| 2025-08-07 | 13F | Cascade Financial Partners, LLC | 2 250 | 212 | ||||||
| 2025-08-12 | 13F | Global Retirement Partners, LLC | 10 613 | 998 | ||||||
| 2025-07-23 | 13F | Ironwood Financial, llc | 11 018 | 0,00 | 826 | 0,00 | ||||
| 2025-08-13 | 13F | WCG Wealth Advisors LLC | 10 736 | 1 009 | ||||||
| 2025-08-14 | 13F | Jane Street Group, Llc | 11 875 | 1 116 | ||||||
| 2025-08-14 | 13F | Integrated Wealth Concepts LLC | 71 020 | −5,76 | 6 676 | 18,20 | ||||
| 2025-08-08 | 13F | Cetera Investment Advisers | 3 622 | 11,07 | 340 | 39,34 | ||||
| 2025-08-01 | 13F | Envestnet Asset Management Inc | 10 977 | 31,92 | 1 032 | 65,49 | ||||
| 2025-08-14 | 13F | Old Mission Capital Llc | 3 199 | 301 | ||||||
| 2025-08-13 | 13F | GeoWealth Management, LLC | 49 695 | 143,85 | 4 671 | 205,89 | ||||
| 2025-07-24 | 13F | Us Bancorp \de\ | 50 | 0,00 | 5 | 33,33 | ||||
| 2025-08-05 | 13F | Lord & Richards Wealth Management, LLC | 0 | −100,00 | 0 | |||||
| 2025-08-14 | 13F | Two Sigma Investments, Lp | 17 500 | −77,45 | 1 645 | −71,71 | ||||
| 2025-08-15 | 13F | Morgan Stanley | 3 096 | −5,03 | 291 | 19,26 | ||||
| 2025-05-13 | 13F | Bank Of Montreal /can/ | 0 | −100,00 | 0 | |||||
| 2025-08-13 | 13F | Cerity Partners LLC | 4 395 | 0,05 | 413 | 25,53 | ||||
| 2025-07-28 | 13F | Harbour Investments, Inc. | 91 | 0,00 | 9 | 33,33 | ||||
| 2025-07-07 | 13F | Nova Wealth Management, Inc. | 3 140 | 232,28 | 295 | 321,43 | ||||
| 2025-07-10 | 13F | Worth Asset Management, LLC | 2 768 | 260 | ||||||
| 2025-08-14 | 13F | Raymond James Financial Inc | 85 517 | 0,93 | 8 039 | 26,60 | ||||
| 2025-05-13 | 13F | UBS Group AG | 0 | −100,00 | 0 | |||||
| 2025-07-25 | 13F | Cwm, Llc | 256 | 0,00 | 0 | |||||
| 2025-07-10 | 13F | Signal Advisors Wealth, LLC | 2 657 | 250 | ||||||
| 2025-08-13 | 13F | Jones Financial Companies Lllp | 1 431 | 3 477,50 | 133 | 4 333,33 | ||||
| 2025-09-04 | 13F/A | Advisor Group Holdings, Inc. | 38 972 | 20,93 | 3 648 | 51,01 | ||||
| 2025-07-21 | 13F | Mirae Asset Global Investments Co., Ltd. | 140 751 | −30,74 | 13 231 | −13,41 | ||||
| 2025-07-15 | 13F | Financial Partners Group, Inc | 4 234 | 2,64 | 398 | 28,80 | ||||
| 2025-07-17 | 13F | HB Wealth Management, LLC | 2 500 | 235 | ||||||
| 2025-07-22 | 13F | Apexium Financial, Lp | 66 932 | 323,81 | 6 292 | 431,78 | ||||
| 2025-07-30 | 13F | Financial Perspectives, Inc | 10 708 | 4,52 | 1 007 | 23,44 | ||||
| 2025-07-18 | 13F | Truist Financial Corp | 20 427 | 0,19 | 1 920 | 25,74 | ||||
| 2025-08-13 | 13F | Haverford Trust Co | 3 115 | 0,00 | 293 | 25,32 | ||||
| 2025-08-14 | 13F | Stifel Financial Corp | 48 758 | −42,19 | 4 583 | −27,50 | ||||
| 2025-08-06 | 13F | Kcm Investment Advisors Llc | 9 636 | 0,00 | 906 | 25,35 | ||||
| 2025-08-14 | 13F | Royal Bank Of Canada | 6 374 | 15,16 | 599 | 44,34 | ||||
| 2025-08-14 | 13F | Susquehanna International Group, Llp | 21 932 | −66,62 | 2 062 | −58,14 | ||||
| 2025-07-10 | 13F | Kozak & Associates, Inc. | 682 461 | 0,48 | 65 209 | 29,76 | ||||
| 2025-07-15 | 13F | Patriot Investment Management Inc. | 11 009 | 1,28 | 1 035 | 27,03 | ||||
| 2025-07-23 | 13F | Richardson Capital Management LLC | 1 008 | 1,41 | 95 | 27,03 | ||||
| 2025-08-04 | 13F | Keybank National Association/oh | 27 304 | 2 567 | ||||||
| 2025-08-07 | 13F | Efficient Advisors, LLC | 17 985 | 62,69 | 1 691 | 104,11 | ||||
| 2025-08-15 | 13F | Tower Research Capital LLC (TRC) | 24 021 | 69,09 | 2 258 | 112,12 | ||||
| 2025-08-07 | 13F | Montag A & Associates Inc | 2 691 | −30,88 | 253 | −13,40 | ||||
| 2025-08-25 | 13F | Fulcrum Equity Management | 0 | −100,00 | 0 | |||||
| 2025-07-10 | 13F | Shira Ridge Wealth Management | 17 203 | −0,71 | 1 617 | 24,58 | ||||
| 2025-07-31 | 13F | Moloney Securities Asset Management, LLC | 7 735 | 0,00 | 727 | 25,56 | ||||
| 2025-08-15 | 13F | Kestra Advisory Services, LLC | 3 820 | 359 | ||||||
| 2025-08-06 | 13F | Commonwealth Equity Services, Llc | 11 269 | −9,88 | 1 | |||||
| 2025-08-14 | 13F | Goldman Sachs Group Inc | 24 717 | 70,15 | 2 323 | 113,51 | ||||
| 2025-08-07 | 13F | Allworth Financial LP | 1 600 | 0,00 | 150 | 22,95 |