Grundläggande statistik
| Institutionella ägare | 141 total, 141 long only, 0 short only, 0 long/short - change of −2,07% MRQ |
| Genomsnittlig portföljallokering | 0.0438 % - change of −25,13% MRQ |
| Institutionella aktier (lång) | 19 425 703 (ex 13D/G) - change of 1,44MM shares 8,02% MRQ |
| Institutionellt värde (lång) | $ 78 232 USD ($1000) |
Institutionellt ägande och aktieägare
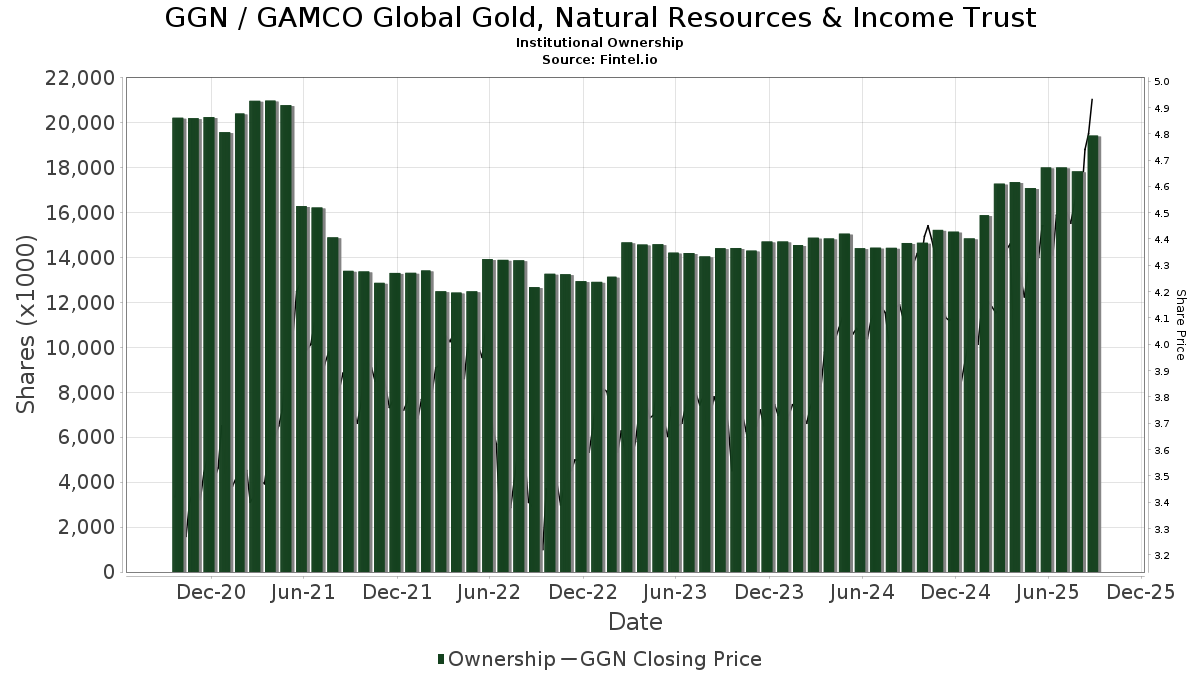
GAMCO Global Gold, Natural Resources & Income Trust (US:GGN) har 141 Institutionella ägare och aktieägare som har lämnat in 13D/G- eller 13F-formulär till Securities Exchange Commission (SEC). Dessa institut innehar totalt 19,425,703 aktier. Största aktieägare inkluderar Morgan Stanley, Formidable Asset Management, LLC, Sovran Advisors, LLC, Bank Of America Corp /de/, Cornerstone Advisors, LLC, Wells Fargo & Company/mn, Janney Montgomery Scott LLC, Commonwealth Equity Services, Llc, Private Advisor Group, LLC, and Advisor Group Holdings, Inc. .
GAMCO Global Gold, Natural Resources & Income Trust (NYSEAM:GGN) Institutionell ägarstruktur visar institutioners och fonders nuvarande positioner i företaget, samt de senaste förändringarna i positionernas storlek. Större aktieägare kan vara enskilda investerare, fonder, hedgefonder eller institutioner. Bilaga 13D visar att investeraren äger (eller ägde) mer än 5% av företaget och avser (eller avsåg) att aktivt eftersträva en förändring av affärsstrategin. Schedule 13G indikerar en passiv investering på över 5%.
The share price as of September 12, 2025 is 4,99 / share. Previously, on September 16, 2024, the share price was 4,23 / share. This represents an increase of 17,97% over that period.
Fondsentimentets poäng
Fondsentimentet poängen(fka Ägarackumulation-poäng) visar vilka aktier som är mest köpta av fonder. Det är resultatet av en sofistikerad kvantitativ flerfaktormodell som identifierar företag med de högsta nivåerna av institutionell ackumulering. Poängsättningsmodellen använder en kombination av den totala ökningen av redovisade ägare, förändringarna i portföljallokeringarna för dessa ägare och andra mått. Siffran sträcker sig från 0 till 100, där högre siffror indikerar en högre nivå av ackumulering i förhållande till sina konkurrenter, och 50 är genomsnittet.
Uppdateringsfrekvens: Dagligen
Se Ownership Explorer, som innehåller en lista över de högst rankade företagen.
Institutionell sälj/köp-kvot
Förutom att rapportera vanliga eget kapital- och skuldemissioner måste institutioner med mer än 100MM tillgångar under förvaltning också avslöja sina innehav av sälj- och köpoptioner. Eftersom säljoptioner i allmänhet indikerar ett negativt sentiment och köpoptioner indikerar ett positivt sentiment, kan vi få en uppfattning om det övergripande institutionella sentimentet genom att plotta förhållandet mellan säljoptioner och köpoptioner. Diagrammet till höger visar det historiska förhållandet mellan sälj- och köpoptioner för detta instrument.
Genom att använda sälj/köp-kvoten som en indikator på aktieägarnas sentiment undviker man en av de största bristerna med att använda det totala institutionella ägandet, nämligen att en betydande del av de förvaltade tillgångarna investeras passivt för att följa index. Passivt förvaltade fonder köper vanligtvis inte optioner, så indikatorn för sälj/köp-kvoten ger en bättre bild av stämningen i aktivt förvaltade fonder.
13F- och NPORT-arkiveringar
Detaljer om 13F-arkiveringar är gratis. Detaljer om NP-arkiveringar kräver ett premiummedlemskap. Gröna rader indikerar nya positioner. Röda rader indikerar stängda positioner. Klicka på länk symbolen för att se hela transaktionshistoriken.
Uppgradera
för att låsa upp premiumdata och exportera till Excel ![]() .
.
| Fil Datum | Källa | Investerare | Typ | Genomsnittligt pris (beräknat) |
Aktier | Δ Aktier (%) |
Rapporterat värde (1000 USD) |
Δ Värde (%) |
Portföljallokering (%) |
|
|---|---|---|---|---|---|---|---|---|---|---|
| 2025-07-09 | 13F | Massmutual Trust Co Fsb/adv | 390 | 0,00 | 2 | 0,00 | ||||
| 2025-08-14 | 13F | Wells Fargo & Company/mn | 689 353 | 9,57 | 3 026 | 10,08 | ||||
| 2025-08-19 | 13F | National Asset Management, Inc. | 37 906 | −7,89 | 166 | 7,10 | ||||
| 2025-08-04 | 13F | Creative Financial Designs Inc /adv | 13 604 | 1,59 | 60 | 1,72 | ||||
| 2025-05-14 | 13F | Jane Street Group, Llc | 0 | −100,00 | 0 | |||||
| 2025-08-14 | 13F | Wealth Preservation Advisors, LLC | 60 | 0,00 | 0 | |||||
| 2025-07-17 | 13F | Barry Investment Advisors, LLC | 11 429 | 0,00 | 50 | 2,04 | ||||
| 2025-07-29 | 13F | Stratos Wealth Partners, LTD. | 38 915 | 3,70 | 171 | 4,29 | ||||
| 2025-08-08 | 13F | Advisors Capital Management, LLC | 22 275 | 0,00 | 98 | 0,00 | ||||
| 2025-08-07 | 13F | Nwam Llc | 70 289 | 32,14 | 309 | 32,76 | ||||
| 2025-08-06 | 13F | Commonwealth Equity Services, Llc | 662 917 | −3,14 | 3 | 0,00 | ||||
| 2025-08-05 | 13F | Huntington National Bank | 2 | −83,33 | ||||||
| 2025-08-12 | 13F | Global Retirement Partners, LLC | 2 170 | 0,00 | 10 | 12,50 | ||||
| 2025-08-22 | NP | Cornerstone Total Return Fund Inc | 247 518 | 92,59 | 1 087 | 93,58 | ||||
| 2025-08-06 | 13F | Vantage Financial Partners, LLC | 24 311 | −30,44 | 107 | −30,26 | ||||
| 2025-08-08 | 13F | Cornerstone Advisors, LLC | 754 825 | 90,16 | 3 314 | 91,06 | ||||
| 2025-07-15 | 13F | Fortitude Family Office, LLC | 43 000 | 0,00 | 189 | 0,53 | ||||
| 2025-07-02 | 13F | Capital Market Strategies LLC | 40 052 | −6,89 | 176 | −6,42 | ||||
| 2025-07-29 | 13F | International Assets Investment Management, Llc | 45 737 | 0,07 | 201 | 0,50 | ||||
| 2025-08-14 | 13F | Colony Group, LLC | 25 139 | 9,30 | 110 | 10,00 | ||||
| 2025-08-14 | 13F | GWM Advisors LLC | 5 458 | −6,27 | 24 | −8,00 | ||||
| 2025-07-18 | 13F | PFG Investments, LLC | 80 151 | 1,24 | 352 | 1,74 | ||||
| 2025-08-12 | 13F | XTX Topco Ltd | 0 | −100,00 | 0 | |||||
| 2025-07-10 | 13F | Sovran Advisors, LLC | 975 152 | −3,77 | 4 330 | −0,64 | ||||
| 2025-08-14 | 13F | Mml Investors Services, Llc | 21 274 | −4,65 | 0 | |||||
| 2025-08-12 | 13F | Virtu Financial LLC | 31 837 | 0 | ||||||
| 2025-07-30 | 13F | Tricadia Capital Management, LLC | 103 471 | −4,19 | 454 | −3,61 | ||||
| 2025-05-06 | 13F | Pinnacle Associates Ltd | 0 | −100,00 | 0 | −100,00 | ||||
| 2025-08-04 | 13F | L.m. Kohn & Company | 31 904 | 0,00 | 140 | 0,72 | ||||
| 2025-07-07 | 13F | Medici Capital Llc | 0 | −100,00 | 0 | |||||
| 2025-08-04 | 13F | Assetmark, Inc | 3 900 | 17 | ||||||
| 2025-07-17 | 13F | Sound Income Strategies, LLC | 635 | 0,00 | 3 | 0,00 | ||||
| 2025-08-04 | 13F | Live Oak Private Wealth LLC | 63 152 | 0,00 | 277 | 0,73 | ||||
| 2025-08-13 | 13F | Jones Financial Companies Lllp | 0 | −100,00 | 0 | −100,00 | ||||
| 2025-08-13 | 13F | StoneX Group Inc. | 22 465 | −0,77 | 99 | 0,00 | ||||
| 2025-07-22 | 13F | Coastal Investment Advisors, Inc. | 11 480 | 0,00 | 50 | 0,00 | ||||
| 2025-08-08 | 13F | Cetera Investment Advisers | 447 415 | −8,67 | 1 964 | −8,22 | ||||
| 2025-08-04 | 13F | Spire Wealth Management | 0 | −100,00 | 0 | |||||
| 2025-08-04 | 13F | Wolverine Asset Management Llc | 53 283 | 289,18 | 234 | 294,92 | ||||
| 2025-08-11 | 13F | Tidemark, LLC | 598 | 0,00 | 3 | 0,00 | ||||
| 2025-08-11 | 13F | Private Advisor Group, LLC | 572 887 | 23,39 | 2 515 | 23,90 | ||||
| 2025-08-13 | 13F | Beacon Pointe Advisors, LLC | 19 271 | −3,93 | 85 | −3,45 | ||||
| 2025-08-13 | 13F | Baird Financial Group, Inc. | 98 070 | 18,14 | 431 | 18,78 | ||||
| 2025-08-07 | 13F | Montag A & Associates Inc | 9 287 | 0,00 | 41 | 0,00 | ||||
| 2025-08-18 | 13F | Ashford Capital Management Inc | 146 000 | 0,00 | 641 | 0,31 | ||||
| 2025-08-14 | 13F | Royal Bank Of Canada | 263 658 | 4,64 | 1 157 | 5,09 | ||||
| 2025-08-12 | 13F | O'shaughnessy Asset Management, Llc | 11 672 | 2,08 | 51 | 4,08 | ||||
| 2025-05-13 | 13F | EverSource Wealth Advisors, LLC | 0 | −100,00 | 0 | |||||
| 2025-08-01 | 13F | Vision Financial Markets Llc | 415 | 2,22 | 2 | 0,00 | ||||
| 2025-09-09 | 13F | NWF Advisory Services Inc. | 112 628 | −3,01 | 494 | −2,56 | ||||
| 2025-04-22 | 13F | Synergy Financial Management, LLC | 0 | −100,00 | 0 | |||||
| 2025-08-08 | 13F | Calamos Advisors LLC | 35 566 | 156 | ||||||
| 2025-07-25 | 13F | Sequoia Financial Advisors, LLC | 26 488 | 28,91 | 116 | 30,34 | ||||
| 2025-05-15 | 13F | Gwn Securities Inc. | 0 | −100,00 | 0 | |||||
| 2025-08-06 | 13F | Wedbush Securities Inc | 38 047 | 1,47 | 0 | |||||
| 2025-08-12 | 13F | Steward Partners Investment Advisory, Llc | 0 | −100,00 | 0 | |||||
| 2025-07-16 | 13F | Formidable Asset Management, LLC | 1 809 051 | 0,00 | 7 906 | 0,00 | ||||
| 2025-08-05 | 13F | Atlas Private Wealth Advisors | 0 | −100,00 | 0 | |||||
| 2025-08-07 | 13F | Allworth Financial LP | 23 510 | 167,19 | 103 | 178,38 | ||||
| 2025-08-12 | 13F | Jpmorgan Chase & Co | 0 | −100,00 | 0 | |||||
| 2025-07-18 | 13F | Trust Co Of Vermont | 1 300 | 0,00 | 6 | 0,00 | ||||
| 2025-07-23 | 13F | WESPAC Advisors, LLC | 33 000 | 0,00 | 145 | 0,00 | ||||
| 2025-08-22 | NP | Cornerstone Strategic Value Fund Inc | 507 307 | 89,00 | 2 227 | 90,02 | ||||
| 2025-08-12 | 13F | Insigneo Advisory Services, Llc | 39 332 | 0,00 | 173 | 0,58 | ||||
| 2025-05-13 | 13F | Bokf, Na | 0 | −100,00 | 0 | −100,00 | ||||
| 2025-04-15 | 13F | Transform Wealth, LLC | 23 167 | 0,00 | 101 | 16,09 | ||||
| 2025-07-11 | 13F | Farther Finance Advisors, LLC | 48 010 | 211 | ||||||
| 2025-08-14 | 13F | Ieq Capital, Llc | 0 | −100,00 | 0 | |||||
| 2025-08-14 | 13F | Stifel Financial Corp | 295 887 | 11,88 | 1 299 | 12,38 | ||||
| 2025-08-19 | 13F | Newbridge Financial Services Group, Inc. | 57 437 | 252 | ||||||
| 2025-04-21 | 13F | Nelson, Van Denburg & Campbell Wealth Management Group, LLC | 0 | −100,00 | 0 | |||||
| 2025-05-15 | 13F | Tower Research Capital LLC (TRC) | 0 | −100,00 | 0 | |||||
| 2025-08-06 | 13F | Golden State Wealth Management, LLC | 520 | 0,00 | 2 | 0,00 | ||||
| 2025-04-29 | 13F | Envestnet Asset Management Inc | 0 | −100,00 | 0 | |||||
| 2025-07-25 | 13F | Cwm, Llc | 400 | −38,46 | 0 | |||||
| 2025-08-12 | 13F | LPL Financial LLC | 436 429 | −1,81 | 1 916 | −1,39 | ||||
| 2025-07-30 | 13F | Capital Wealth Alliance, LLC | 315 083 | −54,00 | 1 383 | −61,74 | ||||
| 2025-08-12 | 13F | Park Square Financial Group, LLC | 0 | −100,00 | 0 | |||||
| 2025-08-04 | 13F | Creekmur Asset Management LLC | 1 065 | 2,11 | 5 | 0,00 | ||||
| 2025-08-08 | 13F | Maple Capital Management, Inc. | 0 | −100,00 | 0 | |||||
| 2025-08-14 | 13F | Df Dent & Co Inc | 23 470 | 0,00 | 103 | 0,98 | ||||
| 2025-08-19 | 13F | Advisory Services Network, LLC | 15 797 | 0,00 | 70 | 1,45 | ||||
| 2025-07-31 | 13F | Optimum Investment Advisors | 281 692 | 3,21 | 1 237 | 3,69 | ||||
| 2025-08-04 | 13F | Mesirow Financial Investment Management, Inc. | 0 | −100,00 | 0 | |||||
| 2025-04-23 | 13F | Financial Life Planners | 0 | −100,00 | 0 | |||||
| 2025-05-15 | 13F | Hrt Financial Lp | 0 | −100,00 | 0 | |||||
| 2025-07-24 | 13F | Total Wealth Planning & Management, Inc. | 101 751 | 0,02 | 447 | 0,45 | ||||
| 2025-08-15 | 13F | Morgan Stanley | 3 319 075 | 1,90 | 14 571 | 2,37 | ||||
| 2025-07-30 | 13F | D.a. Davidson & Co. | 15 908 | −18,03 | 70 | −17,86 | ||||
| 2025-05-14 | 13F | Van Hulzen Asset Management, LLC | 0 | −100,00 | 0 | −100,00 | ||||
| 2025-07-16 | 13F | Brown, Lisle/cummings, Inc. | 23 193 | −7,71 | 102 | −7,34 | ||||
| 2025-08-11 | 13F | HighTower Advisors, LLC | 39 780 | 5,47 | 175 | 6,10 | ||||
| 2025-07-24 | 13F | Eastern Bank | 220 550 | 0,00 | 968 | 0,52 | ||||
| 2025-08-14 | 13F | Hurley Capital, LLC | 3 963 | 2,09 | 17 | 6,25 | ||||
| 2025-08-05 | 13F | Bank Of Montreal /can/ | 74 817 | 0,02 | 328 | 0,61 | ||||
| 2025-04-23 | 13F | GHP Investment Advisors, Inc. | 0 | −100,00 | 0 | |||||
| 2025-07-28 | 13F | RFG Advisory, LLC | 24 042 | 9,28 | 106 | 9,38 | ||||
| 2025-08-12 | 13F | Proequities, Inc. | 0 | 0 | ||||||
| 2025-08-12 | 13F | MAI Capital Management | 2 929 | 2,06 | 13 | 0,00 | ||||
| 2025-08-08 | 13F | Creative Planning | 15 931 | 14,36 | 70 | 15,00 | ||||
| 2025-07-28 | 13F | BRYN MAWR TRUST Co | 13 025 | 0,00 | 57 | 1,79 | ||||
| 2025-08-05 | 13F | Strategic Financial Concepts, LLC | 12 300 | 0,00 | 54 | 0,00 | ||||
| 2025-07-23 | 13F | Sachetta, LLC | 6 | 0,00 | 0 | |||||
| 2025-08-13 | 13F | Kayne Anderson Rudnick Investment Management Llc | 2 750 | 0,00 | 12 | 0,00 | ||||
| 2025-07-29 | 13F | Oxbow Advisors, LLC | 91 750 | 0,00 | 403 | 0,50 | ||||
| 2025-08-07 | 13F | Apeiron RIA LLC | 13 104 | 58 | ||||||
| 2025-05-16 | 13F | Coppell Advisory Solutions LLC | 0 | −100,00 | 0 | |||||
| 2025-08-07 | 13F | Samalin Investment Counsel, LLC | 0 | −100,00 | 0 | |||||
| 2025-04-17 | 13F | Grimes & Company, Inc. | 0 | −100,00 | 0 | |||||
| 2025-08-11 | 13F | Citigroup Inc | 3 | 0,00 | 0 | |||||
| 2025-08-14 | 13F | Kovitz Investment Group Partners, LLC | 23 167 | 102 | ||||||
| 2025-07-10 | 13F | High Net Worth Advisory Group LLC | 19 475 | 0,00 | 85 | 0,00 | ||||
| 2025-08-18 | 13F | N.E.W. Advisory Services LLC | 800 | 0,00 | 4 | 0,00 | ||||
| 2025-07-30 | 13F | Gables Capital Management Inc. | 3 333 | 0,00 | 15 | 0,00 | ||||
| 2025-08-15 | 13F | Equitable Holdings, Inc. | 0 | −100,00 | 0 | |||||
| 2025-07-25 | 13F | Atria Wealth Solutions, Inc. | 100 360 | −2,58 | 441 | −2,22 | ||||
| 2025-07-21 | 13F | Ashton Thomas Securities, Llc | 122 700 | 0,00 | 539 | 0,37 | ||||
| 2025-04-25 | 13F | Root Financial Partners, LLC | 0 | −100,00 | 0 | |||||
| 2025-07-22 | 13F | Merit Financial Group, LLC | 29 157 | 92,84 | 128 | 92,42 | ||||
| 2025-07-24 | 13F | IFP Advisors, Inc | 0 | −100,00 | 0 | |||||
| 2025-07-16 | 13F | Pacific Sage Partners, LLC | 17 345 | 0,00 | 76 | 1,33 | ||||
| 2025-07-23 | 13F | Tcfg Wealth Management, Llc | 50 240 | 0,00 | 221 | 0,46 | ||||
| 2025-07-31 | 13F | Moloney Securities Asset Management, LLC | 14 798 | 65 | ||||||
| 2025-08-06 | 13F | Moors & Cabot, Inc. | 213 900 | 0,00 | 939 | 0,54 | ||||
| 2025-08-14 | 13F | IPG Investment Advisors LLC | 10 000 | 44 | ||||||
| 2025-05-07 | 13F | Sheaff Brock Investment Advisors, LLC | 14 000 | 61 | ||||||
| 2025-07-15 | 13F | LVZ Advisors, Inc. | 36 191 | 0,00 | 159 | 0,00 | ||||
| 2025-07-24 | 13F | Comprehensive Money Management Services LLC | 69 896 | −0,57 | 307 | −0,33 | ||||
| 2025-08-13 | 13F | Continuum Advisory, LLC | 0 | −100,00 | 0 | |||||
| 2025-09-04 | 13F/A | Advisor Group Holdings, Inc. | 567 969 | 101,91 | 2 493 | 102,85 | ||||
| 2025-07-08 | 13F | Nbc Securities, Inc. | 4 000 | 0 | ||||||
| 2025-07-08 | 13F/A | Salem Investment Counselors Inc | 250 | 0,00 | 1 | 0,00 | ||||
| 2025-04-15 | 13F | Fifth Third Bancorp | 0 | −100,00 | 0 | |||||
| 2025-08-12 | 13F | Advisors Asset Management, Inc. | 380 045 | −0,31 | 1 668 | 0,12 | ||||
| 2025-08-14 | 13F | Mercer Global Advisors Inc /adv | 20 755 | 0,77 | 91 | 1,11 | ||||
| 2025-08-04 | 13F | Integrity Alliance, Llc. | 0 | −100,00 | 0 | |||||
| 2025-07-31 | 13F | Cambridge Investment Research Advisors, Inc. | 54 759 | −5,92 | 0 | |||||
| 2025-07-17 | 13F | Sonora Investment Management Group, LLC | 91 627 | 0,70 | 402 | 1,26 | ||||
| 2025-07-31 | 13F | Oppenheimer & Co Inc | 96 300 | 0,00 | 423 | 0,48 | ||||
| 2025-08-12 | 13F | Landscape Capital Management, L.l.c. | 101 937 | 150,07 | 448 | 151,12 | ||||
| 2025-08-14 | 13F | Federation des caisses Desjardins du Quebec | 1 000 | 0,00 | 4 | 0,00 | ||||
| 2025-07-14 | 13F | Acropolis Investment Management, LLC | 12 000 | 53 | ||||||
| 2025-08-14 | 13F | CoreCap Advisors, LLC | 4 000 | 18 | ||||||
| 2025-08-15 | 13F | Kestra Advisory Services, LLC | 180 338 | 1,62 | 792 | 2,06 | ||||
| 2025-07-16 | 13F | MJT & Associates Financial Advisory Group, Inc. | 0 | −100,00 | 0 | |||||
| 2025-07-23 | 13F | Detalus Advisors, LLC | 13 323 | 1,25 | 58 | 1,75 | ||||
| 2025-08-14 | 13F | Raymond James Financial Inc | 460 108 | 40,68 | 2 020 | 41,29 | ||||
| 2025-08-05 | 13F | Sigma Planning Corp | 83 917 | −1,19 | 368 | −0,81 | ||||
| 2025-05-15 | 13F | Two Sigma Securities, Llc | 0 | −100,00 | 0 | −100,00 | ||||
| 2025-08-07 | 13F | Kestra Private Wealth Services, Llc | 122 440 | −1,79 | 538 | −1,29 | ||||
| 2025-04-17 | 13F | FNY Investment Advisers, LLC | 0 | −100,00 | 0 | |||||
| 2025-07-29 | 13F | Stephens Inc /ar/ | 19 220 | 92,20 | 84 | 95,35 | ||||
| 2025-08-13 | 13F | Northwestern Mutual Wealth Management Co | 7 771 | 5,43 | 34 | 6,25 | ||||
| 2025-08-06 | 13F | Texas Yale Capital Corp. | 25 000 | 92,31 | 110 | 94,64 | ||||
| 2025-08-13 | 13F | Truvestments Capital Llc | 202 | 0,00 | 1 | |||||
| 2025-07-30 | 13F | Onyx Bridge Wealth Group LLC | 28 024 | 0,86 | 123 | 1,65 | ||||
| 2025-08-05 | 13F | Freestone Capital Holdings, LLC | 13 100 | 2,07 | 58 | 1,79 | ||||
| 2025-07-17 | 13F | Janney Montgomery Scott LLC | 671 537 | 54,73 | 3 | 100,00 | ||||
| 2025-07-18 | 13F | Truist Financial Corp | 86 862 | 4,58 | 381 | 5,25 | ||||
| 2025-08-14 | 13F | Bank Of America Corp /de/ | 946 230 | 9,37 | 4 154 | 9,87 | ||||
| 2025-08-14 | 13F | Mariner, LLC | 15 793 | 3,32 | 69 | 4,55 | ||||
| 2025-04-21 | 13F | Taddei, Ludwig & Associates, Inc. | 0 | −100,00 | 0 | −100,00 | ||||
| 2025-08-04 | 13F | Flagship Harbor Advisors, Llc | 19 900 | −8,51 | 87 | −8,42 | ||||
| 2025-07-28 | 13F | Frazier Financial Advisors, LLC | 446 | 0,00 | 2 | 0,00 | ||||
| 2025-08-11 | 13F | Elequin Capital Lp | 0 | −100,00 | 0 | |||||
| 2025-08-14 | 13F | UBS Group AG | 177 634 | 38,72 | 780 | 39,36 | ||||
| 2025-08-12 | 13F | J.w. Cole Advisors, Inc. | 136 312 | 8,77 | 598 | 9,32 | ||||
| 2025-07-29 | 13F | Huntleigh Advisors, Inc. | 10 000 | 0,00 | 44 | 0,00 | ||||
| 2025-08-13 | 13F | Walleye Capital LLC | 44 989 | 198 | ||||||
| 2025-08-14 | 13F | Atomi Financial Group, Inc. | 30 422 | 134 | ||||||
| 2025-07-25 | 13F | Mitchell Sinkler & Starr/pa | 13 750 | 0,00 | 60 | 0,00 | ||||
| 2025-08-18 | 13F | Hollencrest Capital Management | 2 450 | 0,00 | 11 | 0,00 | ||||
| 2025-08-06 | 13F | Modera Wealth Management, LLC | 13 651 | 1,69 | 60 | 1,72 | ||||
| 2025-07-11 | 13F | Vanguard Capital Wealth Advisors This fund is a listed as child fund of Vanguard Group Inc and if that institution has disclosed ownership in this security, then these positions will not be double counted when calculating total shares and total value | 23 642 | −57,04 | 104 | −57,08 | ||||
| 2025-08-14 | 13F | Garden State Investment Advisory Services LLC | 98 963 | −4,84 | 434 | −4,41 | ||||
| 2025-08-13 | 13F | Rsm Us Wealth Management Llc | 11 200 | 0,00 | 49 | 2,08 | ||||
| 2025-09-10 | 13F | WT Wealth Management | 15 215 | −43,90 | 67 | −44,07 | ||||
| 2025-08-04 | 13F | Bay Colony Advisory Group, Inc d/b/a Bay Colony Advisors | 150 084 | 11,20 | 659 | 12,48 | ||||
| 2025-08-15 | 13F | WFA of San Diego, LLC | 2 300 | 10 | ||||||
| 2025-08-13 | 13F | Townsquare Capital Llc | 0 | −100,00 | 0 | |||||
| 2025-08-06 | 13F | Carnegie Lake Advisors LLC | 107 981 | −5,22 | 0 | |||||
| 2025-08-08 | 13F | Avantax Advisory Services, Inc. | 29 507 | 1,57 | 130 | 2,38 |