Grundläggande statistik
| Institutionella ägare | 144 total, 144 long only, 0 short only, 0 long/short - change of 13,28% MRQ |
| Genomsnittlig portföljallokering | 0.2405 % - change of −8,32% MRQ |
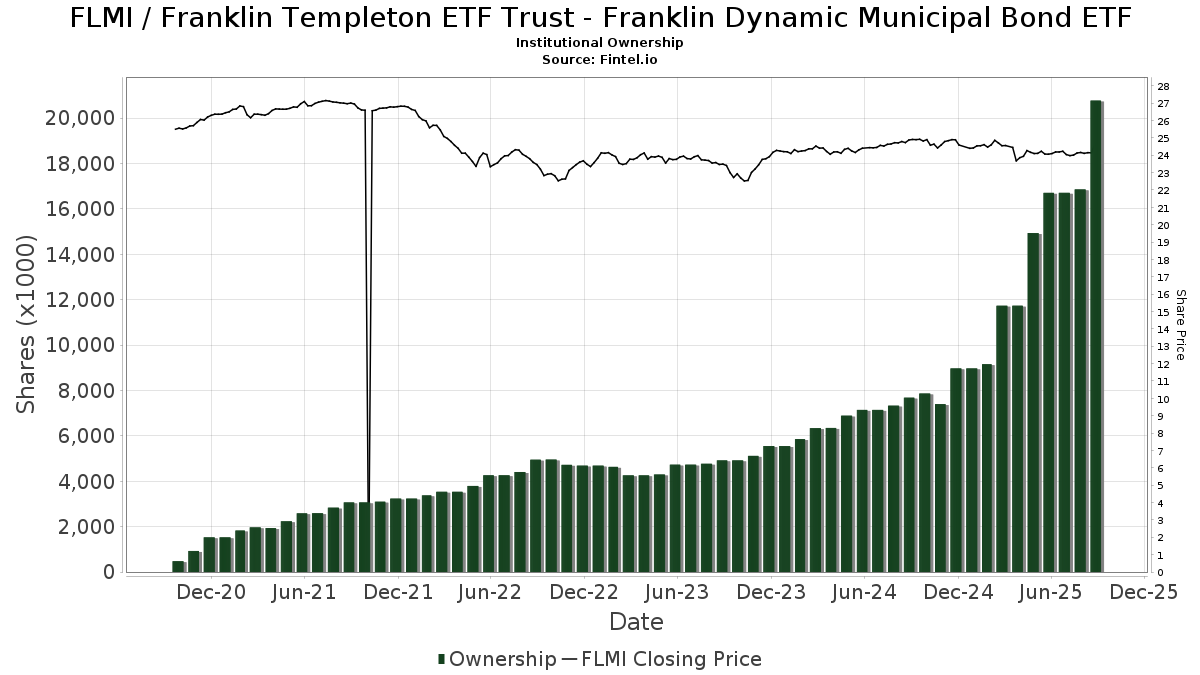
| Institutionella aktier (lång) | 20 774 489 (ex 13D/G) - change of 4,07MM shares 24,33% MRQ |
| Institutionellt värde (lång) | $ 482 169 USD ($1000) |
Institutionellt ägande och aktieägare
Franklin Templeton ETF Trust - Franklin Dynamic Municipal Bond ETF (US:FLMI) har 144 Institutionella ägare och aktieägare som har lämnat in 13D/G- eller 13F-formulär till Securities Exchange Commission (SEC). Dessa institut innehar totalt 20,774,489 aktier. Största aktieägare inkluderar LPL Financial LLC, Cliftonlarsonallen Wealth Advisors, Llc, Meeder Advisory Services, Inc., Colony Group, LLC, Ameriprise Financial Inc, Raymond James Financial Inc, Central Bank & Trust Co, Cetera Investment Advisers, RFG Advisory, LLC, and Legacy CG, LLC .
Franklin Templeton ETF Trust - Franklin Dynamic Municipal Bond ETF (ARCA:FLMI) Institutionell ägarstruktur visar institutioners och fonders nuvarande positioner i företaget, samt de senaste förändringarna i positionernas storlek. Större aktieägare kan vara enskilda investerare, fonder, hedgefonder eller institutioner. Bilaga 13D visar att investeraren äger (eller ägde) mer än 5% av företaget och avser (eller avsåg) att aktivt eftersträva en förändring av affärsstrategin. Schedule 13G indikerar en passiv investering på över 5%.
The share price as of September 11, 2025 is 24,70 / share. Previously, on September 12, 2024, the share price was 24,86 / share. This represents a decline of 0,64% over that period.
Fondsentimentets poäng
Fondsentimentet poängen(fka Ägarackumulation-poäng) visar vilka aktier som är mest köpta av fonder. Det är resultatet av en sofistikerad kvantitativ flerfaktormodell som identifierar företag med de högsta nivåerna av institutionell ackumulering. Poängsättningsmodellen använder en kombination av den totala ökningen av redovisade ägare, förändringarna i portföljallokeringarna för dessa ägare och andra mått. Siffran sträcker sig från 0 till 100, där högre siffror indikerar en högre nivå av ackumulering i förhållande till sina konkurrenter, och 50 är genomsnittet.
Uppdateringsfrekvens: Dagligen
Se Ownership Explorer, som innehåller en lista över de högst rankade företagen.
Institutionell sälj/köp-kvot
Förutom att rapportera vanliga eget kapital- och skuldemissioner måste institutioner med mer än 100MM tillgångar under förvaltning också avslöja sina innehav av sälj- och köpoptioner. Eftersom säljoptioner i allmänhet indikerar ett negativt sentiment och köpoptioner indikerar ett positivt sentiment, kan vi få en uppfattning om det övergripande institutionella sentimentet genom att plotta förhållandet mellan säljoptioner och köpoptioner. Diagrammet till höger visar det historiska förhållandet mellan sälj- och köpoptioner för detta instrument.
Genom att använda sälj/köp-kvoten som en indikator på aktieägarnas sentiment undviker man en av de största bristerna med att använda det totala institutionella ägandet, nämligen att en betydande del av de förvaltade tillgångarna investeras passivt för att följa index. Passivt förvaltade fonder köper vanligtvis inte optioner, så indikatorn för sälj/köp-kvoten ger en bättre bild av stämningen i aktivt förvaltade fonder.
13F- och NPORT-arkiveringar
Detaljer om 13F-arkiveringar är gratis. Detaljer om NP-arkiveringar kräver ett premiummedlemskap. Gröna rader indikerar nya positioner. Röda rader indikerar stängda positioner. Klicka på länk symbolen för att se hela transaktionshistoriken.
Uppgradera
för att låsa upp premiumdata och exportera till Excel ![]() .
.
| Fil Datum | Källa | Investerare | Typ | Genomsnittligt pris (beräknat) |
Aktier | Δ Aktier (%) |
Rapporterat värde (1000 USD) |
Δ Värde (%) |
Portföljallokering (%) |
|
|---|---|---|---|---|---|---|---|---|---|---|
| 2025-08-14 | 13F | Jane Street Group, Llc | 112 339 | 148,10 | 2 725 | 146,38 | ||||
| 2025-08-28 | NP | STMYX - Sierra Tactical Municipal Fund Class Special Shares | 86 300 | −67,35 | 2 094 | −67,60 | ||||
| 2025-07-31 | 13F | Wright Fund Managment, LLC | 264 300 | 0,00 | 6 459 | 0,00 | ||||
| 2025-07-29 | 13F | International Assets Investment Management, Llc | 19 249 | −3,97 | 467 | −4,70 | ||||
| 2025-08-14 | 13F | Mml Investors Services, Llc | 30 625 | −60,65 | 1 | −100,00 | ||||
| 2025-07-07 | 13F | TruWealth Advisors, LLC | 220 265 | 2,39 | 5 344 | 1,64 | ||||
| 2025-09-11 | 13F | Milestones Private Investment Advisors LLC | 26 786 | 650 | ||||||
| 2025-08-14 | 13F | Colony Group, LLC | 1 309 758 | 1,70 | 31 775 | 0,95 | ||||
| 2025-08-07 | 13F | PFG Advisors | 8 652 | 1,00 | 210 | 0,00 | ||||
| 2025-08-05 | 13F | NewSquare Capital LLC | 12 870 | 2,79 | 312 | 1,96 | ||||
| 2025-07-10 | 13F | Secure Asset Management, LLC | 0 | −100,00 | 0 | |||||
| 2025-08-08 | 13F | Pnc Financial Services Group, Inc. | 14 637 | 58,67 | 355 | 57,78 | ||||
| 2025-07-24 | 13F | IFP Advisors, Inc | 12 201 | 104,34 | 296 | 104,14 | ||||
| 2025-08-12 | 13F | LPL Financial LLC | 2 896 998 | −6,08 | 70 281 | −6,77 | ||||
| 2025-07-28 | 13F | Harbour Investments, Inc. | 8 289 | −68,95 | 201 | −69,17 | ||||
| 2025-08-01 | 13F | Gwn Securities Inc. | 0 | −100,00 | 0 | |||||
| 2025-07-30 | 13F | D.a. Davidson & Co. | 18 354 | 27,87 | 445 | 27,14 | ||||
| 2025-08-12 | 13F | MAI Capital Management | 746 | 18 | ||||||
| 2025-08-11 | 13F | HighTower Advisors, LLC | 9 157 | −95,69 | 222 | −95,73 | ||||
| 2025-08-08 | 13F | Meridian Wealth Management, LLC | 38 451 | 933 | ||||||
| 2025-08-14 | 13F | Susquehanna International Group, Llp | 10 571 | 256 | ||||||
| 2025-07-25 | 13F | Landmark Wealth Management, LLC | 35 818 | −10,90 | 1 | |||||
| 2025-07-09 | 13F | Summit Financial Consulting LLC | 26 487 | 10,67 | 643 | 9,93 | ||||
| 2025-08-06 | 13F | AE Wealth Management LLC | 13 032 | 47,09 | 316 | 46,30 | ||||
| 2025-08-14 | 13F | Abound Financial, Llc | 110 361 | −2,02 | 2 677 | −2,73 | ||||
| 2025-08-06 | 13F | Commonwealth Equity Services, Llc | 162 092 | −0,19 | 4 | 0,00 | ||||
| 2025-07-25 | NP | FGTHX - Franklin Templeton SMACS: Series H Advisor Class | 17 000 | 0,00 | 411 | −2,84 | ||||
| 2025-08-14 | 13F | Certified Advisory Corp | 0 | −100,00 | 0 | |||||
| 2025-07-28 | 13F | SFG Wealth Management, LLC. | 0 | −100,00 | 0 | |||||
| 2025-08-08 | 13F | Creative Planning | 16 593 | −8,42 | 403 | −9,05 | ||||
| 2025-08-13 | 13F | Jones Financial Companies Lllp | 119 629 | 151,44 | 2 896 | 149,87 | ||||
| 2025-07-16 | 13F | Perigon Wealth Management, LLC | 12 500 | 303 | ||||||
| 2025-08-05 | 13F | GPS Wealth Strategies Group, LLC | 102 | 0,99 | 2 | 0,00 | ||||
| 2025-07-10 | 13F | Redhawk Wealth Advisors, Inc. | 27 245 | −66,25 | 661 | −66,53 | ||||
| 2025-08-14 | 13F | Visionary Wealth Advisors | 0 | −100,00 | 0 | |||||
| 2025-07-21 | 13F | Cliftonlarsonallen Wealth Advisors, Llc | 2 166 091 | 5,17 | 52 549 | 4,39 | ||||
| 2025-08-14 | 13F | Stifel Financial Corp | 64 770 | 73,65 | 1 571 | 72,45 | ||||
| 2025-05-15 | 13F/A | Morgan Stanley | 0 | −100,00 | 0 | |||||
| 2025-08-01 | 13F | Brookwood Investment Group LLC | 0 | −100,00 | 0 | |||||
| 2025-08-08 | 13F | Phoenix Wealth Advisors | 12 000 | 291 | ||||||
| 2025-08-04 | 13F | Leeward Financial Partners, LLC | 69 889 | 5,28 | 1 695 | 4,50 | ||||
| 2025-08-12 | 13F | Global Retirement Partners, LLC | 33 928 | 823 | ||||||
| 2025-08-12 | 13F | BlueStem Wealth Partners, LLC | 317 478 | −24,34 | 7 702 | −24,90 | ||||
| 2025-07-29 | 13F | AssuredPartners Investment Advisors, LLC | 15 346 | 372 | ||||||
| 2025-07-16 | 13F | Essex Financial Services, Inc. | 23 055 | −2,50 | 559 | −3,12 | ||||
| 2025-07-22 | 13F | DAVENPORT & Co LLC | 8 253 | 200 | ||||||
| 2025-08-13 | 13F | VestGen Advisors, LLC | 195 667 | 0,51 | 4 747 | −0,23 | ||||
| 2025-08-14 | 13F | Evergreen Wealth Solutions, LLC | 29 850 | 145,68 | 724 | 144,59 | ||||
| 2025-08-12 | 13F | Park Square Financial Group, LLC | 200 | 0,00 | 5 | 0,00 | ||||
| 2025-08-11 | 13F | Cornerstone Planning Group LLC | 907 | 1,11 | 22 | 0,00 | ||||
| 2025-07-22 | 13F | Legacy CG, LLC | 471 991 | −3,30 | 11 451 | −4,02 | ||||
| 2025-08-19 | 13F | Advisory Services Network, LLC | 11 996 | 288 | ||||||
| 2025-08-01 | 13F | Envestnet Asset Management Inc | 156 059 | −25,18 | 3 786 | −25,74 | ||||
| 2025-08-04 | 13F | Creekmur Asset Management LLC | 2 177 | 0,00 | 53 | −1,89 | ||||
| 2025-08-11 | 13F | Pineridge Advisors LLC | 3 582 | −9,41 | 87 | −10,42 | ||||
| 2025-08-13 | 13F | Continuum Advisory, LLC | 9 300 | 226 | ||||||
| 2025-07-29 | 13F | Crux Wealth Advisors | 14 076 | 1,10 | 341 | 0,29 | ||||
| 2025-08-14 | 13F | Raymond James Financial Inc | 826 544 | 38,22 | 20 052 | 37,20 | ||||
| 2025-04-23 | 13F | Sabal Trust CO | 44 410 | 1 085 | ||||||
| 2025-08-11 | 13F | Inspire Advisors, LLC | 8 851 | 0,00 | 215 | −0,93 | ||||
| 2025-08-14 | 13F | Acorn Wealth Advisors, LLC | 9 129 | −13,58 | 221 | −14,34 | ||||
| 2025-08-07 | 13F | Meeder Advisory Services, Inc. | 1 593 429 | 38 657 | ||||||
| 2025-08-12 | 13F | Proequities, Inc. | 0 | 0 | ||||||
| 2025-07-25 | 13F | Cwm, Llc | 116 827 | 29,08 | 3 | 0,00 | ||||
| 2025-08-19 | 13F | Anchor Investment Management, LLC | 0 | −100,00 | 0 | |||||
| 2025-08-06 | 13F | Golden State Wealth Management, LLC | 34 892 | 4,36 | 846 | 3,55 | ||||
| 2025-08-13 | 13F | Per Stirling Capital Management, LLC. | 21 590 | 117,09 | 524 | 115,23 | ||||
| 2025-08-06 | 13F | SOUTH STATE Corp | 4 532 | 31,21 | 110 | 29,76 | ||||
| 2025-08-14 | 13F | Benjamin Edwards Inc | 15 057 | 365 | ||||||
| 2025-08-12 | 13F | CIBC Private Wealth Group, LLC | 0 | 0 | ||||||
| 2025-07-28 | 13F | RFG Advisory, LLC | 555 398 | −0,77 | 13 474 | −1,51 | ||||
| 2025-08-12 | 13F | Steward Partners Investment Advisory, Llc | 117 720 | 26,38 | 2 856 | 25,44 | ||||
| 2025-08-14 | 13F | Ameriprise Financial Inc | 1 060 685 | 41,25 | 25 683 | 39,91 | ||||
| 2025-08-14 | 13F | GWM Advisors LLC | 97 976 | 2 289,66 | 2 377 | 2 276,00 | ||||
| 2025-05-13 | 13F | EverSource Wealth Advisors, LLC | 0 | −100,00 | 0 | |||||
| 2025-07-16 | 13F | Magnus Financial Group LLC | 0 | −100,00 | 0 | |||||
| 2025-07-29 | 13F | Members Advisory Group LLC | 11 352 | 32,96 | 275 | 32,21 | ||||
| 2025-07-24 | 13F | Forefront Analytics, LLC | 72 109 | 1 749 | ||||||
| 2025-08-13 | 13F | Flow Traders U.s. Llc | 0 | −100,00 | 0 | |||||
| 2025-08-12 | 13F | Wayfinding Financial, LLC | 80 348 | 71,74 | 2 | 0,00 | ||||
| 2025-05-12 | 13F | Independent Advisor Alliance | 0 | −100,00 | 0 | |||||
| 2025-07-29 | 13F | Latitude Advisors, LLC | 10 768 | 0,89 | 261 | 0,38 | ||||
| 2025-08-15 | 13F | First Heartland Consultants, Inc. | 15 309 | 371 | ||||||
| 2025-08-08 | 13F | Croban | 72 109 | 5,81 | 1 749 | 5,05 | ||||
| 2025-07-17 | 13F | Asio Capital, LLC | 243 270 | 5 902 | ||||||
| 2025-07-25 | 13F | Atria Wealth Solutions, Inc. | 24 886 | 111,06 | 603 | 109,38 | ||||
| 2025-07-07 | 13F | Wealth Alliance Advisory Group, LLC | 172 559 | 2,28 | 4 186 | 1,53 | ||||
| 2025-07-30 | 13F | Cullen/frost Bankers, Inc. | 15 403 | 16,37 | 374 | 15,48 | ||||
| 2025-08-08 | 13F | Crossmark Global Holdings, Inc. | 8 766 | −0,65 | 213 | −1,40 | ||||
| 2025-08-15 | 13F | Captrust Financial Advisors | 48 240 | −32,13 | 1 170 | −32,64 | ||||
| 2025-08-08 | 13F | Avantax Advisory Services, Inc. | 14 917 | 362 | ||||||
| 2025-07-29 | 13F | Private Trust Co Na | 18 142 | −0,87 | 440 | −1,57 | ||||
| 2025-07-25 | 13F | Bill Few Associates, Inc. | 15 302 | 0,00 | 371 | −0,54 | ||||
| 2025-08-07 | 13F | New England Private Wealth Advisors LLC | 82 230 | 1 974 | ||||||
| 2025-08-01 | 13F | Cedar Point Capital Partners, LLC | 37 765 | −3,31 | 916 | −3,98 | ||||
| 2025-08-14 | 13F | Mariner, LLC | 189 085 | 0,66 | 4 587 | −0,07 | ||||
| 2025-08-01 | 13F | American Financial & Tax Strategies Inc | 135 503 | 0,86 | 3 287 | 0,12 | ||||
| 2025-08-14 | 13F | Great Valley Advisor Group, Inc. | 18 545 | 33,49 | 450 | 32,45 | ||||
| 2025-07-14 | 13F | AdvisorNet Financial, Inc | 24 880 | 4 046,67 | 604 | 4 207,14 | ||||
| 2025-07-09 | 13F | Central Bank & Trust Co | 741 931 | 0,29 | 17 999 | −0,45 | ||||
| 2025-07-28 | 13F | Axxcess Wealth Management, Llc | 32 705 | 793 | ||||||
| 2025-08-05 | 13F | Bank of New York Mellon Corp | 278 032 | 5,57 | 6 745 | 4,80 | ||||
| 2025-08-04 | 13F | Econ Financial Services Corp | 26 622 | −10,26 | 646 | −11,03 | ||||
| 2025-07-03 | 13F | TrueWealth Advisors, LLC | 21 618 | −7,92 | 524 | −8,55 | ||||
| 2025-07-31 | 13F | Hanlon Investment Management, Inc. | 0 | −100,00 | 0 | |||||
| 2025-08-14 | 13F | Boothbay Fund Management, Llc | 50 000 | 1 213 | ||||||
| 2025-08-12 | 13F | Jpmorgan Chase & Co | 199 428 | −5,27 | 4 838 | −5,97 | ||||
| 2025-07-29 | 13F | Stratos Wealth Advisors, LLC | 83 324 | 4,75 | 2 021 | 3,96 | ||||
| 2025-08-14 | 13F | Integrated Wealth Concepts LLC | 21 748 | −34,67 | 528 | −35,18 | ||||
| 2025-08-14 | 13F | Wells Fargo & Company/mn | 419 902 | 1 012,06 | 10 187 | 1 004,77 | ||||
| 2025-08-27 | 13F/A | Brinker Capital Investments, LLC | 413 451 | 1 039,58 | 10 030 | 1 032,05 | ||||
| 2025-07-28 | 13F | BRYN MAWR TRUST Co | 18 657 | 453 | ||||||
| 2025-07-16 | 13F | Embree Financial Group | 27 158 | −5,03 | 659 | −5,73 | ||||
| 2025-08-18 | 13F | Geneos Wealth Management Inc. | 3 071 | −24,56 | 75 | −25,25 | ||||
| 2025-08-12 | 13F | Gladstone Institutional Advisory LLC | 31 266 | −27,33 | 759 | −27,88 | ||||
| 2025-08-15 | 13F | Equitable Holdings, Inc. | 58 791 | 70,72 | 1 426 | 69,56 | ||||
| 2025-08-18 | 13F/A | National Bank Of Canada /fi/ | 24 000 | 2 300,00 | 582 | 2 325,00 | ||||
| 2025-08-04 | 13F | Assetmark, Inc | 2 464 | 60 | ||||||
| 2025-08-12 | 13F | Financial Advocates Investment Management | 47 743 | −41,11 | 1 158 | −41,54 | ||||
| 2025-08-05 | 13F | Sigma Planning Corp | 16 617 | 74,71 | 403 | 73,71 | ||||
| 2025-07-11 | 13F | Mallini Complete Financial Planning LLC | 14 994 | 1,09 | 364 | 0,28 | ||||
| 2025-08-04 | 13F | Atria Investments Llc | 12 582 | −1,49 | 305 | −2,24 | ||||
| 2025-08-08 | 13F | Collaborative Wealth Managment Inc. | 33 796 | 8,78 | 820 | 7,91 | ||||
| 2025-07-22 | 13F | Wealthcare Advisory Partners LLC | 26 060 | 632 | ||||||
| 2025-07-25 | 13F | One Degree Advisors Inc | 96 988 | 26,34 | 2 | 100,00 | ||||
| 2025-07-17 | 13F | Janney Montgomery Scott LLC | 65 657 | 20,30 | 2 | 0,00 | ||||
| 2025-05-15 | 13F/A | Orion Portfolio Solutions, LLC | 36 281 | −16,17 | 887 | −16,18 | ||||
| 2025-08-13 | 13F | Capital Analysts, Inc. | 500 | 0,00 | 0 | |||||
| 2025-09-04 | 13F/A | Advisor Group Holdings, Inc. | 383 845 | 191,98 | 9 312 | 189,82 | ||||
| 2025-07-21 | 13F | Patriot Financial Group Insurance Agency, LLC | 84 392 | 2,98 | 2 047 | 2,25 | ||||
| 2025-08-14 | 13F | Hancock Whitney Corp | 93 847 | 2 277 | ||||||
| 2025-08-12 | 13F | Franklin Resources Inc | 43 795 | 135,19 | 1 062 | 133,41 | ||||
| 2025-08-15 | 13F | Kestra Advisory Services, LLC | 68 997 | 21,42 | 1 674 | 20,53 | ||||
| 2025-07-30 | 13F | Retirement Planning Group | 79 144 | 316,90 | 1 920 | 314,69 | ||||
| 2025-07-31 | 13F | Oppenheimer & Co Inc | 10 075 | 244 | ||||||
| 2025-08-11 | 13F | Private Advisor Group, LLC | 132 258 | 59,65 | 3 209 | 58,50 | ||||
| 2025-08-12 | 13F | Ameritas Investment Partners, Inc. | 3 419 | 8,61 | 83 | 7,89 | ||||
| 2025-07-29 | 13F | ShoreHaven Wealth Partners, LLC | 105 094 | −17,14 | 2 550 | −17,75 | ||||
| 2025-07-14 | 13F | Narus Financial Partners, LLC | 9 034 | 219 | ||||||
| 2025-08-07 | 13F | Kestra Private Wealth Services, Llc | 313 300 | 5,83 | 7 601 | 5,04 | ||||
| 2025-08-08 | 13F | Cetera Investment Advisers | 679 327 | 227,70 | 16 480 | 225,31 | ||||
| 2025-08-14 | 13F | Comerica Bank | 3 120 | 0,00 | 76 | −1,32 | ||||
| 2025-07-09 | 13F | Bowman & Co S.C. | 55 546 | 4,07 | 1 348 | 3,30 | ||||
| 2025-07-16 | 13F | ORG Partners LLC | 0 | −100,00 | 0 | |||||
| 2025-08-14 | 13F | Glenview Trust Co | 0 | −100,00 | 0 | |||||
| 2025-08-14 | 13F | Royal Bank Of Canada | 11 985 | 2,21 | 291 | 1,39 | ||||
| 2025-08-14 | 13F | Wiley Bros.-aintree Capital, Llc | 25 399 | 32,53 | 616 | 31,91 | ||||
| 2025-07-09 | 13F | Massmutual Trust Co Fsb/adv | 29 747 | −25,21 | 722 | −25,82 | ||||
| 2025-08-12 | 13F | Wulff, Hansen & Co. | 41 187 | 0,00 | 999 | −0,70 | ||||
| 2025-08-13 | 13F | Congress Wealth Management LLC / DE / | 13 943 | 338 | ||||||
| 2025-07-21 | 13F | Ameritas Advisory Services, LLC | 1 253 | 30 | ||||||
| 2025-07-24 | 13F | Us Bancorp \de\ | 0 | −100,00 | 0 | |||||
| 2025-07-14 | 13F | GAMMA Investing LLC | 8 786 | −85,03 | 213 | −85,15 | ||||
| 2025-07-18 | 13F | Truist Financial Corp | 62 084 | 56,06 | 1 506 | 54,94 | ||||
| 2025-07-31 | 13F | Cambridge Investment Research Advisors, Inc. | 150 844 | 8,07 | 4 | 0,00 | ||||
| 2025-08-06 | 13F | Prospera Financial Services Inc | 17 888 | 43,86 | 434 | 42,90 | ||||
| 2025-08-14 | 13F | Integrity Wealth Advisors, Inc. | 18 553 | −2,49 | 450 | −3,02 | ||||
| 2025-08-12 | 13F | J.w. Cole Advisors, Inc. | 15 907 | 386 | ||||||
| 2025-08-14 | 13F | Diversify Advisory Services, LLC | 81 990 | 1 982 | ||||||
| 2025-07-31 | 13F | Prentice Wealth Management LLC | 186 349 | 44,96 | 4 521 | 43,90 | ||||
| 2025-08-11 | 13F | Principal Securities, Inc. | 14 894 | 4 155,43 | 361 | 4 412,50 | ||||
| 2025-08-26 | 13F/A | Thrivent Financial For Lutherans | 156 551 | 4 |