Grundläggande statistik
| Institutionella ägare | 159 total, 159 long only, 0 short only, 0 long/short - change of 11,19% MRQ |
| Genomsnittlig portföljallokering | 0.2111 % - change of −19,41% MRQ |
| Institutionella aktier (lång) | 13 820 699 (ex 13D/G) - change of −2,75MM shares −16,60% MRQ |
| Institutionellt värde (lång) | $ 810 335 USD ($1000) |
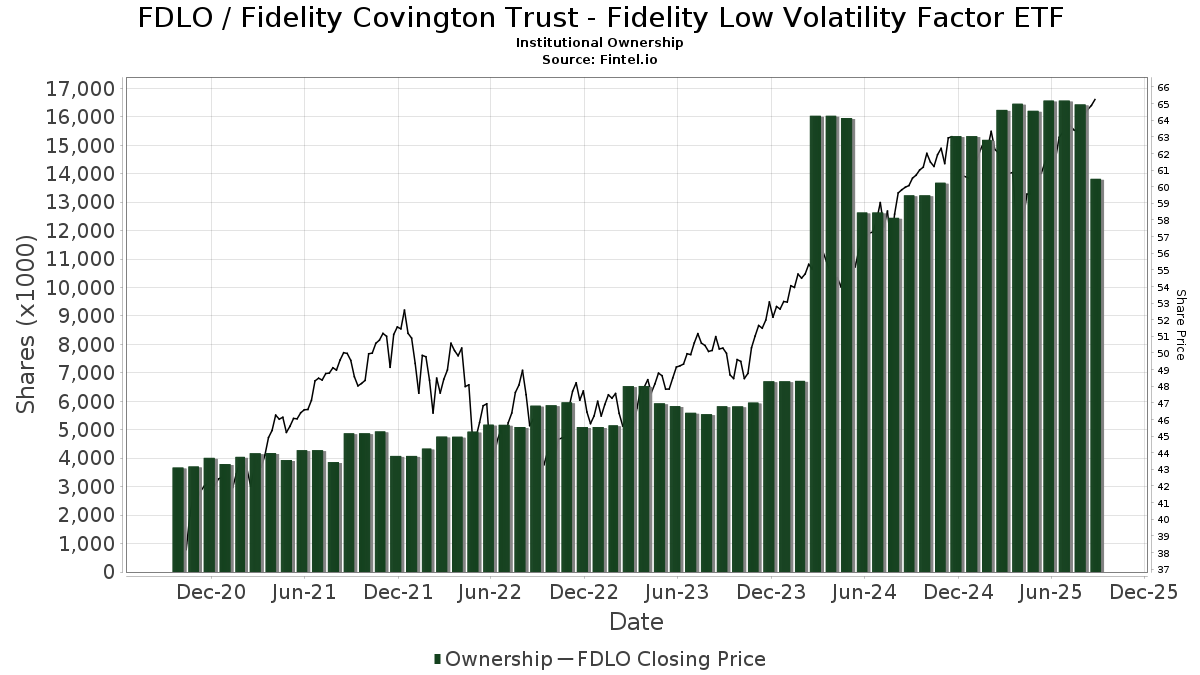
Institutionellt ägande och aktieägare
Fidelity Covington Trust - Fidelity Low Volatility Factor ETF (US:FDLO) har 159 Institutionella ägare och aktieägare som har lämnat in 13D/G- eller 13F-formulär till Securities Exchange Commission (SEC). Dessa institut innehar totalt 13,820,699 aktier. Största aktieägare inkluderar Fmr Llc, Commonwealth Equity Services, Llc, Envestnet Asset Management Inc, Bank Of America Corp /de/, Kestra Advisory Services, LLC, Campbell Deegan Wealth Management, LLC, CI Private Wealth, LLC, Segall Bryant & Hamill, Llc, LPL Financial LLC, and GWM Advisors LLC .
Fidelity Covington Trust - Fidelity Low Volatility Factor ETF (ARCA:FDLO) Institutionell ägarstruktur visar institutioners och fonders nuvarande positioner i företaget, samt de senaste förändringarna i positionernas storlek. Större aktieägare kan vara enskilda investerare, fonder, hedgefonder eller institutioner. Bilaga 13D visar att investeraren äger (eller ägde) mer än 5% av företaget och avser (eller avsåg) att aktivt eftersträva en förändring av affärsstrategin. Schedule 13G indikerar en passiv investering på över 5%.
The share price as of September 11, 2025 is 65,79 / share. Previously, on September 11, 2024, the share price was 60,06 / share. This represents an increase of 9,53% over that period.
Fondsentimentets poäng
Fondsentimentet poängen(fka Ägarackumulation-poäng) visar vilka aktier som är mest köpta av fonder. Det är resultatet av en sofistikerad kvantitativ flerfaktormodell som identifierar företag med de högsta nivåerna av institutionell ackumulering. Poängsättningsmodellen använder en kombination av den totala ökningen av redovisade ägare, förändringarna i portföljallokeringarna för dessa ägare och andra mått. Siffran sträcker sig från 0 till 100, där högre siffror indikerar en högre nivå av ackumulering i förhållande till sina konkurrenter, och 50 är genomsnittet.
Uppdateringsfrekvens: Dagligen
Se Ownership Explorer, som innehåller en lista över de högst rankade företagen.
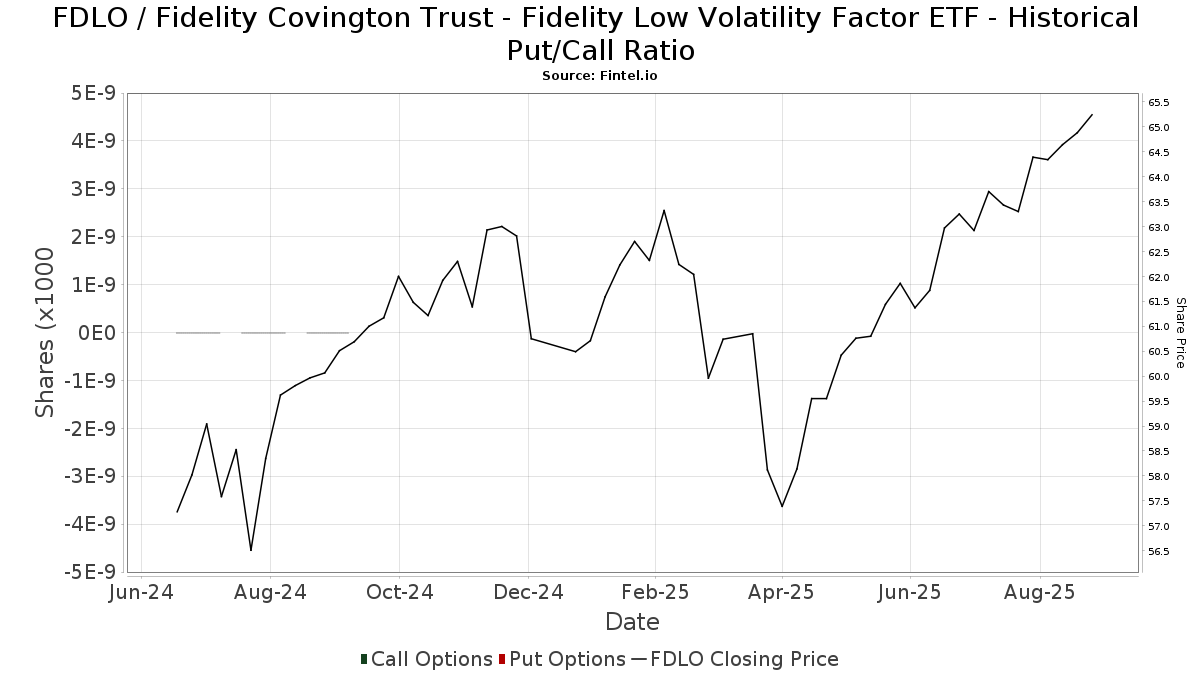
Institutionell sälj/köp-kvot
Förutom att rapportera vanliga eget kapital- och skuldemissioner måste institutioner med mer än 100MM tillgångar under förvaltning också avslöja sina innehav av sälj- och köpoptioner. Eftersom säljoptioner i allmänhet indikerar ett negativt sentiment och köpoptioner indikerar ett positivt sentiment, kan vi få en uppfattning om det övergripande institutionella sentimentet genom att plotta förhållandet mellan säljoptioner och köpoptioner. Diagrammet till höger visar det historiska förhållandet mellan sälj- och köpoptioner för detta instrument.
Genom att använda sälj/köp-kvoten som en indikator på aktieägarnas sentiment undviker man en av de största bristerna med att använda det totala institutionella ägandet, nämligen att en betydande del av de förvaltade tillgångarna investeras passivt för att följa index. Passivt förvaltade fonder köper vanligtvis inte optioner, så indikatorn för sälj/köp-kvoten ger en bättre bild av stämningen i aktivt förvaltade fonder.
13F- och NPORT-arkiveringar
Detaljer om 13F-arkiveringar är gratis. Detaljer om NP-arkiveringar kräver ett premiummedlemskap. Gröna rader indikerar nya positioner. Röda rader indikerar stängda positioner. Klicka på länk symbolen för att se hela transaktionshistoriken.
Uppgradera
för att låsa upp premiumdata och exportera till Excel ![]() .
.
| Fil Datum | Källa | Investerare | Typ | Genomsnittligt pris (beräknat) |
Aktier | Δ Aktier (%) |
Rapporterat värde (1000 USD) |
Δ Värde (%) |
Portföljallokering (%) |
|
|---|---|---|---|---|---|---|---|---|---|---|
| 2025-08-08 | 13F | Glassman Wealth Services | 0 | −100,00 | 0 | |||||
| 2025-08-14 | 13F | Mercer Global Advisors Inc /adv | 7 834 | −13,80 | 492 | −10,73 | ||||
| 2025-08-08 | 13F | Foundations Investment Advisors, LLC | 74 355 | 12,88 | 4 670 | 16,93 | ||||
| 2025-05-13 | 13F | Coston, McIsaac & Partners | 0 | −100,00 | 0 | |||||
| 2025-08-13 | 13F | Colonial Trust Advisors | 9 | 1 | ||||||
| 2025-07-28 | 13F | BRYN MAWR TRUST Co | 360 | 0,00 | 23 | 4,76 | ||||
| 2025-08-07 | 13F | Samalin Investment Counsel, LLC | 5 494 | 0,05 | 345 | 3,92 | ||||
| 2025-07-08 | 13F | RMR Wealth Builders | 3 540 | −6,99 | 222 | −3,48 | ||||
| 2025-09-04 | 13F/A | Advisor Group Holdings, Inc. | 118 808 | −22,53 | 7 466 | −19,73 | ||||
| 2025-07-25 | 13F | Atria Wealth Solutions, Inc. | 8 861 | −8,67 | 556 | −5,44 | ||||
| 2025-08-11 | 13F | Aptus Capital Advisors, LLC | 6 024 | 88,90 | 378 | 95,85 | ||||
| 2025-08-14 | 13F | Mml Investors Services, Llc | 6 641 | −36,69 | 0 | |||||
| 2025-08-11 | 13F | Empowered Funds, LLC | 0 | −100,00 | 0 | |||||
| 2025-07-11 | 13F | Farther Finance Advisors, LLC | 436 | 19,45 | 27 | 22,73 | ||||
| 2025-08-12 | 13F | Integrated Advisors Network LLC | 7 603 | −30,12 | 477 | −27,62 | ||||
| 2025-08-06 | 13F | Hoxton Planning & Management, LLC | 3 561 | 0,00 | 224 | 3,72 | ||||
| 2025-07-28 | 13F | Harbour Investments, Inc. | 96 | −92,10 | 6 | −91,78 | ||||
| 2025-08-01 | 13F | Envestnet Asset Management Inc | 555 092 | −9,25 | 34 860 | −5,98 | ||||
| 2025-08-15 | 13F | Morgan Stanley | 77 179 | −28,32 | 4 847 | −25,75 | ||||
| 2025-08-14 | 13F | Clarity Asset Management, Inc. | 2 228 | 0,36 | 140 | 3,73 | ||||
| 2025-07-18 | 13F | Provident Wealth Management, LLC | 2 886 | 0,00 | 181 | 4,02 | ||||
| 2025-08-07 | 13F | Kestra Private Wealth Services, Llc | 26 095 | 6,30 | 1 639 | 10,08 | ||||
| 2025-08-08 | 13F | Avantax Advisory Services, Inc. | 12 509 | 1,08 | 786 | 4,67 | ||||
| 2025-08-27 | 13F/A | Brinker Capital Investments, LLC | 3 360 | 211 | ||||||
| 2025-07-17 | 13F | Beacon Capital Management, LLC | 70 | 4 | ||||||
| 2025-08-14 | 13F | Qube Research & Technologies Ltd | 0 | −100,00 | 0 | |||||
| 2025-08-12 | 13F | Absolute Capital Management, LLC | 3 473 | −25,52 | 218 | −22,70 | ||||
| 2025-07-21 | 13F | Ameritas Advisory Services, LLC | 130 449 | −48,98 | 8 192 | −47,14 | ||||
| 2025-08-08 | 13F | Advisors Capital Management, LLC | 34 774 | −2,44 | 2 184 | 1,06 | ||||
| 2025-08-14 | 13F | Stifel Financial Corp | 49 645 | 4,39 | 3 118 | 8,15 | ||||
| 2025-07-24 | 13F | Capital Advisors, Ltd. LLC | 10 | 0 | ||||||
| 2025-08-14 | 13F | Fmr Llc | 7 934 912 | −23,10 | 498 312 | −20,33 | ||||
| 2025-07-25 | 13F | Cwm, Llc | 700 | 233,33 | 0 | |||||
| 2025-08-13 | 13F | Cresset Asset Management, LLC | 6 304 | −0,02 | 396 | 3,40 | ||||
| 2025-08-04 | 13F | Savvy Advisors, Inc. | 3 329 | 209 | ||||||
| 2025-07-24 | 13F | Us Bancorp \de\ | 120 | −6,98 | 8 | 0,00 | ||||
| 2025-08-12 | 13F | Running Point Capital Advisors, LLC | 165 902 | 1,36 | 10 419 | 5,00 | ||||
| 2025-07-28 | 13F | Private Wealth Asset Management, LLC | 1 050 | 0,00 | 66 | 3,17 | ||||
| 2025-08-04 | 13F | AMG National Trust Bank | 3 518 | 0,23 | 221 | 3,77 | ||||
| 2025-08-14 | 13F | Bank Of America Corp /de/ | 443 513 | 9,54 | 27 853 | 13,48 | ||||
| 2025-07-31 | 13F | Buckingham Strategic Partners | 10 068 | 0,24 | 632 | 3,95 | ||||
| 2025-08-13 | 13F | Capital Analysts, Inc. | 33 953 | 1,90 | 2 | 0,00 | ||||
| 2025-07-14 | 13F | Mechanics Bank Trust Department | 73 282 | 17,87 | 4 602 | 22,13 | ||||
| 2025-05-16 | 13F | Coppell Advisory Solutions LLC | 0 | −100,00 | 0 | |||||
| 2025-08-07 | 13F | Allworth Financial LP | 74 | −64,08 | 5 | −66,67 | ||||
| 2025-08-12 | 13F | MAI Capital Management | 264 | 42,70 | 17 | 45,45 | ||||
| 2025-08-18 | 13F | Hershey Financial Advisers, LLC | 0 | −100,00 | 0 | |||||
| 2025-08-11 | 13F | Private Advisor Group, LLC | 5 014 | −16,35 | 315 | −13,50 | ||||
| 2025-08-12 | 13F | J.w. Cole Advisors, Inc. | 5 043 | 1,67 | 317 | 5,33 | ||||
| 2025-08-14 | 13F | Betterment LLC | 7 494 | −2,24 | 0 | |||||
| 2025-08-14 | 13F | AllSquare Wealth Management LLC | 9 933 | 0,00 | 624 | 3,49 | ||||
| 2025-08-12 | 13F | SRS Capital Advisors, Inc. | 1 817 | 0,39 | 114 | 4,59 | ||||
| 2025-08-08 | 13F | OmniStar Financial Group, Inc. | 8 493 | 0,41 | 533 | 3,29 | ||||
| 2025-05-15 | 13F | EP Wealth Advisors, Inc. | 0 | −100,00 | 0 | −100,00 | ||||
| 2025-08-06 | 13F | Nvwm, Llc | 19 688 | 5,94 | 1 236 | 9,77 | ||||
| 2025-08-12 | 13F | Global Retirement Partners, LLC | 2 160 | 0,56 | 136 | 3,85 | ||||
| 2025-08-08 | 13F | Pnc Financial Services Group, Inc. | 44 | 76,00 | 3 | 100,00 | ||||
| 2025-05-14 | 13F | Orion Portfolio Solutions, LLC | 4 032 | 0,00 | 244 | 0,00 | ||||
| 2025-08-15 | 13F | Kestra Advisory Services, LLC | 346 284 | 7,32 | 21 747 | 11,18 | ||||
| 2025-08-13 | 13F | Cary Street Partners Financial Llc | 8 955 | −8,91 | 562 | −5,55 | ||||
| 2025-05-16 | 13F/A | Kestra Investment Management, LLC | 0 | −100,00 | 0 | |||||
| 2025-07-30 | 13F | Exencial Wealth Advisors, Llc | 78 286 | −7,41 | 4 916 | −4,08 | ||||
| 2025-08-13 | 13F | Transce3nd, LLC | 133 | 0,00 | 8 | 0,00 | ||||
| 2025-07-30 | 13F | Avidian Wealth Solutions, LLC | 9 666 | −0,30 | 607 | 3,41 | ||||
| 2025-08-12 | 13F | Argent Trust Co | 22 759 | −5,03 | 1 429 | −1,58 | ||||
| 2025-07-31 | 13F | Sequent Asset Management, LLC | 22 710 | 0,00 | 1 426 | 3,63 | ||||
| 2025-08-12 | 13F | Segall Bryant & Hamill, Llc | 227 641 | −2,94 | 14 296 | 0,54 | ||||
| 2025-08-14 | 13F | Valley Financial Group, Inc. | 5 554 | −0,61 | 349 | 2,96 | ||||
| 2025-08-15 | 13F | Semmax Financial Advisors Inc. | 55 | 0,00 | 3 | 0,00 | ||||
| 2025-08-12 | 13F | Steward Partners Investment Advisory, Llc | 4 035 | −5,79 | 253 | −2,32 | ||||
| 2025-08-13 | 13F | Truvestments Capital Llc | 800 | 0,00 | 50 | 4,17 | ||||
| 2025-07-18 | 13F | Dogwood Wealth Management LLC | 6 | 0 | ||||||
| 2025-07-30 | 13F | Rehmann Capital Advisory Group | 20 897 | 0,00 | 1 312 | 3,63 | ||||
| 2025-08-12 | 13F | Jpmorgan Chase & Co | 76 116 | −3,60 | 4 780 | −0,13 | ||||
| 2025-07-17 | 13F | Tempus Wealth Planning, LLC | 27 794 | 0,34 | 1 745 | 3,93 | ||||
| 2025-07-10 | 13F | Wealth Enhancement Advisory Services, Llc | 16 987 | −20,48 | 1 080 | −16,54 | ||||
| 2025-05-09 | 13F | Blair William & Co/il | 0 | −100,00 | 0 | |||||
| 2025-08-14 | 13F | GWM Advisors LLC | 176 211 | 49,47 | 11 066 | 54,86 | ||||
| 2025-08-08 | 13F | Campbell Deegan Wealth Management, LLC | 314 733 | 3,08 | 19 765 | 6,79 | ||||
| 2025-08-04 | 13F | Assetmark, Inc | 143 | 197,92 | 9 | 300,00 | ||||
| 2025-07-30 | 13F | Brookstone Capital Management | 8 581 | 10,51 | 539 | 14,47 | ||||
| 2025-08-15 | 13F | CI Private Wealth, LLC | 236 209 | 0,29 | 14 834 | 3,89 | ||||
| 2025-08-04 | 13F | Spire Wealth Management | 16 | 0,00 | 1 | |||||
| 2025-08-05 | 13F | Westside Investment Management, Inc. | 14 750 | 0,14 | 926 | 3,81 | ||||
| 2025-07-31 | 13F | Carnegie Capital Asset Management, LLC | 3 912 | 0,00 | 246 | 13,95 | ||||
| 2025-08-15 | 13F | Asset Allocation Strategies LLC | 21 830 | −31,72 | 1 371 | −29,31 | ||||
| 2025-07-24 | 13F | Ronald Blue Trust, Inc. | 1 071 | 67 | ||||||
| 2025-07-31 | 13F | Cambridge Investment Research Advisors, Inc. | 41 154 | −3,81 | 3 | 0,00 | ||||
| 2025-08-14 | 13F/A | Rockefeller Capital Management L.P. | 14 634 | −67,79 | 919 | −66,63 | ||||
| 2025-08-14 | 13F | Jane Street Group, Llc | 15 034 | 4,82 | 944 | 8,63 | ||||
| 2025-08-14 | 13F | Integrated Wealth Concepts LLC | 8 153 | 0,97 | 512 | 4,70 | ||||
| 2025-07-31 | 13F | Briaud Financial Planning, Inc | 722 | 0 | ||||||
| 2025-07-21 | 13F | Ascent Group, LLC | 3 674 | −0,43 | 231 | 3,14 | ||||
| 2025-08-14 | 13F | Royal Bank Of Canada | 51 430 | −53,21 | 3 230 | −51,52 | ||||
| 2025-08-01 | 13F | Howard Capital Management Inc. | 80 838 | 91,48 | 5 077 | 98,36 | ||||
| 2025-07-14 | 13F | Abound Wealth Management | 529 | 33 | ||||||
| 2025-08-13 | 13F | Northwestern Mutual Wealth Management Co | 25 113 | −12,44 | 1 577 | −9,26 | ||||
| 2025-08-14 | 13F | Harwood Advisory Group, LLC | 3 069 | −2,39 | 193 | 1,05 | ||||
| 2025-08-14 | 13F | Sunbelt Securities, Inc. | 6 126 | −46,56 | 371 | −46,54 | ||||
| 2025-05-02 | 13F | Transcendent Capital Group LLC | 0 | −100,00 | 0 | |||||
| 2025-05-14 | 13F | Islay Capital Management, Llc | 0 | −100,00 | 0 | |||||
| 2025-07-10 | 13F | ARS Wealth Advisors Group, LLC | 4 727 | 0,36 | 297 | 3,86 | ||||
| 2025-07-15 | 13F | Maseco Llp | 374 | 23 | ||||||
| 2025-08-06 | 13F | Atlantic Union Bankshares Corp | 291 | 18 | ||||||
| 2025-07-25 | 13F | Johnson Investment Counsel Inc | 4 604 | −5,91 | 289 | −2,36 | ||||
| 2025-08-08 | 13F | Cetera Investment Advisers | 172 247 | 2,56 | 10 817 | 6,25 | ||||
| 2025-08-05 | 13F | Bank Of Montreal /can/ | 65 | 0,00 | 4 | 33,33 | ||||
| 2025-07-15 | 13F | Regatta Capital Group, Llc | 7 578 | 476 | ||||||
| 2025-07-21 | 13F | Abundance Wealth Counselors | 79 114 | −5,65 | 5 | 0,00 | ||||
| 2025-08-08 | 13F | Citizens Financial Group Inc/ri | 3 461 | 217 | ||||||
| 2025-08-14 | 13F | Comerica Bank | 394 | 0,00 | 25 | 4,35 | ||||
| 2025-08-12 | 13F | O'shaughnessy Asset Management, Llc | 10 881 | 2 350,68 | 683 | 2 526,92 | ||||
| 2025-05-12 | 13F | Independent Advisor Alliance | 0 | −100,00 | 0 | |||||
| 2025-07-11 | 13F | SILVER OAK SECURITIES, Inc | 6 374 | 0,05 | 400 | 4,44 | ||||
| 2025-07-08 | 13F | Strategic Advocates LLC | 7 779 | 489 | ||||||
| 2025-07-16 | 13F | RWM Asset Management, LLC | 5 169 | 0,00 | 325 | 3,51 | ||||
| 2025-08-14 | 13F | Mariner, LLC | 6 607 | 16,28 | 415 | 20,35 | ||||
| 2025-08-05 | 13F | Aviance Capital Partners, LLC | 3 546 | 0,00 | 223 | 3,74 | ||||
| 2025-05-12 | 13F | Sandy Spring Bank | 291 | 18 | ||||||
| 2025-07-14 | 13F | AdvisorNet Financial, Inc | 106 | 0,00 | 7 | 0,00 | ||||
| 2025-08-26 | 13F/A | Thrivent Financial For Lutherans | 0 | −100,00 | 0 | −100,00 | ||||
| 2025-05-02 | 13F | Capital A Wealth Management, LLC | 14 | 0,00 | 1 | |||||
| 2025-08-06 | 13F | Stonebridge Financial Planning Group, LLC | 5 250 | 0,00 | 330 | 3,46 | ||||
| 2025-08-12 | 13F | Ameritas Investment Partners, Inc. | 994 | 0,30 | 62 | 3,33 | ||||
| 2025-08-13 | 13F | Jones Financial Companies Lllp | 75 | 5 | ||||||
| 2025-07-30 | 13F | Strategic Blueprint, LLC | 14 494 | 910 | ||||||
| 2025-08-05 | 13F | Sigma Planning Corp | 8 279 | 8,52 | 520 | 12,34 | ||||
| 2025-07-24 | 13F | GFG Capital, LLC | 118 446 | −7,39 | 7 438 | −4,05 | ||||
| 2025-08-19 | 13F | Asset Dedication, LLC | 11 | 0,00 | 1 | |||||
| 2025-07-07 | 13F | Roxbury Financial LLC | 2 124 | 494,96 | 133 | 504,55 | ||||
| 2025-08-12 | 13F | Weaver Consulting Group | 43 877 | −0,98 | 2 755 | 2,57 | ||||
| 2025-08-13 | 13F | Lido Advisors, LLC | 115 900 | −7,90 | 7 279 | −4,59 | ||||
| 2025-08-12 | 13F | Proequities, Inc. | 0 | 0 | ||||||
| 2025-08-14 | 13F | Goldman Sachs Group Inc | 73 927 | −0,66 | 4 643 | 2,90 | ||||
| 2025-08-08 | 13F | MTM Investment Management, LLC | 919 | 58 | ||||||
| 2025-08-06 | 13F | AE Wealth Management LLC | 70 575 | −6,50 | 4 432 | −3,13 | ||||
| 2025-08-18 | 13F | Tyler-Stone Wealth Management | 33 877 | −0,83 | 2 127 | 2,75 | ||||
| 2025-08-14 | 13F | Two Sigma Investments, Lp | 0 | −100,00 | 0 | |||||
| 2025-08-14 | 13F | UBS Group AG | 2 636 | −66,30 | 166 | −65,19 | ||||
| 2025-07-14 | 13F | UMA Financial Services, Inc. | 33 | 0,00 | 2 | 0,00 | ||||
| 2025-07-24 | 13F | JB Capital LLC | 3 594 | 2,02 | 226 | 5,63 | ||||
| 2025-07-23 | 13F | Kingswood Wealth Advisors, Llc | 4 928 | −0,36 | 309 | 3,34 | ||||
| 2025-08-01 | 13F | Gwn Securities Inc. | 0 | −100,00 | 0 | |||||
| 2025-08-14 | 13F | Susquehanna International Group, Llp | 21 833 | 1 371 | ||||||
| 2025-07-17 | 13F | Sound Income Strategies, LLC | 14 | −95,85 | 1 | −100,00 | ||||
| 2025-07-30 | 13F | Cullen/frost Bankers, Inc. | 8 249 | 6,66 | 518 | 10,68 | ||||
| 2025-08-15 | 13F | Equitable Holdings, Inc. | 3 587 | 8,04 | 225 | 11,94 | ||||
| 2025-04-21 | 13F | Nelson, Van Denburg & Campbell Wealth Management Group, LLC | 0 | −100,00 | 0 | |||||
| 2025-05-08 | 13F | Eastern Bank | 0 | −100,00 | 0 | |||||
| 2025-07-14 | 13F | GAMMA Investing LLC | 192 | 0,00 | 12 | 9,09 | ||||
| 2025-08-01 | 13F | Logan Capital Management Inc | 3 | 0,00 | 0 | |||||
| 2025-07-14 | 13F | Buttonwood Financial Group, LLC | 9 157 | 2,88 | 579 | 14,00 | ||||
| 2025-08-13 | 13F | Russell Investments Group, Ltd. | 26 | 2 | ||||||
| 2025-07-25 | 13F | Sovereign Financial Group, Inc. | 5 057 | 0,38 | 318 | 3,93 | ||||
| 2025-08-12 | 13F | CIBC Private Wealth Group, LLC | 6 | 0,00 | 0 | |||||
| 2025-08-08 | 13F | Creative Planning | 8 196 | 6,06 | 515 | 9,83 | ||||
| 2025-08-13 | 13F | EverSource Wealth Advisors, LLC | 278 | 0,00 | 17 | 6,25 | ||||
| 2025-08-14 | 13F | Citadel Advisors Llc | 49 455 | 159,61 | 3 106 | 169,06 | ||||
| 2025-08-13 | 13F | Twin Peaks Wealth Advisors, LLC | 387 | 25 | ||||||
| 2025-08-19 | 13F | Advisory Services Network, LLC | 11 103 | −0,23 | 701 | 3,86 | ||||
| 2025-08-14 | 13F | Great Valley Advisor Group, Inc. | 12 986 | −9,06 | 816 | −5,78 | ||||
| 2025-08-11 | 13F | Principal Securities, Inc. | 130 | −37,50 | 8 | −33,33 | ||||
| 2025-08-13 | 13F | Cerity Partners LLC | 3 510 | −15,28 | 220 | −12,35 | ||||
| 2025-05-02 | 13F | Apollon Wealth Management, LLC | 0 | −100,00 | 0 | |||||
| 2025-07-25 | 13F | Envestnet Portfolio Solutions, Inc. | 15 777 | 14,84 | 991 | 18,99 | ||||
| 2025-08-13 | 13F | Luminist Capital LLC | 13 | 0,00 | 1 | |||||
| 2025-08-14 | 13F | Wells Fargo & Company/mn | 2 387 | 109,02 | 150 | 115,94 | ||||
| 2025-08-05 | 13F | Snider Financial Group | 8 542 | −12,46 | 536 | −9,31 | ||||
| 2025-05-08 | 13F | Regions Financial Corp | 0 | −100,00 | 0 | |||||
| 2025-07-25 | 13F | Concord Wealth Partners | 193 | 12 | ||||||
| 2025-08-12 | 13F | LPL Financial LLC | 177 522 | −9,96 | 11 148 | −6,72 | ||||
| 2025-07-09 | 13F | Pallas Capital Advisors LLC | 14 128 | 2,97 | 887 | 6,74 | ||||
| 2025-08-11 | 13F | Citigroup Inc | 772 | 48 | ||||||
| 2025-08-06 | 13F | Commonwealth Equity Services, Llc | 747 249 | −1,12 | 47 | 2,22 | ||||
| 2025-07-24 | 13F | IFP Advisors, Inc | 3 511 | 14,44 | 220 | 18,92 | ||||
| 2025-07-15 | 13F | Unified Investment Management | 6 150 | 0,00 | 386 | 3,76 | ||||
| 2025-08-14 | 13F | Raymond James Financial Inc | 104 585 | 1,84 | 6 568 | 5,49 | ||||
| 2025-08-05 | 13F | Key FInancial Inc | 2 427 | 0,00 | 152 | 3,40 | ||||
| 2025-08-08 | 13F | Security Financial Services, INC. | 11 004 | 691 |