Grundläggande statistik
| Institutionella ägare | 181 total, 181 long only, 0 short only, 0 long/short - change of 7,10% MRQ |
| Genomsnittlig portföljallokering | 0.2026 % - change of −11,54% MRQ |
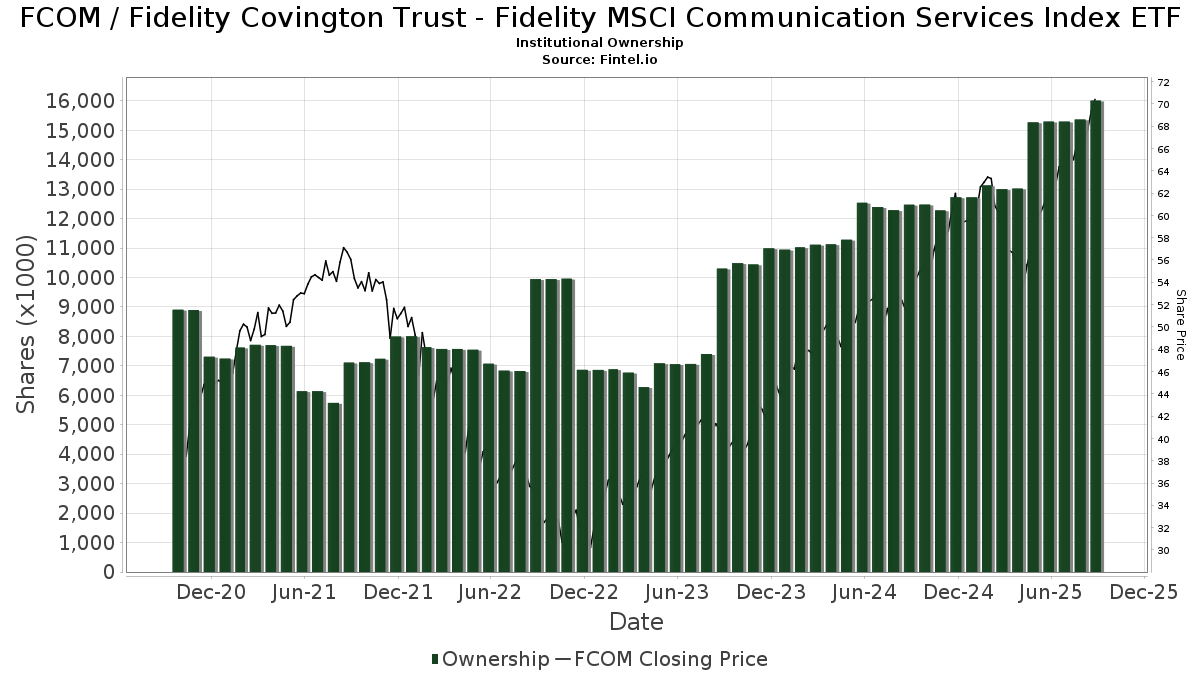
| Institutionella aktier (lång) | 16 008 501 (ex 13D/G) - change of 0,71MM shares 4,66% MRQ |
| Institutionellt värde (lång) | $ 841 720 USD ($1000) |
Institutionellt ägande och aktieägare
Fidelity Covington Trust - Fidelity MSCI Communication Services Index ETF (US:FCOM) har 181 Institutionella ägare och aktieägare som har lämnat in 13D/G- eller 13F-formulär till Securities Exchange Commission (SEC). Dessa institut innehar totalt 16,008,501 aktier. Största aktieägare inkluderar Charles Schwab Investment Management Inc, Harel Insurance Investments & Financial Services Ltd., Lido Advisors, LLC, Northwestern Mutual Wealth Management Co, Agf Management Ltd, Morgan Stanley, Vicus Capital, Wells Fargo & Company/mn, Commonwealth Equity Services, Llc, and LPL Financial LLC .
Fidelity Covington Trust - Fidelity MSCI Communication Services Index ETF (ARCA:FCOM) Institutionell ägarstruktur visar institutioners och fonders nuvarande positioner i företaget, samt de senaste förändringarna i positionernas storlek. Större aktieägare kan vara enskilda investerare, fonder, hedgefonder eller institutioner. Bilaga 13D visar att investeraren äger (eller ägde) mer än 5% av företaget och avser (eller avsåg) att aktivt eftersträva en förändring av affärsstrategin. Schedule 13G indikerar en passiv investering på över 5%.
The share price as of September 9, 2025 is 70,99 / share. Previously, on September 10, 2024, the share price was 50,81 / share. This represents an increase of 39,72% over that period.
Fondsentimentets poäng
Fondsentimentet poängen(fka Ägarackumulation-poäng) visar vilka aktier som är mest köpta av fonder. Det är resultatet av en sofistikerad kvantitativ flerfaktormodell som identifierar företag med de högsta nivåerna av institutionell ackumulering. Poängsättningsmodellen använder en kombination av den totala ökningen av redovisade ägare, förändringarna i portföljallokeringarna för dessa ägare och andra mått. Siffran sträcker sig från 0 till 100, där högre siffror indikerar en högre nivå av ackumulering i förhållande till sina konkurrenter, och 50 är genomsnittet.
Uppdateringsfrekvens: Dagligen
Se Ownership Explorer, som innehåller en lista över de högst rankade företagen.
Institutionell sälj/köp-kvot
Förutom att rapportera vanliga eget kapital- och skuldemissioner måste institutioner med mer än 100MM tillgångar under förvaltning också avslöja sina innehav av sälj- och köpoptioner. Eftersom säljoptioner i allmänhet indikerar ett negativt sentiment och köpoptioner indikerar ett positivt sentiment, kan vi få en uppfattning om det övergripande institutionella sentimentet genom att plotta förhållandet mellan säljoptioner och köpoptioner. Diagrammet till höger visar det historiska förhållandet mellan sälj- och köpoptioner för detta instrument.
Genom att använda sälj/köp-kvoten som en indikator på aktieägarnas sentiment undviker man en av de största bristerna med att använda det totala institutionella ägandet, nämligen att en betydande del av de förvaltade tillgångarna investeras passivt för att följa index. Passivt förvaltade fonder köper vanligtvis inte optioner, så indikatorn för sälj/köp-kvoten ger en bättre bild av stämningen i aktivt förvaltade fonder.
13F- och NPORT-arkiveringar
Detaljer om 13F-arkiveringar är gratis. Detaljer om NP-arkiveringar kräver ett premiummedlemskap. Gröna rader indikerar nya positioner. Röda rader indikerar stängda positioner. Klicka på länk symbolen för att se hela transaktionshistoriken.
Uppgradera
för att låsa upp premiumdata och exportera till Excel ![]() .
.
| Fil Datum | Källa | Investerare | Typ | Genomsnittligt pris (beräknat) |
Aktier | Δ Aktier (%) |
Rapporterat värde (1000 USD) |
Δ Värde (%) |
Portföljallokering (%) |
|
|---|---|---|---|---|---|---|---|---|---|---|
| 2025-05-12 | 13F | Founders Financial Securities Llc | 0 | −100,00 | 0 | |||||
| 2025-04-29 | 13F | Element Wealth, LLC | 0 | −100,00 | 0 | |||||
| 2025-05-15 | 13F | Minot DeBlois Advisors LLC | 0 | −100,00 | 0 | |||||
| 2025-08-14 | 13F | Full Sail Capital, LLC | 234 794 | −2,38 | 15 217 | 12,45 | ||||
| 2025-08-14 | 13F | GWM Advisors LLC | 9 204 | −1,60 | 597 | 13,31 | ||||
| 2025-07-17 | 13F | Janney Montgomery Scott LLC | 67 249 | 15,96 | 4 | 33,33 | ||||
| 2025-08-04 | 13F | Creative Financial Designs Inc /adv | 1 223 | 0,00 | 79 | 16,18 | ||||
| 2025-08-08 | 13F | Capital Investment Advisory Services, LLC | 74 | 0,00 | 5 | 0,00 | ||||
| 2025-07-21 | 13F | Ameritas Advisory Services, LLC | 68 | 4 | ||||||
| 2025-08-12 | 13F | Coldstream Capital Management Inc | 0 | −100,00 | 0 | |||||
| 2025-08-12 | 13F | Integrated Advisors Network LLC | 7 230 | −38,14 | 469 | −28,77 | ||||
| 2025-08-14 | 13F | Fmr Llc | 26 237 | 21,59 | 1 700 | 40,03 | ||||
| 2025-08-01 | 13F | Envestnet Asset Management Inc | 47 388 | −56,78 | 3 071 | −50,21 | ||||
| 2025-08-07 | 13F | Kestra Private Wealth Services, Llc | 32 244 | 2,19 | 2 090 | 17,69 | ||||
| 2025-08-14 | 13F | Snowden Capital Advisors LLC | 24 646 | −7,55 | 1 597 | 6,54 | ||||
| 2025-08-12 | 13F | Charles Schwab Investment Management Inc | 4 421 397 | −1,07 | 286 551 | 13,97 | ||||
| 2025-08-12 | 13F | Howe & Rusling Inc | 363 | 24 | ||||||
| 2025-08-14 | 13F | Quantinno Capital Management LP | 4 783 | 25,87 | 310 | 45,07 | ||||
| 2025-07-02 | 13F | Crumly & Associates Inc. | 123 933 | 11,17 | 8 032 | 28,08 | ||||
| 2025-08-14 | 13F | Stifel Financial Corp | 146 682 | −5,37 | 9 507 | 9,01 | ||||
| 2025-07-30 | 13F | Retirement Planning Group | 0 | −100,00 | 0 | |||||
| 2025-07-14 | 13F | AdvisorNet Financial, Inc | 679 | 0,30 | 44 | 13,16 | ||||
| 2025-04-30 | 13F | Personal Cfo Solutions, Llc | 0 | −100,00 | 0 | −100,00 | ||||
| 2025-07-17 | 13F | Wolff Wiese Magana Llc | 69 | 0,00 | 4 | 33,33 | ||||
| 2025-08-01 | 13F | Ashton Thomas Private Wealth, LLC | 9 650 | 0,35 | 625 | 15,74 | ||||
| 2025-08-07 | 13F | Allworth Financial LP | 486 | −38,87 | 31 | −27,91 | ||||
| 2025-07-14 | 13F | Mechanics Bank Trust Department | 23 816 | −3,05 | 1 544 | 11,65 | ||||
| 2025-07-16 | 13F | Fischer Financial Services, Inc. | 106 462 | 0,17 | 6 878 | 15,04 | ||||
| 2025-04-23 | 13F | Oppenheimer & Co Inc | 0 | −100,00 | 0 | −100,00 | ||||
| 2025-08-14 | 13F | Sunbelt Securities, Inc. | 2 356 | −0,13 | 138 | 4,55 | ||||
| 2025-07-16 | 13F | Brown, Lisle/cummings, Inc. | 43 | 0,00 | 3 | 0,00 | ||||
| 2025-07-23 | 13F | Pillar Financial Advisors, LLC | 97 | 0,00 | 6 | 20,00 | ||||
| 2025-09-04 | 13F/A | Advisor Group Holdings, Inc. | 72 479 | −23,28 | 4 709 | −11,55 | ||||
| 2025-08-06 | 13F | Soltis Investment Advisors LLC | 11 538 | −0,62 | 748 | 14,40 | ||||
| 2025-05-15 | 13F/A | Orion Portfolio Solutions, LLC | 46 461 | 0,14 | 2 614 | −4,04 | ||||
| 2025-08-12 | 13F | Jpmorgan Chase & Co | 20 710 | 155,90 | 1 342 | 194,95 | ||||
| 2025-08-15 | 13F | Kestra Advisory Services, LLC | 164 073 | 8,88 | 10 634 | 25,42 | ||||
| 2025-08-08 | 13F | Pnc Financial Services Group, Inc. | 128 | 8 | ||||||
| 2025-08-12 | 13F | Steward Partners Investment Advisory, Llc | 48 305 | 150 853,12 | 3 131 | 312 900,00 | ||||
| 2025-07-16 | 13F | Southern Capital Advisors, Llc | 77 730 | −0,22 | 5 038 | 14,95 | ||||
| 2025-04-25 | 13F | Colonial River Wealth Management, LLC | 0 | −100,00 | 0 | |||||
| 2025-07-22 | 13F | Yoder Wealth Management, Inc. | 76 265 | 5,20 | 4 943 | 21,19 | ||||
| 2025-05-14 | 13F | BOK Financial Private Wealth, Inc. | 0 | −100,00 | 0 | |||||
| 2025-07-31 | 13F | Cambridge Investment Research Advisors, Inc. | 90 418 | 35,70 | 6 | 66,67 | ||||
| 2025-07-29 | 13F | Stratos Wealth Partners, LTD. | 4 710 | −19,31 | 305 | −7,01 | ||||
| 2025-05-15 | 13F | Hrt Financial Lp | 0 | −100,00 | 0 | |||||
| 2025-07-31 | 13F | Moment Partners, LLC | 3 228 | −12,92 | 209 | 0,48 | ||||
| 2025-08-13 | 13F | KDK Private Wealth Management, LLC | 20 669 | −2,11 | 1 339 | 12,90 | ||||
| 2025-07-24 | 13F | Live Oak Investment Partners | 15 964 | 10,53 | 1 035 | 27,34 | ||||
| 2025-04-25 | 13F | Red Tortoise LLC | 0 | −100,00 | 0 | |||||
| 2025-07-30 | 13F | Gables Capital Management Inc. | 662 | 0,00 | 43 | 13,51 | ||||
| 2025-05-09 | 13F | CoreCap Advisors, LLC | 0 | −100,00 | 0 | |||||
| 2025-04-23 | 13F | Gimbal Financial | 0 | −100,00 | 0 | −100,00 | ||||
| 2025-08-06 | 13F | Agf Management Ltd | 632 275 | 10,62 | 40 978 | 27,43 | ||||
| 2025-07-16 | 13F | Signature Resources Capital Management, LLC | 624 | 40 | ||||||
| 2025-08-08 | 13F | Cetera Investment Advisers | 17 034 | −19,04 | 1 104 | −6,76 | ||||
| 2025-07-18 | 13F | Bartlett & Co. Wealth Management Llc | 39 | 0,00 | 3 | 0,00 | ||||
| 2025-04-29 | 13F | Lee Danner & Bass Inc | 0 | −100,00 | 0 | −100,00 | ||||
| 2025-07-16 | 13F | Badgley Phelps Wealth Managers, LLC | 5 316 | 0,00 | 345 | 15,05 | ||||
| 2025-08-12 | 13F | O'shaughnessy Asset Management, Llc | 3 339 | −7,38 | 216 | 6,93 | ||||
| 2025-07-31 | 13F | Moser Wealth Advisors, LLC | 171 | 11 | ||||||
| 2025-08-08 | 13F | Meridian Wealth Management, LLC | 12 599 | 1,03 | 817 | 16,41 | ||||
| 2025-08-05 | 13F | Beckerman Institutional, LLC | 22 107 | −4,92 | 1 | 0,00 | ||||
| 2025-08-14 | 13F | Jane Street Group, Llc | 0 | −100,00 | 0 | |||||
| 2025-08-12 | 13F | Leigh Baldwin & Co., Llc | 4 181 | 0,05 | 271 | 14,89 | ||||
| 2025-07-16 | 13F | RWM Asset Management, LLC | 194 911 | 4,60 | 12 632 | 20,50 | ||||
| 2025-07-17 | 13F | Independence Bank of Kentucky | 70 | −56,25 | 5 | −55,56 | ||||
| 2025-08-05 | 13F | Sigma Planning Corp | 15 010 | −21,79 | 973 | −9,92 | ||||
| 2025-08-13 | 13F | Jones Financial Companies Lllp | 13 903 | 1,99 | 896 | 17,43 | ||||
| 2025-08-15 | 13F | Tower Research Capital LLC (TRC) | 4 721 | 306 | ||||||
| 2025-08-12 | 13F | Proequities, Inc. | 0 | 0 | ||||||
| 2025-07-25 | 13F | Apollon Wealth Management, LLC | 7 774 | −4,12 | 504 | 10,31 | ||||
| 2025-08-08 | 13F | Crossmark Global Holdings, Inc. | 15 283 | 0,00 | 990 | 15,25 | ||||
| 2025-08-14 | 13F | UBS Group AG | 74 709 | 3,55 | 4 842 | 19,27 | ||||
| 2025-08-14 | 13F | Susquehanna International Group, Llp | 39 443 | 275,11 | 2 556 | 332,49 | ||||
| 2025-08-05 | 13F | Harel Insurance Investments & Financial Services Ltd. | 2 484 280 | 22,67 | 161 | 42,48 | ||||
| 2025-05-09 | 13F | Pathway Financial Advisers, LLC | 0 | −100,00 | 0 | |||||
| 2025-07-16 | 13F/A | CX Institutional | 19 815 | 12,19 | 1 | |||||
| 2025-08-04 | 13F | Creekmur Asset Management LLC | 1 | 0,00 | 0 | |||||
| 2025-08-06 | 13F | Golden State Wealth Management, LLC | 12 | 1 | ||||||
| 2025-04-23 | 13F | Mascagni Wealth Management, Inc. | 0 | −100,00 | 0 | −100,00 | ||||
| 2025-08-12 | 13F | AlphaCore Capital LLC | 162 | 10 | ||||||
| 2025-08-12 | 13F | SRS Capital Advisors, Inc. | 428 | 28 | ||||||
| 2025-07-30 | 13F | Pacific Sun Financial Corp | 19 406 | 2,09 | 1 258 | 17,59 | ||||
| 2025-08-05 | 13F | Dunhill Financial, LLC | 109 | 0,00 | 7 | 16,67 | ||||
| 2025-07-23 | 13F | Elm3 Financial Group, LLC | 7 263 | 471 | ||||||
| 2025-08-12 | 13F | CIBC Private Wealth Group, LLC | 64 | 0,00 | 4 | 33,33 | ||||
| 2025-07-10 | 13F | Charter Oak Capital Management, LLC | 6 265 | −20,08 | 406 | −7,94 | ||||
| 2025-08-13 | 13F | Quadrature Capital Ltd | 0 | −100,00 | 0 | |||||
| 2025-08-08 | 13F | Financial Gravity Companies, Inc. | 151 | 10 | ||||||
| 2025-07-24 | 13F | IFP Advisors, Inc | 699 | 0,00 | 45 | 15,38 | ||||
| 2025-08-19 | 13F | Advisory Services Network, LLC | 11 340 | −82,98 | 752 | −79,96 | ||||
| 2025-08-14 | 13F | Wells Fargo & Company/mn | 269 359 | −5,18 | 17 457 | 9,23 | ||||
| 2025-08-11 | 13F | Capital Square, LLC | 3 365 | −23,07 | 215 | −12,60 | ||||
| 2025-08-12 | 13F | Guerra Advisors Inc | 129 640 | −25,59 | 8 402 | −14,29 | ||||
| 2025-08-14 | 13F | Raymond James Financial Inc | 49 361 | 0,57 | 3 199 | 15,86 | ||||
| 2025-04-23 | 13F | Aspetuck Financial Management LLC | 0 | −100,00 | 0 | −100,00 | ||||
| 2025-08-14 | 13F | Citadel Advisors Llc | 0 | −100,00 | 0 | |||||
| 2025-05-09 | 13F | Legacy Capital Group California, Inc. | 0 | −100,00 | 0 | |||||
| 2025-08-14 | 13F | Kovitz Investment Group Partners, LLC | 65 963 | 44,84 | 4 275 | 66,86 | ||||
| 2025-08-05 | 13F | Lifeworks Advisors, LLC | 31 567 | 0,34 | 2 046 | 15,60 | ||||
| 2025-08-14 | 13F | Federation des caisses Desjardins du Quebec | 922 | 60 | ||||||
| 2025-07-28 | 13F | Rosenberg Matthew Hamilton | 3 110 | 0,00 | 202 | 15,52 | ||||
| 2025-07-29 | 13F | Private Trust Co Na | 24 | 26,32 | 2 | 0,00 | ||||
| 2025-08-13 | 13F | Marshall Wace, Llp | 3 218 | −86,08 | 209 | −84,00 | ||||
| 2025-08-14 | 13F | Boston Private Wealth Llc | 3 342 | 217 | ||||||
| 2025-07-22 | 13F | Grimes & Company, Inc. | 21 192 | 1 373 | ||||||
| 2025-07-18 | 13F | Trust Co Of Vermont | 0 | −100,00 | 0 | |||||
| 2025-07-14 | 13F | GAMMA Investing LLC | 132 | 0,00 | 9 | 14,29 | ||||
| 2025-07-25 | 13F | Atria Wealth Solutions, Inc. | 17 298 | −41,29 | 1 121 | −32,41 | ||||
| 2025-08-26 | 13F/A | Thrivent Financial For Lutherans | 38 103 | 2 | ||||||
| 2025-07-24 | 13F | Court Place Advisors, LLC | 16 805 | 1,22 | 1 089 | 16,60 | ||||
| 2025-05-01 | 13F | Q3 Asset Management | 0 | −100,00 | 0 | |||||
| 2025-08-12 | 13F | Global Retirement Partners, LLC | 187 | −44,01 | 12 | −36,84 | ||||
| 2025-07-17 | 13F | Fifth Third Securities, Inc. | 16 816 | 0,17 | 1 090 | 15,36 | ||||
| 2025-08-06 | 13F | New Millennium Group LLC | 727 | 38,21 | 47 | 62,07 | ||||
| 2025-07-24 | 13F | Blair William & Co/il | 557 | 24,33 | 36 | 44,00 | ||||
| 2025-08-11 | 13F | Aptus Capital Advisors, LLC | 604 | 0,17 | 39 | 18,18 | ||||
| 2025-08-14 | 13F | Mml Investors Services, Llc | 13 592 | 15,31 | 1 | |||||
| 2025-07-09 | 13F | Bank of New Hampshire | 204 | 0,00 | 13 | 18,18 | ||||
| 2025-07-11 | 13F | Farther Finance Advisors, LLC | 1 186 | 0,25 | 77 | 15,15 | ||||
| 2025-08-27 | 13F/A | Brinker Capital Investments, LLC | 30 448 | −34,47 | 1 973 | −24,49 | ||||
| 2025-08-08 | 13F | Avantax Advisory Services, Inc. | 4 902 | −15,10 | 318 | −2,16 | ||||
| 2025-08-13 | 13F | Hsbc Holdings Plc | 4 392 | −58,97 | 285 | −52,82 | ||||
| 2025-04-09 | 13F | HBW Advisory Services LLC | 0 | −100,00 | 0 | −100,00 | ||||
| 2025-04-23 | 13F | PMV Capital Advisers, LLC | 0 | −100,00 | 0 | |||||
| 2025-07-28 | 13F | Harbour Investments, Inc. | 1 595 | 14,42 | 103 | 32,05 | ||||
| 2025-07-31 | 13F | Sage Mountain Advisors LLC | 1 243 | 0,00 | 81 | 15,94 | ||||
| 2025-08-08 | 13F | Hartland & Co., LLC | 375 | 24 | ||||||
| 2025-08-15 | 13F | Morgan Stanley | 428 311 | 5,45 | 27 759 | 21,48 | ||||
| 2025-05-13 | 13F | Heck Capital Advisors, LLC | 0 | −100,00 | 0 | −100,00 | ||||
| 2025-07-22 | 13F | PUREfi Wealth, LLC | 4 233 | 0,00 | 274 | 15,13 | ||||
| 2025-05-13 | 13F | Adviser Investments LLC | 0 | −100,00 | 0 | |||||
| 2025-08-06 | 13F | AE Wealth Management LLC | 119 757 | 7,28 | 7 761 | 23,58 | ||||
| 2025-08-05 | 13F | EPG Wealth Management LLC | 19 458 | −13,78 | 1 261 | −0,63 | ||||
| 2025-04-10 | 13F | Secure Asset Management, LLC | 0 | −100,00 | 0 | |||||
| 2025-05-14 | 13F | Truvestments Capital Llc | 0 | −100,00 | 0 | |||||
| 2025-08-11 | 13F | HighTower Advisors, LLC | 184 383 | 0,93 | 11 950 | 16,26 | ||||
| 2025-08-11 | 13F | Private Advisor Group, LLC | 4 163 | 0,31 | 270 | 15,45 | ||||
| 2025-07-15 | 13F | Lynch & Associates/in | 25 292 | 3,74 | 1 639 | 19,55 | ||||
| 2025-08-12 | 13F | J.w. Cole Advisors, Inc. | 3 642 | 1,53 | 236 | 17,41 | ||||
| 2025-07-22 | 13F | Merit Financial Group, LLC | 17 524 | −30,58 | 1 136 | −20,07 | ||||
| 2025-07-24 | 13F | Williams & Novak, LLC | 4 573 | −3,48 | 296 | 10,45 | ||||
| 2025-08-14 | 13F | IHT Wealth Management, LLC | 4 807 | 312 | ||||||
| 2025-08-14 | 13F | Bank Of America Corp /de/ | 70 285 | 7,73 | 4 555 | 24,11 | ||||
| 2025-05-12 | 13F | Independent Advisor Alliance | 0 | −100,00 | 0 | |||||
| 2025-08-06 | 13F | Decker Retirement Planning Inc. | 573 | 0,00 | 37 | 15,63 | ||||
| 2025-08-08 | 13F | Independence Financial Advisors, LLC | 146 441 | −8,33 | 9 491 | 5,60 | ||||
| 2025-07-25 | 13F | Cwm, Llc | 200 | 100,00 | 0 | |||||
| 2025-08-12 | 13F | Franklin Resources Inc | 0 | −100,00 | 0 | |||||
| 2025-08-08 | 13F | Creative Planning | 10 702 | 43,79 | 694 | 65,79 | ||||
| 2025-08-04 | 13F | Integrity Alliance, Llc. | 0 | −100,00 | 0 | |||||
| 2025-05-21 | 13F/A | Geneos Wealth Management Inc. | 46 | 3 | ||||||
| 2025-07-16 | 13F | Legend Financial Advisors, Inc. | 283 | 18 | ||||||
| 2025-05-15 | 13F | Prospera Financial Services Inc | 0 | −100,00 | 0 | |||||
| 2025-08-04 | 13F | Arkadios Wealth Advisors | 23 978 | 1,48 | 1 554 | 16,85 | ||||
| 2025-07-28 | 13F | Kiker Wealth Management, LLC | 0 | −100,00 | 0 | |||||
| 2025-07-24 | 13F | Us Bancorp \de\ | 36 | −77,78 | 2 | −77,78 | ||||
| 2025-07-10 | 13F | Wealth Enhancement Advisory Services, Llc | 9 310 | −1,89 | 603 | 13,13 | ||||
| 2025-08-15 | 13F | CI Private Wealth, LLC | 3 113 | 202 | ||||||
| 2025-08-04 | 13F | Assetmark, Inc | 228 | 15 | ||||||
| 2025-08-13 | 13F | Colonial Trust Co / SC | 691 | −24,89 | 45 | −13,73 | ||||
| 2025-08-14 | 13F | Main Street Financial Solutions, LLC | 14 256 | −4,35 | 924 | 10,14 | ||||
| 2025-08-11 | 13F | Brown Brothers Harriman & Co | 8 361 | 243,93 | 542 | 297,79 | ||||
| 2025-07-08 | 13F | Atlas Brown,Inc. | 10 356 | −1,12 | 671 | 13,92 | ||||
| 2025-07-16 | 13F | American National Bank | 12 878 | −1,69 | 835 | 13,16 | ||||
| 2025-08-06 | 13F | Atlantic Union Bankshares Corp | 400 | 26 | ||||||
| 2025-08-13 | 13F | Northwestern Mutual Wealth Management Co | 1 382 346 | 9,42 | 89 590 | 26,05 | ||||
| 2025-08-14 | 13F | Mariner, LLC | 10 338 | 15,61 | 670 | 33,20 | ||||
| 2025-04-24 | 13F | HighMark Wealth Management LLC | 0 | −100,00 | 0 | |||||
| 2025-08-04 | 13F | Savvy Advisors, Inc. | 4 788 | −1,05 | 310 | 13,97 | ||||
| 2025-08-11 | 13F | Anfield Capital Management, LLC | 163 | 185,96 | 11 | 233,33 | ||||
| 2025-08-14 | 13F | Comerica Bank | 2 817 | 0,11 | 183 | 15,19 | ||||
| 2025-05-01 | 13F | Fulcrum Equity Management | 0 | −100,00 | 0 | |||||
| 2025-07-28 | 13F | Copia Wealth Management | 125 | 0,00 | 8 | 14,29 | ||||
| 2025-08-14 | 13F | Royal Bank Of Canada | 11 009 | 0,20 | 714 | 15,53 | ||||
| 2025-05-12 | 13F | Sandy Spring Bank | 400 | 0,00 | 23 | −4,35 | ||||
| 2025-08-12 | 13F | Pathstone Holdings, LLC | 4 491 | 15,54 | 291 | 33,49 | ||||
| 2025-08-06 | 13F | Kcm Investment Advisors Llc | 7 302 | 0,00 | 473 | 15,37 | ||||
| 2025-07-18 | 13F | Vicus Capital | 289 689 | 4,39 | 18 775 | 20,25 | ||||
| 2025-08-06 | 13F | Stonebridge Financial Planning Group, LLC | 16 225 | 3,85 | 1 052 | 19,70 | ||||
| 2025-08-07 | 13F | Birchcreek Wealth Management, LLC | 19 342 | 12,11 | 1 254 | 29,18 | ||||
| 2025-08-13 | 13F | Lido Advisors, LLC | 1 867 729 | 4,49 | 121 048 | 20,37 | ||||
| 2025-05-08 | 13F | Plante Moran Financial Advisors, LLC | 0 | −100,00 | 0 | −100,00 | ||||
| 2025-08-19 | 13F | Asset Dedication, LLC | 334 | 22 | ||||||
| 2025-05-15 | 13F | Mercer Global Advisors Inc /adv | 0 | −100,00 | 0 | |||||
| 2025-08-14 | 13F | Vista Investment Management | 18 037 | 0,51 | 1 169 | 15,76 | ||||
| 2025-08-14 | 13F | Two Sigma Investments, Lp | 43 000 | 2 787 | ||||||
| 2025-08-06 | 13F | Mcrae Capital Management Inc | 3 116 | 202 | ||||||
| 2025-08-14 | 13F | Qube Research & Technologies Ltd | 4 920 | 1 423,22 | 319 | 1 666,67 | ||||
| 2025-08-04 | 13F | Prairie Wealth Advisors, Inc. | 4 166 | 1,21 | 270 | 16,45 | ||||
| 2025-08-12 | 13F | Atlas Capital Advisors Llc | 48 474 | −26,72 | 3 142 | −15,59 | ||||
| 2025-08-15 | 13F | Chapman Financial Group, Llc | 49 | 3 | ||||||
| 2025-07-28 | 13F | Acorn Financial Advisory Services Inc /adv | 5 977 | 31,91 | 387 | 52,36 | ||||
| 2025-07-21 | 13F | Exchange Capital Management, Inc. | 30 879 | −6,30 | 2 001 | 7,99 | ||||
| 2025-07-14 | 13F | Park Avenue Securities Llc | 3 098 | 0 | ||||||
| 2025-07-15 | 13F | Elevated Capital Advisors, LLC | 5 919 | 0,00 | 333 | 0,00 | ||||
| 2025-07-23 | 13F | Kingswood Wealth Advisors, Llc | 8 510 | 5,49 | 552 | 21,63 | ||||
| 2025-08-06 | 13F | Valued Wealth Advisors LLC | 178 | 0,00 | 12 | 10,00 | ||||
| 2025-07-14 | 13F | UMA Financial Services, Inc. | 166 | 0,00 | 11 | 11,11 | ||||
| 2025-07-17 | 13F | Sound Income Strategies, LLC | 546 | 0,00 | 35 | 16,67 | ||||
| 2025-08-12 | 13F | Trexquant Investment LP | 4 845 | 11,56 | 314 | 28,69 | ||||
| 2025-05-14 | 13F | River Wealth Advisors LLC | 0 | −100,00 | 0 | |||||
| 2025-08-13 | 13F | Congress Wealth Management LLC / DE / | 43 008 | 24,61 | 2 787 | 43,59 | ||||
| 2025-07-17 | 13F | Smith, Salley & Associates | 58 636 | 0,18 | 3 800 | 15,43 | ||||
| 2025-05-01 | 13F | High Note Wealth, LLC | 0 | −100,00 | 0 | |||||
| 2025-08-15 | 13F | Equitable Holdings, Inc. | 6 889 | −0,13 | 446 | 14,95 | ||||
| 2025-08-13 | 13F | Russell Investments Group, Ltd. | 189 | 26,85 | 12 | 50,00 | ||||
| 2025-07-30 | 13F | VCI Wealth Management LLC | 21 409 | 7,40 | 1 388 | 23,73 | ||||
| 2025-08-12 | 13F | Nemes Rush Group LLC | 0 | −100,00 | 0 | |||||
| 2025-07-16 | 13F | Beaumont Financial Advisors, LLC | 28 557 | 1 851 | ||||||
| 2025-08-05 | 13F | Bank Of Montreal /can/ | 0 | −100,00 | 0 | |||||
| 2025-08-14 | 13F | Colony Group, LLC | 12 274 | −3,13 | 795 | 11,66 | ||||
| 2025-08-11 | 13F | Citigroup Inc | 26 029 | 40,68 | 1 687 | 62,12 | ||||
| 2025-08-08 | 13F | Smithfield Trust Co | 6 650 | 41,19 | 0 | |||||
| 2025-07-25 | 13F | Envestnet Portfolio Solutions, Inc. | 0 | −100,00 | 0 | |||||
| 2025-07-28 | 13F | Axxcess Wealth Management, Llc | 0 | −100,00 | 0 | |||||
| 2025-08-14 | 13F | LaSalle St. Investment Advisors, LLC | 4 053 | −18,17 | 0 | |||||
| 2025-08-06 | 13F | Maltin Wealth Management, Inc. | 58 061 | 2,03 | 3 763 | 17,53 | ||||
| 2025-08-11 | 13F | Principal Securities, Inc. | 9 184 | 1 166,76 | 595 | 1 316,67 | ||||
| 2025-08-06 | 13F | Commonwealth Equity Services, Llc | 265 779 | 5,26 | 17 | 21,43 | ||||
| 2025-08-12 | 13F | LPL Financial LLC | 241 133 | 32,54 | 15 628 | 52,68 | ||||
| 2025-07-10 | 13F | Sovran Advisors, LLC | 6 256 | 10,61 | 401 | 35,02 | ||||
| 2025-08-01 | 13F | Rossby Financial, LCC | 531 | 0,00 | 34 | 17,24 | ||||
| 2025-08-11 | 13F | Beaumont Capital Management, LLC | 0 | −100,00 | 0 | |||||
| 2025-08-14 | 13F | Ameriprise Financial Inc | 4 280 | 1,21 | 277 | 16,88 | ||||
| 2025-08-11 | 13F | WPG Advisers, LLC | 79 | 0,00 | 5 | 25,00 |