Grundläggande statistik
| Institutionella ägare | 111 total, 111 long only, 0 short only, 0 long/short - change of 12,00% MRQ |
| Genomsnittlig portföljallokering | 0.0765 % - change of −21,66% MRQ |
| Institutionella aktier (lång) | 15 406 904 (ex 13D/G) - change of 0,73MM shares 4,94% MRQ |
| Institutionellt värde (lång) | $ 130 642 USD ($1000) |
Institutionellt ägande och aktieägare
Eaton Vance Risk-Managed Diversified Equity Income Fund (US:ETJ) har 111 Institutionella ägare och aktieägare som har lämnat in 13D/G- eller 13F-formulär till Securities Exchange Commission (SEC). Dessa institut innehar totalt 15,406,904 aktier. Största aktieägare inkluderar LPL Financial LLC, Raymond James Financial Inc, Advisor Group Holdings, Inc., Guggenheim Capital Llc, Morgan Stanley, Invesco Ltd., Cornerstone Advisors, LLC, PCEF - Invesco CEF Income Composite ETF, Cornerstone Strategic Value Fund Inc, and Cohen & Steers Closed-end Opportunity Fund, Inc. .
Eaton Vance Risk-Managed Diversified Equity Income Fund (NYSE:ETJ) Institutionell ägarstruktur visar institutioners och fonders nuvarande positioner i företaget, samt de senaste förändringarna i positionernas storlek. Större aktieägare kan vara enskilda investerare, fonder, hedgefonder eller institutioner. Bilaga 13D visar att investeraren äger (eller ägde) mer än 5% av företaget och avser (eller avsåg) att aktivt eftersträva en förändring av affärsstrategin. Schedule 13G indikerar en passiv investering på över 5%.
The share price as of September 9, 2025 is 9,09 / share. Previously, on September 10, 2024, the share price was 8,98 / share. This represents an increase of 1,22% over that period.

Fondsentimentets poäng
Fondsentimentet poängen(fka Ägarackumulation-poäng) visar vilka aktier som är mest köpta av fonder. Det är resultatet av en sofistikerad kvantitativ flerfaktormodell som identifierar företag med de högsta nivåerna av institutionell ackumulering. Poängsättningsmodellen använder en kombination av den totala ökningen av redovisade ägare, förändringarna i portföljallokeringarna för dessa ägare och andra mått. Siffran sträcker sig från 0 till 100, där högre siffror indikerar en högre nivå av ackumulering i förhållande till sina konkurrenter, och 50 är genomsnittet.
Uppdateringsfrekvens: Dagligen
Se Ownership Explorer, som innehåller en lista över de högst rankade företagen.
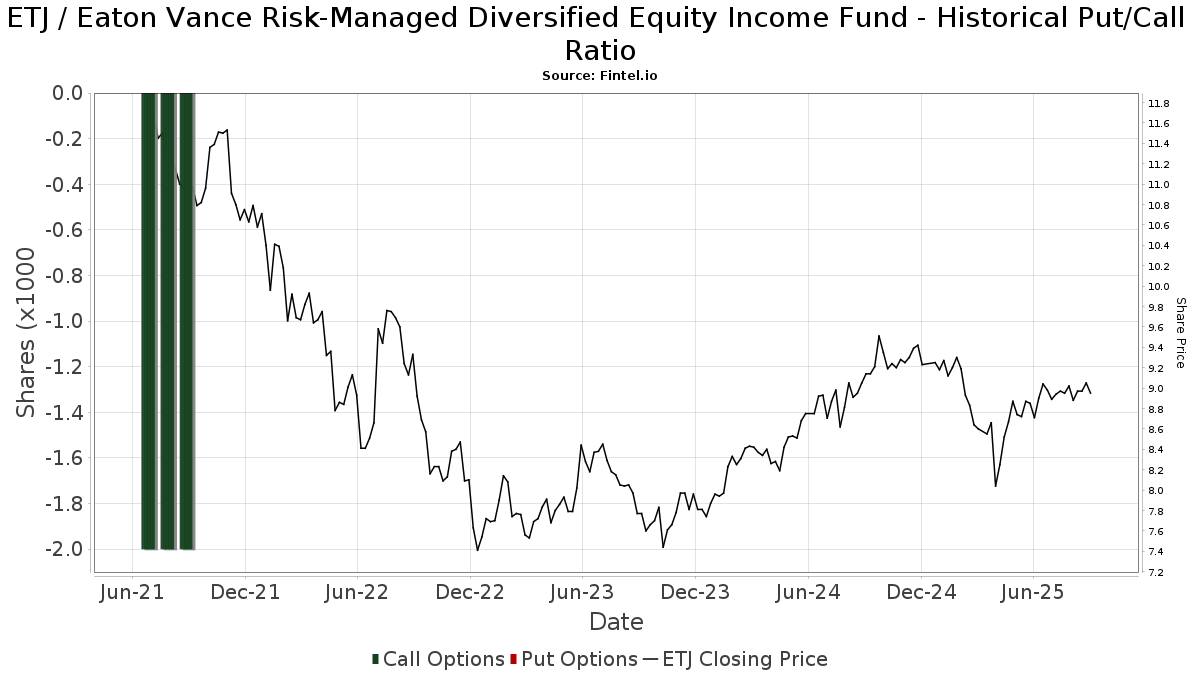
Institutionell sälj/köp-kvot
Förutom att rapportera vanliga eget kapital- och skuldemissioner måste institutioner med mer än 100MM tillgångar under förvaltning också avslöja sina innehav av sälj- och köpoptioner. Eftersom säljoptioner i allmänhet indikerar ett negativt sentiment och köpoptioner indikerar ett positivt sentiment, kan vi få en uppfattning om det övergripande institutionella sentimentet genom att plotta förhållandet mellan säljoptioner och köpoptioner. Diagrammet till höger visar det historiska förhållandet mellan sälj- och köpoptioner för detta instrument.
Genom att använda sälj/köp-kvoten som en indikator på aktieägarnas sentiment undviker man en av de största bristerna med att använda det totala institutionella ägandet, nämligen att en betydande del av de förvaltade tillgångarna investeras passivt för att följa index. Passivt förvaltade fonder köper vanligtvis inte optioner, så indikatorn för sälj/köp-kvoten ger en bättre bild av stämningen i aktivt förvaltade fonder.
13F- och NPORT-arkiveringar
Detaljer om 13F-arkiveringar är gratis. Detaljer om NP-arkiveringar kräver ett premiummedlemskap. Gröna rader indikerar nya positioner. Röda rader indikerar stängda positioner. Klicka på länk symbolen för att se hela transaktionshistoriken.
Uppgradera
för att låsa upp premiumdata och exportera till Excel ![]() .
.
| Fil Datum | Källa | Investerare | Typ | Genomsnittligt pris (beräknat) |
Aktier | Δ Aktier (%) |
Rapporterat värde (1000 USD) |
Δ Värde (%) |
Portföljallokering (%) |
|
|---|---|---|---|---|---|---|---|---|---|---|
| 2025-07-31 | 13F | Curio Wealth, Llc | 0 | −100,00 | 0 | |||||
| 2025-07-31 | 13F | Cambridge Investment Research Advisors, Inc. | 181 450 | −8,41 | 2 | 0,00 | ||||
| 2025-08-14 | 13F | Comerica Bank | 2 060 | 0,59 | 19 | 5,88 | ||||
| 2025-08-13 | 13F | Baird Financial Group, Inc. | 28 016 | 52,03 | 253 | 63,23 | ||||
| 2025-07-21 | 13F | Successful Portfolios LLC | 26 476 | 0,00 | 239 | 7,17 | ||||
| 2025-08-12 | 13F | Gladstone Institutional Advisory LLC | 11 240 | 0,00 | 102 | 6,32 | ||||
| 2025-07-08 | 13F | Parallel Advisors, LLC | 3 787 | −14,42 | 34 | −8,11 | ||||
| 2025-08-13 | 13F | SageView Advisory Group, LLC | 58 001 | 53,63 | 520 | 63,01 | ||||
| 2025-08-14 | 13F | Kovitz Investment Group Partners, LLC | 46 892 | 424 | ||||||
| 2025-08-14 | 13F | Wells Fargo & Company/mn | 306 986 | −2,85 | 2 775 | 3,82 | ||||
| 2025-08-06 | 13F | Commonwealth Equity Services, Llc | 52 994 | −7,52 | 0 | |||||
| 2025-08-11 | 13F | Private Advisor Group, LLC | 106 421 | −1,53 | 962 | 5,25 | ||||
| 2025-08-11 | 13F | Semus Wealth Partners LLC | 28 138 | 0,73 | 254 | 7,63 | ||||
| 2025-08-19 | 13F | Advisory Services Network, LLC | 82 327 | −2,03 | 738 | 3,94 | ||||
| 2025-08-08 | 13F | Cornerstone Advisors, LLC | 873 368 | 40,93 | 7 895 | 50,61 | ||||
| 2025-05-15 | 13F | Two Sigma Securities, Llc | 0 | −100,00 | 0 | −100,00 | ||||
| 2025-04-22 | 13F | Synergy Financial Management, LLC | 0 | −100,00 | 0 | |||||
| 2025-08-14 | 13F | Garden State Investment Advisory Services LLC | 49 886 | 8,19 | 451 | 15,64 | ||||
| 2025-08-18 | 13F | Geneos Wealth Management Inc. | 3 855 | 55,76 | 35 | 70,00 | ||||
| 2025-08-08 | 13F | Creative Planning | 200 275 | −6,08 | 1 810 | 0,39 | ||||
| 2025-07-10 | 13F | Marshall Financial Group LLC | 12 402 | 0,00 | 111 | 6,73 | ||||
| 2025-07-16 | 13F | Formidable Asset Management, LLC | 29 100 | 0,00 | 246 | 0,00 | ||||
| 2025-07-29 | 13F | Stratos Wealth Advisors, LLC | 30 000 | −3,85 | 271 | 3,04 | ||||
| 2025-07-10 | 13F | Oliver Lagore Vanvalin Investment Group | 9 700 | 0,00 | 82 | −8,89 | ||||
| 2025-08-14 | 13F | Smartleaf Asset Management LLC | 1 273 | −0,78 | 11 | 10,00 | ||||
| 2025-08-29 | 13F | Centaurus Financial, Inc. | 68 318 | −1,07 | 1 | |||||
| 2025-08-27 | NP | RYMSX - Guggenheim Multi-Hedge Strategies Fund Class P | 209 | −37,98 | 2 | −50,00 | ||||
| 2025-08-04 | 13F | ELCO Management Co., LLC | 43 520 | −2,25 | 393 | 4,52 | ||||
| 2025-08-13 | 13F | Guggenheim Capital Llc | 1 102 606 | −11,01 | 9 968 | −4,90 | ||||
| 2025-08-14 | 13F | Balyasny Asset Management Llc | 28 407 | 257 | ||||||
| 2025-08-12 | 13F | Proequities, Inc. | 0 | 0 | ||||||
| 2025-08-28 | NP | Cohen & Steers Closed-end Opportunity Fund, Inc. | 487 446 | 14,04 | 4 407 | 21,85 | ||||
| 2025-04-15 | 13F | Noble Wealth Management PBC | 2 500 | 0,00 | 21 | −8,70 | ||||
| 2025-08-13 | 13F | Invesco Ltd. | 912 531 | 2,95 | 8 249 | 10,02 | ||||
| 2025-05-12 | 13F | Independent Advisor Alliance | 0 | −100,00 | 0 | |||||
| 2025-08-05 | 13F | GPS Wealth Strategies Group, LLC | 11 509 | 0,00 | 104 | 7,22 | ||||
| 2025-08-01 | 13F | Transcend Wealth Collective, Llc | 0 | −100,00 | 0 | |||||
| 2025-08-15 | 13F | Morgan Stanley | 980 660 | 24,92 | 8 865 | 33,49 | ||||
| 2025-07-23 | 13F | WESPAC Advisors, LLC | 33 500 | 0,00 | 303 | 6,71 | ||||
| 2025-08-12 | 13F | Manchester Capital Management LLC | 2 000 | 0,00 | 18 | 12,50 | ||||
| 2025-08-05 | 13F | Sigma Planning Corp | 32 264 | −4,29 | 292 | 2,11 | ||||
| 2025-09-09 | 13F | NWF Advisory Services Inc. | 15 300 | 0,00 | 138 | 6,98 | ||||
| 2025-08-14 | 13F | Jane Street Group, Llc | 17 124 | 155 | ||||||
| 2025-08-14 | 13F | Royal Bank Of Canada | 97 382 | 4,08 | 880 | 11,11 | ||||
| 2025-08-13 | 13F | Northwestern Mutual Wealth Management Co | 4 296 | −84,65 | 39 | −83,90 | ||||
| 2025-08-15 | 13F | Tower Research Capital LLC (TRC) | 10 | 0 | ||||||
| 2025-09-04 | 13F/A | Advisor Group Holdings, Inc. | 1 175 003 | 6,52 | 10 622 | 13,84 | ||||
| 2025-08-11 | 13F | Principal Securities, Inc. | 17 982 | −2,41 | 163 | −5,26 | ||||
| 2025-08-12 | 13F | Advisors Asset Management, Inc. | 325 269 | 24,87 | 2 940 | 33,45 | ||||
| 2025-08-14 | 13F | Ameriprise Financial Inc | 401 249 | 5,19 | 3 627 | 12,40 | ||||
| 2025-07-10 | 13F | Wealth Enhancement Advisory Services, Llc | 32 052 | 290 | ||||||
| 2025-07-31 | 13F | Oppenheimer & Co Inc | 13 142 | 0,00 | 119 | 6,31 | ||||
| 2025-08-11 | 13F | CBIZ Investment Advisory Services, LLC | 0 | 0 | ||||||
| 2025-08-14 | 13F | Stifel Financial Corp | 73 890 | −5,74 | 668 | 0,60 | ||||
| 2025-08-22 | NP | Cornerstone Strategic Value Fund Inc | 579 104 | 44,07 | 5 235 | 53,97 | ||||
| 2025-07-11 | 13F | Congress Park Capital LLC | 12 000 | −20,00 | 108 | −14,29 | ||||
| 2025-07-08 | 13F | Nbc Securities, Inc. | 34 098 | 43,18 | 0 | |||||
| 2025-08-13 | 13F | Everstar Asset Management, LLC | 16 955 | 0,00 | 153 | 6,99 | ||||
| 2025-07-29 | 13F | Primoris Wealth Advisors, Llc | 16 067 | 0,02 | 145 | 7,41 | ||||
| 2025-08-12 | 13F | Steward Partners Investment Advisory, Llc | 17 809 | −0,24 | 161 | 5,96 | ||||
| 2025-07-21 | 13F | Creative Capital Management Investments LLC | 4 694 | 0,00 | 42 | 7,69 | ||||
| 2025-08-05 | 13F | Pointe Capital Management LLC | 68 626 | 0,61 | 620 | 7,45 | ||||
| 2025-08-14 | 13F | Ausdal Financial Partners, Inc. | 87 200 | −6,57 | 788 | −0,13 | ||||
| 2025-08-12 | 13F | Landscape Capital Management, L.l.c. | 0 | −100,00 | 0 | |||||
| 2025-08-14 | 13F | CoreCap Advisors, LLC | 6 760 | 0,00 | 61 | 7,02 | ||||
| 2025-08-07 | 13F | Allworth Financial LP | 20 117 | 182 | ||||||
| 2025-07-21 | 13F | Catalina Capital Group, LLC | 13 172 | 119 | ||||||
| 2025-07-29 | 13F | International Assets Investment Management, Llc | 15 609 | 14,70 | 141 | 22,61 | ||||
| 2025-05-09 | 13F | Pathway Financial Advisers, LLC | 0 | −100,00 | 0 | |||||
| 2025-07-11 | 13F | Farther Finance Advisors, LLC | 7 590 | 69 | ||||||
| 2025-08-01 | 13F | Gwn Securities Inc. | 19 905 | 180 | ||||||
| 2025-08-14 | 13F | Two Sigma Investments, Lp | 58 247 | 527 | ||||||
| 2025-08-27 | NP | RYDEX VARIABLE TRUST - Multi-Hedge Strategies Fund Variable Annuity | 351 | −20,23 | 3 | 0,00 | ||||
| 2025-07-22 | 13F | Global Assets Advisory, LLC | 0 | −100,00 | 0 | |||||
| 2025-08-04 | 13F | Flagship Harbor Advisors, Llc | 14 578 | 1,38 | 132 | 8,26 | ||||
| 2025-08-05 | 13F | Strategic Financial Concepts, LLC | 16 100 | 0,00 | 146 | 6,62 | ||||
| 2025-08-14 | 13F | Mml Investors Services, Llc | 11 910 | 0,00 | 0 | |||||
| 2025-08-07 | 13F | Vista Investment Partners Ii, Llc | 11 081 | −2,34 | 100 | 5,26 | ||||
| 2025-07-28 | 13F | Harbour Investments, Inc. | 1 000 | 9 | ||||||
| 2025-08-11 | 13F | Western Wealth Management, LLC | 14 761 | 0,94 | 133 | 8,13 | ||||
| 2025-07-30 | 13F | Princeton Global Asset Management LLC | 5 752 | 0,00 | 52 | 8,33 | ||||
| 2025-07-21 | 13F | Ameritas Advisory Services, LLC | 17 156 | 0,00 | 155 | −2,52 | ||||
| 2025-08-19 | 13F | National Asset Management, Inc. | 12 149 | 110 | ||||||
| 2025-07-14 | 13F | Hoey Investments, Inc | 2 000 | −50,00 | 18 | −45,45 | ||||
| 2025-05-13 | 13F | Syverson Strege & Co | 0 | −100,00 | 0 | |||||
| 2025-08-11 | 13F | WPG Advisers, LLC | 247 | 2 | ||||||
| 2025-08-11 | 13F | Elequin Capital Lp | 0 | −100,00 | 0 | |||||
| 2025-08-15 | 13F | First Heartland Consultants, Inc. | 95 925 | −11,86 | 867 | −5,76 | ||||
| 2025-07-30 | 13F | Insight Advisors, LLC/ PA | 11 366 | 2,25 | 103 | 8,51 | ||||
| 2025-07-15 | 13F | Wealth Effects Llc | 15 450 | −15,33 | 140 | −9,74 | ||||
| 2025-08-08 | 13F | Cetera Investment Advisers | 27 319 | 0,54 | 247 | 7,42 | ||||
| 2025-08-13 | 13F | WCG Wealth Advisors LLC | 50 686 | 72,04 | 458 | 83,94 | ||||
| 2025-07-28 | NP | PCEF - Invesco CEF Income Composite ETF This fund is a listed as child fund of Invesco Ltd. and if that institution has disclosed ownership in this security, then these positions will not be double counted when calculating total shares and total value | 848 866 | 2,06 | 7 512 | 0,91 | ||||
| 2025-07-09 | 13F | David J Yvars Group | 33 180 | 19,08 | 300 | 27,23 | ||||
| 2025-07-18 | 13F | Liberty Capital Management, Inc. | 16 170 | 0,00 | 146 | 7,35 | ||||
| 2025-08-14 | 13F | LaSalle St. Investment Advisors, LLC | 42 773 | 1 | ||||||
| 2025-08-08 | 13F | TD Capital Management LLC | 1 023 | 0,00 | 9 | 12,50 | ||||
| 2025-08-14 | 13F | IHT Wealth Management, LLC | 186 704 | −3,16 | 1 688 | 3,50 | ||||
| 2025-08-14 | 13F | Raymond James Financial Inc | 1 708 700 | 6,68 | 15 447 | 13,99 | ||||
| 2025-07-14 | 13F | Armstrong Advisory Group, Inc | 1 511 | 14 | ||||||
| 2025-07-14 | 13F | GAMMA Investing LLC | 8 000 | 72 | ||||||
| 2025-07-16 | 13F | Diversified Enterprises, LLC | 11 675 | −1,43 | 106 | 5,00 | ||||
| 2025-08-14 | 13F | Cohen & Steers, Inc. | 487 446 | 14,04 | 4 | 33,33 | ||||
| 2025-08-04 | 13F | Kovack Advisors, Inc. | 13 247 | 120 | ||||||
| 2025-08-06 | 13F | Financial Alternatives, Inc | 202 824 | −4,89 | 1 834 | 1,61 | ||||
| 2025-08-12 | 13F | LPL Financial LLC | 2 193 740 | 2,31 | 19 831 | 9,32 | ||||
| 2025-08-14 | 13F | Warren Averett Asset Management, LLC | 11 560 | 0,00 | 105 | 7,22 | ||||
| 2025-04-15 | 13F | Fifth Third Bancorp | 0 | −100,00 | 0 | |||||
| 2025-07-17 | 13F | Janney Montgomery Scott LLC | 66 920 | −5,30 | 1 | |||||
| 2025-08-18 | 13F | Hollencrest Capital Management | 1 550 | 0,00 | 14 | 7,69 | ||||
| 2025-07-25 | 13F | Atria Wealth Solutions, Inc. | 16 352 | 148 | ||||||
| 2025-08-14 | 13F | Bank Of America Corp /de/ | 152 490 | −16,37 | 1 379 | −10,64 | ||||
| 2025-08-14 | 13F | UBS Group AG | 86 478 | 5,98 | 782 | 13,19 | ||||
| 2025-08-01 | 13F | Winebrenner Capital Management Llc | 80 000 | −11,11 | 723 | −4,99 | ||||
| 2025-08-13 | 13F | Luminist Capital LLC | 697 | 0,00 | 6 | 20,00 | ||||
| 2025-08-07 | 13F | Readystate Asset Management Lp | 45 607 | −47,15 | 412 | −43,56 | ||||
| 2025-05-14 | 13F | Van Hulzen Asset Management, LLC | 0 | −100,00 | 0 | −100,00 | ||||
| 2025-07-23 | 13F | Kingswood Wealth Advisors, Llc | 0 | −100,00 | 0 | |||||
| 2025-08-13 | 13F | Summit Financial, LLC | 17 675 | 160 | ||||||
| 2025-08-11 | 13F | HighTower Advisors, LLC | 48 441 | −1,70 | 438 | 5,05 | ||||
| 2025-08-14 | 13F | GWM Advisors LLC | 40 039 | −1,23 | 362 | 5,56 | ||||
| 2025-07-29 | 13F | Private Trust Co Na | 2 000 | 0,00 | 18 | 12,50 | ||||
| 2025-08-22 | NP | Cornerstone Total Return Fund Inc | 294 264 | 35,14 | 2 660 | 44,41 | ||||
| 2025-05-07 | 13F | Sheaff Brock Investment Advisors, LLC | 20 117 | 0,00 | 170 | −9,09 | ||||
| 2025-07-29 | 13F | FLC Capital Advisors | 0 | −100,00 | 0 | |||||
| 2025-08-05 | 13F | Shaker Financial Services, LLC | 303 924 | −41,47 | 2 747 | −37,45 | ||||
| 2025-08-12 | 13F | MAI Capital Management | 3 197 | −22,53 | 29 | −17,65 |