Grundläggande statistik
| Institutionella ägare | 182 total, 181 long only, 0 short only, 1 long/short - change of 1,10% MRQ |
| Genomsnittlig portföljallokering | 0.1502 % - change of 58,43% MRQ |
| Institutionella aktier (lång) | 28 114 875 (ex 13D/G) - change of −3,31MM shares −10,53% MRQ |
| Institutionellt värde (lång) | $ 1 375 415 USD ($1000) |
Institutionellt ägande och aktieägare
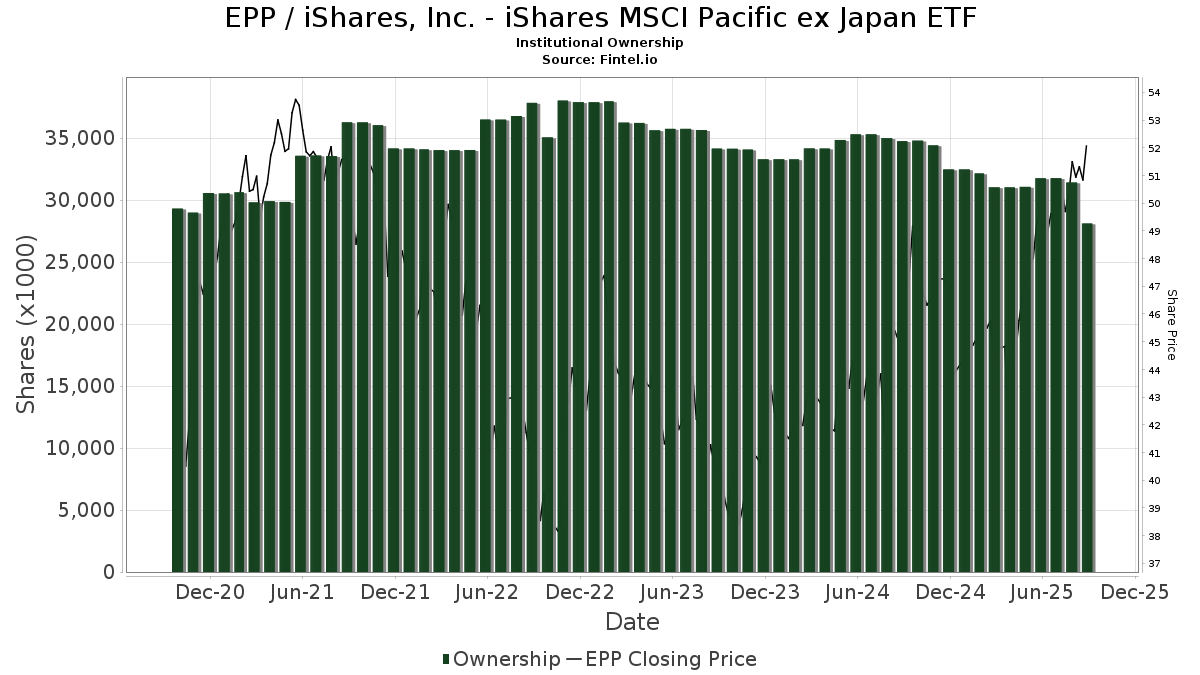
iShares, Inc. - iShares MSCI Pacific ex Japan ETF (US:EPP) har 182 Institutionella ägare och aktieägare som har lämnat in 13D/G- eller 13F-formulär till Securities Exchange Commission (SEC). Dessa institut innehar totalt 28,114,875 aktier. Största aktieägare inkluderar Jpmorgan Chase & Co, Goldman Sachs Group Inc, Bank Of America Corp /de/, BlackRock, Inc., Asset Management One Co., Ltd., Morgan Stanley, UBS Group AG, Deutsche Bank Ag\, Prudential Plc, and Royal Bank Of Canada .
iShares, Inc. - iShares MSCI Pacific ex Japan ETF (ARCA:EPP) Institutionell ägarstruktur visar institutioners och fonders nuvarande positioner i företaget, samt de senaste förändringarna i positionernas storlek. Större aktieägare kan vara enskilda investerare, fonder, hedgefonder eller institutioner. Bilaga 13D visar att investeraren äger (eller ägde) mer än 5% av företaget och avser (eller avsåg) att aktivt eftersträva en förändring av affärsstrategin. Schedule 13G indikerar en passiv investering på över 5%.
The share price as of September 8, 2025 is 51,67 / share. Previously, on September 9, 2024, the share price was 45,29 / share. This represents an increase of 14,09% over that period.
Fondsentimentets poäng
Fondsentimentet poängen(fka Ägarackumulation-poäng) visar vilka aktier som är mest köpta av fonder. Det är resultatet av en sofistikerad kvantitativ flerfaktormodell som identifierar företag med de högsta nivåerna av institutionell ackumulering. Poängsättningsmodellen använder en kombination av den totala ökningen av redovisade ägare, förändringarna i portföljallokeringarna för dessa ägare och andra mått. Siffran sträcker sig från 0 till 100, där högre siffror indikerar en högre nivå av ackumulering i förhållande till sina konkurrenter, och 50 är genomsnittet.
Uppdateringsfrekvens: Dagligen
Se Ownership Explorer, som innehåller en lista över de högst rankade företagen.
Institutionell sälj/köp-kvot
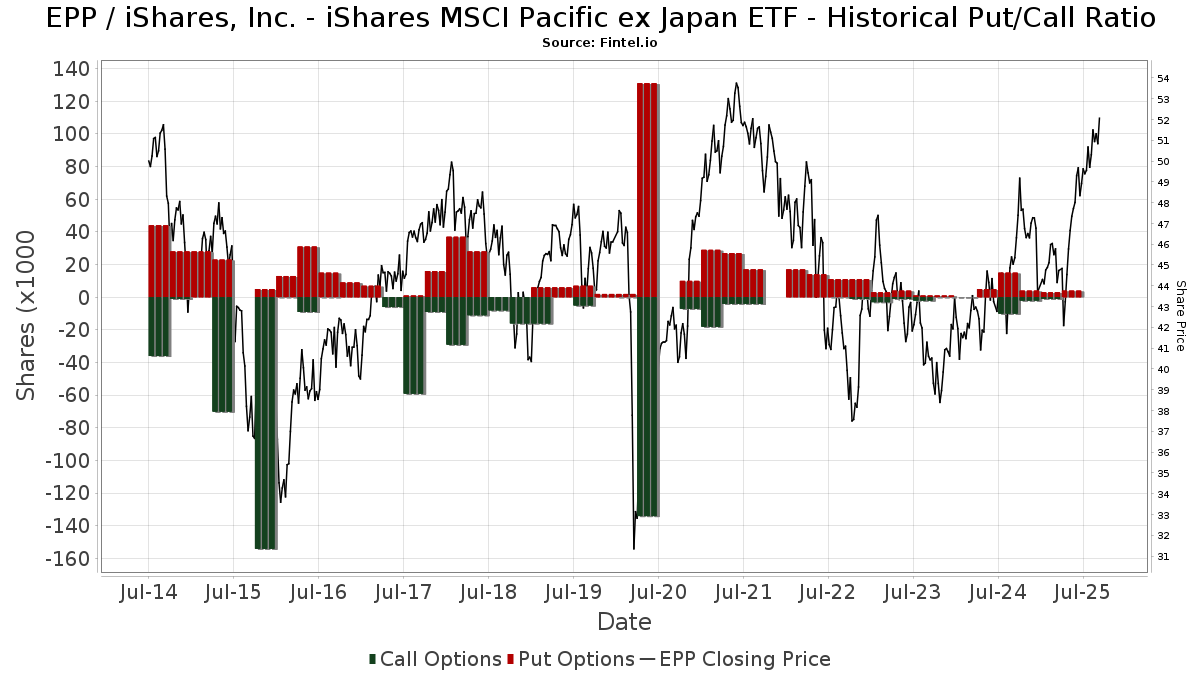
Förutom att rapportera vanliga eget kapital- och skuldemissioner måste institutioner med mer än 100MM tillgångar under förvaltning också avslöja sina innehav av sälj- och köpoptioner. Eftersom säljoptioner i allmänhet indikerar ett negativt sentiment och köpoptioner indikerar ett positivt sentiment, kan vi få en uppfattning om det övergripande institutionella sentimentet genom att plotta förhållandet mellan säljoptioner och köpoptioner. Diagrammet till höger visar det historiska förhållandet mellan sälj- och köpoptioner för detta instrument.
Genom att använda sälj/köp-kvoten som en indikator på aktieägarnas sentiment undviker man en av de största bristerna med att använda det totala institutionella ägandet, nämligen att en betydande del av de förvaltade tillgångarna investeras passivt för att följa index. Passivt förvaltade fonder köper vanligtvis inte optioner, så indikatorn för sälj/köp-kvoten ger en bättre bild av stämningen i aktivt förvaltade fonder.
13F- och NPORT-arkiveringar
Detaljer om 13F-arkiveringar är gratis. Detaljer om NP-arkiveringar kräver ett premiummedlemskap. Gröna rader indikerar nya positioner. Röda rader indikerar stängda positioner. Klicka på länk symbolen för att se hela transaktionshistoriken.
Uppgradera
för att låsa upp premiumdata och exportera till Excel ![]() .
.
| Fil Datum | Källa | Investerare | Typ | Genomsnittligt pris (beräknat) |
Aktier | Δ Aktier (%) |
Rapporterat värde (1000 USD) |
Δ Värde (%) |
Portföljallokering (%) |
|
|---|---|---|---|---|---|---|---|---|---|---|
| 2025-08-12 | 13F | MAI Capital Management | 90 | 4 | ||||||
| 2025-08-14 | 13F | BTG Pactual Asset Management US LLC | 79 459 | −0,17 | 3 923 | 11,74 | ||||
| 2025-08-12 | 13F | O'shaughnessy Asset Management, Llc | 561 | −8,33 | 28 | 3,85 | ||||
| 2025-08-13 | 13F | Flow Traders U.s. Llc | 114 179 | 6 | ||||||
| 2025-07-31 | 13F | Brinker Capital Investments, LLC | 0 | −100,00 | 0 | −100,00 | ||||
| 2025-07-10 | 13F | Wealth Enhancement Advisory Services, Llc | 5 945 | 0,00 | 295 | 12,60 | ||||
| 2025-08-13 | 13F | Forthright Family Wealth Advisory LLC | 0 | −100,00 | 0 | −100,00 | ||||
| 2025-07-24 | 13F | Us Bancorp \de\ | 3 283 | 1,64 | 162 | 14,08 | ||||
| 2025-09-04 | 13F/A | Advisor Group Holdings, Inc. | 39 846 | 16,84 | 1 967 | 30,87 | ||||
| 2025-08-14 | 13F | Raymond James Financial Inc | 74 480 | −40,01 | 3 677 | −32,84 | ||||
| 2025-08-14 | 13F | Wharton Business Group, LLC | 7 127 | −5,75 | 0 | |||||
| 2025-08-14 | 13F | Fmr Llc | 3 199 | 13,40 | 158 | 26,61 | ||||
| 2025-08-05 | 13F | Huntington National Bank | 296 | 12,12 | ||||||
| 2025-08-14 | 13F | Ancora Advisors, LLC | 1 100 | 0,00 | 54 | 12,50 | ||||
| 2025-07-31 | 13F | Glass Jacobson Investment Advisors llc | 225 | 0,00 | 11 | 22,22 | ||||
| 2025-07-17 | 13F | City Holding Co | 0 | −100,00 | 0 | |||||
| 2025-07-21 | 13F | Synergy Financial Management, LLC | 8 536 | 421 | ||||||
| 2025-08-14 | 13F | Syon Capital Llc | 147 298 | 48,08 | 7 272 | 65,80 | ||||
| 2025-08-14 | 13F | Aberdeen Wealth Management LLC | 300 | 15 | ||||||
| 2025-08-18 | 13F/A | National Bank Of Canada /fi/ | 190 | 0,00 | 9 | 12,50 | ||||
| 2025-07-31 | 13F | Asset Management One Co., Ltd. | 1 494 651 | 0,80 | 73 791 | 12,84 | ||||
| 2025-07-24 | 13F | Lmcg Investments, Llc | 90 740 | −4,86 | 4 480 | 6,49 | ||||
| 2025-08-13 | 13F | Northwestern Mutual Wealth Management Co | 5 426 | −73,90 | 268 | −70,85 | ||||
| 2025-07-08 | 13F/A | Salem Investment Counselors Inc | 40 | 0,00 | 2 | 0,00 | ||||
| 2025-08-08 | 13F | SBI Securities Co., Ltd. | 6 167 | 6,16 | 304 | 18,75 | ||||
| 2025-08-14 | 13F | Quantinno Capital Management LP | 5 841 | 4,62 | 288 | 17,07 | ||||
| 2025-05-14 | 13F | Renaissance Technologies Llc | 0 | −100,00 | 0 | −100,00 | ||||
| 2025-08-28 | NP | Northern Lights Fund Trust - Sierra Tactical Risk Spectrum 70 Fund Investor Class | 39 900 | 1 970 | ||||||
| 2025-07-09 | 13F | Massmutual Trust Co Fsb/adv | 15 320 | −4,00 | 756 | 7,54 | ||||
| 2025-08-07 | 13F/A | Curat Global, LLC | 9 368 | 0,00 | 462 | 11,86 | ||||
| 2025-08-12 | 13F | Stelac Advisory Services LLC | 48 101 | 0,00 | 2 375 | 11,82 | ||||
| 2025-08-01 | 13F | Biltmore Family Office, LLC | 5 178 | 0,00 | 256 | 11,84 | ||||
| 2025-08-14 | 13F | Federation des caisses Desjardins du Quebec | 270 | 0,00 | 13 | 18,18 | ||||
| 2025-08-14 | 13F | Hilltop Holdings Inc. | 40 077 | 1 979 | ||||||
| 2025-04-11 | 13F | Ehrlich Financial Group | 0 | −100,00 | 0 | −100,00 | ||||
| 2025-07-24 | 13F | Jfs Wealth Advisors, Llc | 250 | 0,00 | 12 | 9,09 | ||||
| 2025-08-11 | 13F | HighTower Advisors, LLC | 8 936 | −39,92 | 441 | −32,67 | ||||
| 2025-08-12 | 13F | LPL Financial LLC | 91 323 | 29,26 | 4 509 | 44,72 | ||||
| 2025-08-04 | 13F | Keybank National Association/oh | 14 587 | −7,72 | 720 | 3,30 | ||||
| 2025-08-08 | 13F | VERITY Wealth Advisors | 5 740 | 0,00 | 283 | 11,86 | ||||
| 2025-08-14 | 13F | Stifel Financial Corp | 17 523 | 865 | ||||||
| 2025-08-12 | 13F | Archer Investment Corp | 69 | 0,00 | 3 | 0,00 | ||||
| 2025-05-15 | 13F | GWM Advisors LLC | 0 | −100,00 | 0 | |||||
| 2025-08-19 | 13F | Delos Wealth Advisors, LLC | 112 | 6 | ||||||
| 2025-07-07 | 13F | Versant Capital Management, Inc | 12 | 0,00 | 1 | |||||
| 2025-08-12 | 13F | Prudential Plc | 293 500 | 14 490 | ||||||
| 2025-07-29 | 13F | Yoffe Investment Management, LLC | 8 163 | 0,00 | 403 | 12,26 | ||||
| 2025-07-08 | 13F | Parallel Advisors, LLC | 0 | −100,00 | 0 | |||||
| 2025-08-12 | 13F | Boreal Capital Management LLC | 545 | 27 | ||||||
| 2025-08-05 | 13F | Israel Discount Bank of New York | 6 740 | −1,12 | 333 | 10,67 | ||||
| 2025-08-13 | 13F | Northern Trust Corp | 7 319 | 361 | ||||||
| 2025-08-08 | 13F | Banco Bilbao Vizcaya Argentaria, S.a. | 40 615 | 0,00 | 2 004 | 11,65 | ||||
| 2025-08-12 | 13F | SRS Capital Advisors, Inc. | 250 | 0,00 | 12 | 9,09 | ||||
| 2025-07-24 | 13F | Blair William & Co/il | 11 035 | −5,61 | 545 | 5,63 | ||||
| 2025-04-22 | 13F | PFG Investments, LLC | 0 | −100,00 | 0 | |||||
| 2025-08-06 | 13F | Golden State Wealth Management, LLC | 54 | 3 | ||||||
| 2025-08-12 | 13F | Franklin Resources Inc | 2 000 | 99 | ||||||
| 2025-08-14 | 13F | Ameriprise Financial Inc | 93 302 | −13,05 | 4 605 | −2,72 | ||||
| 2025-08-14 | 13F/A | Skopos Labs, Inc. | 7 971 | 329 | ||||||
| 2025-08-12 | 13F | Insigneo Advisory Services, Llc | 4 768 | 235 | ||||||
| 2025-08-14 | 13F | DZ BANK AG Deutsche Zentral Genossenschafts Bank, Frankfurt am Main | 0 | −100,00 | 0 | |||||
| 2025-08-07 | 13F | Rathbone Brothers plc | 109 977 | −3,34 | 5 430 | 8,21 | ||||
| 2025-07-28 | 13F | BRYN MAWR TRUST Co | 2 806 | 10,08 | 139 | 23,21 | ||||
| 2025-05-09 | 13F | Wealthspire Advisors, LLC | 0 | −100,00 | 0 | |||||
| 2025-08-08 | 13F | Atlantic Trust, LLC | 43 | 2 | ||||||
| 2025-08-28 | NP | Northern Lights Fund Trust - Sierra Tactical Risk Spectrum 30 Fund Instl Class | 46 700 | 2 306 | ||||||
| 2025-08-08 | 13F | Gts Securities Llc | 11 538 | 7,23 | 570 | 20,04 | ||||
| 2025-07-23 | 13F | 1 North Wealth Services Llc | 1 | 0,00 | 0 | |||||
| 2025-08-14 | 13F | Susquehanna International Group, Llp | 29 134 | −66,15 | 1 438 | −62,11 | ||||
| 2025-07-23 | 13F | Integris Wealth Management, LLC | 39 577 | −1,34 | 1 954 | 10,40 | ||||
| 2025-08-14 | 13F | Susquehanna International Group, Llp | Put | 4 800 | 237 | |||||
| 2025-08-13 | 13F | Lido Advisors, LLC | 7 332 | −10,93 | 362 | −0,28 | ||||
| 2025-08-04 | 13F | AMG National Trust Bank | 5 451 | −3,11 | 269 | 8,47 | ||||
| 2025-08-07 | 13F | Resolute Advisors LLC | 21 145 | 1,79 | 1 044 | 13,86 | ||||
| 2025-08-05 | 13F | swisspartners Advisors Ltd | 11 225 | 5,75 | 554 | 33,57 | ||||
| 2025-07-08 | 13F | Nbc Securities, Inc. | 1 600 | −50,00 | 0 | |||||
| 2025-07-24 | 13F | Brandywine Oak Private Wealth Llc | 9 158 | 0,00 | 452 | 12,16 | ||||
| 2025-07-25 | 13F | Cwm, Llc | 491 | 29,89 | 0 | |||||
| 2025-07-24 | 13F | IFP Advisors, Inc | 579 | 0,00 | 29 | 12,00 | ||||
| 2025-08-14 | 13F | Blue Capital, Inc. | 0 | −100,00 | 0 | |||||
| 2025-07-17 | 13F | Park Place Capital Corp | 0 | −100,00 | 0 | |||||
| 2025-08-08 | 13F | Cetera Investment Advisers | 4 556 | 225 | ||||||
| 2025-08-15 | 13F | Kestra Advisory Services, LLC | 8 055 | −93,47 | 398 | −92,70 | ||||
| 2025-08-14 | 13F/A | Rockefeller Capital Management L.P. | 101 460 | −1,86 | 5 009 | 9,87 | ||||
| 2025-08-14 | 13F | Cooperman Leon G | 7 610 | 0,00 | 376 | 11,94 | ||||
| 2025-08-14 | 13F | Bnp Paribas Arbitrage, Sa | 12 | −99,95 | 1 | −100,00 | ||||
| 2025-08-14 | 13F | Citadel Advisors Llc | 74 919 | 278,25 | 3 699 | 323,60 | ||||
| 2025-08-01 | 13F | Bessemer Group Inc | 10 005 | 0,00 | 0 | |||||
| 2025-08-15 | 13F | CI Private Wealth, LLC | 48 503 | −42,93 | 2 395 | −36,13 | ||||
| 2025-04-23 | 13F | GHP Investment Advisors, Inc. | 0 | −100,00 | 0 | |||||
| 2025-08-14 | 13F | Citadel Advisors Llc | Call | 0 | −100,00 | 0 | ||||
| 2025-08-27 | 13F/A | Squarepoint Ops LLC | 10 809 | 534 | ||||||
| 2025-08-13 | 13F | Cerity Partners LLC | 26 786 | −1,84 | 1 322 | 9,89 | ||||
| 2025-08-05 | 13F | Tsfg, Llc | 31 | 0,00 | 0 | |||||
| 2025-07-24 | 13F | Robertson Stephens Wealth Management, LLC | 26 403 | 2,20 | 1 304 | 14,40 | ||||
| 2025-08-14 | 13F | Becker Capital Management Inc | 8 554 | 0,00 | 422 | 11,94 | ||||
| 2025-08-14 | 13F | Comerica Bank | 8 797 | −0,49 | 434 | 11,57 | ||||
| 2025-08-11 | 13F | TD Waterhouse Canada Inc. | 5 528 | 273 | ||||||
| 2025-08-12 | 13F | CIBC Private Wealth Group, LLC | 500 | 0,00 | 25 | 26,32 | ||||
| 2025-07-31 | 13F/A | Avion Wealth | 27 | 0,00 | 0 | |||||
| 2025-08-01 | 13F | Providence First Trust Co | 46 582 | −2,87 | 2 300 | 8,75 | ||||
| 2025-08-12 | 13F | Jpmorgan Chase & Co | 8 109 223 | −3,15 | 400 352 | 8,42 | ||||
| 2025-07-17 | 13F | Peoples Financial Services Corp. | 50 | 0,00 | 2 | 0,00 | ||||
| 2025-04-21 | 13F | Nelson, Van Denburg & Campbell Wealth Management Group, LLC | 0 | −100,00 | 0 | |||||
| 2025-08-08 | 13F | Pnc Financial Services Group, Inc. | 189 884 | −1,57 | 9 375 | 10,19 | ||||
| 2025-08-11 | 13F | Principal Securities, Inc. | 50 | 56,25 | 2 | 100,00 | ||||
| 2025-08-14 | 13F | Two Sigma Securities, Llc | 8 403 | 415 | ||||||
| 2025-05-15 | 13F | National Wealth Management Group, LLC | 0 | −100,00 | 0 | |||||
| 2025-08-14 | 13F | Bank Of America Corp /de/ | 3 131 894 | 29,72 | 154 622 | 45,22 | ||||
| 2025-07-25 | 13F | Johnson Investment Counsel Inc | 5 335 | 0,00 | 263 | 11,91 | ||||
| 2025-08-13 | 13F | Johnson Financial Group, Inc. | 21 | 1 | ||||||
| 2025-08-11 | 13F | Citigroup Inc | 167 455 | 20,71 | 8 267 | 35,15 | ||||
| 2025-07-31 | 13F | Money Design Co.,Ltd. | 0 | −100,00 | 0 | −100,00 | ||||
| 2025-08-13 | 13F | Amundi | 189 625 | 0,53 | 9 409 | 13,94 | ||||
| 2025-07-17 | 13F | Sound Income Strategies, LLC | 10 | −94,19 | 0 | −100,00 | ||||
| 2025-05-13 | 13F | Quadrature Capital Ltd | 0 | −100,00 | 0 | −100,00 | ||||
| 2025-08-26 | 13F/A | Thrivent Financial For Lutherans | 0 | −100,00 | 0 | −100,00 | ||||
| 2025-07-16 | 13F | Tru Independence Asset Management 2, Llc | 18 211 | 17,71 | 899 | 31,82 | ||||
| 2025-08-19 | 13F | Anchor Investment Management, LLC | 189 | 0,00 | 9 | 12,50 | ||||
| 2025-08-28 | NP | Northern Lights Fund Trust - Sierra Tactical Core Growth Fund Investor Class Shares | 8 265 | 408 | ||||||
| 2025-07-22 | 13F | Checchi Capital Advisers, LLC | 139 616 | 74,14 | 6 893 | 94,96 | ||||
| 2025-07-31 | 13F | Lee Danner & Bass Inc | 20 525 | 0,00 | 1 013 | 11,93 | ||||
| 2025-08-14 | 13F | Transamerica Financial Advisors, Inc. | 1 483 | −7,72 | 73 | |||||
| 2025-04-21 | 13F | Roman Butler Fullerton & Co | 0 | −100,00 | 0 | |||||
| 2025-04-23 | 13F | Professional Financial Advisors, LLC | 0 | −100,00 | 0 | |||||
| 2025-08-13 | 13F | Rsm Us Wealth Management Llc | 4 328 | 214 | ||||||
| 2025-08-14 | 13F | CoreCap Advisors, LLC | 0 | −100,00 | 0 | |||||
| 2025-08-28 | NP | Northern Lights Fund Trust - Sierra Tactical Risk Spectrum 50 Fund Investor Class | 138 600 | 6 843 | ||||||
| 2025-08-05 | 13F | Cherry Tree Wealth Management, LLC | 2 993 | 0,00 | 148 | 12,21 | ||||
| 2025-08-14 | 13F | Headlands Technologies LLC | 0 | −100,00 | 0 | −100,00 | ||||
| 2025-04-09 | 13F | Milestone Asset Management, Llc | 0 | −100,00 | 0 | |||||
| 2025-08-08 | 13F | Family Firm, Inc. | 0 | −100,00 | 0 | |||||
| 2025-08-07 | 13F | CENTRAL TRUST Co | 1 620 | 0,00 | 80 | 11,27 | ||||
| 2025-07-14 | 13F | Acropolis Investment Management, LLC | 0 | −100,00 | 0 | |||||
| 2025-08-01 | 13F | Envestnet Asset Management Inc | 70 037 | −3,12 | 3 458 | 8,47 | ||||
| 2025-08-15 | 13F | Tower Research Capital LLC (TRC) | 1 161 | 23 120,00 | 57 | |||||
| 2025-07-31 | 13F | Sharper & Granite LLC | 43 783 | 4,24 | 2 173 | 17,28 | ||||
| 2025-08-06 | 13F | First Horizon Advisors, Inc. | 9 285 | 0,00 | 458 | 11,98 | ||||
| 2025-07-10 | 13F | Global Financial Private Client, LLC | 0 | −100,00 | 0 | |||||
| 2025-07-15 | 13F | BigSur Wealth Management LLC | 1 730 | 0,00 | 85 | 11,84 | ||||
| 2025-08-06 | 13F | Savant Capital, LLC | 8 084 | 0,30 | 399 | 12,39 | ||||
| 2025-08-14 | 13F | Daiwa Securities Group Inc. | 15 660 | −10,15 | 1 | |||||
| 2025-08-08 | 13F | Fortis Group Advisors, LLC | 10 | 0,00 | 0 | |||||
| 2025-07-18 | 13F | SOA Wealth Advisors, LLC. | 493 | 1,86 | 24 | 14,29 | ||||
| 2025-08-07 | 13F | Montag A & Associates Inc | 6 900 | 0,00 | 341 | 11,84 | ||||
| 2025-07-16 | 13F | Signaturefd, Llc | 0 | −100,00 | 0 | −100,00 | ||||
| 2025-08-08 | 13F | Itau Unibanco Holding S.A. | 4 000 | −55,80 | 197 | |||||
| 2025-08-13 | 13F | Hsbc Holdings Plc | 86 496 | −0,05 | 4 270 | 11,90 | ||||
| 2025-08-12 | 13F | BlackRock, Inc. | 1 876 034 | −1,68 | 92 620 | 10,07 | ||||
| 2025-08-13 | 13F | EverSource Wealth Advisors, LLC | 6 | 0,00 | 0 | |||||
| 2025-07-18 | 13F | Truist Financial Corp | 39 527 | 1,68 | 1 951 | 13,83 | ||||
| 2025-08-14 | 13F | Kovitz Investment Group Partners, LLC | 55 581 | 2 744 | ||||||
| 2025-04-11 | 13F | Davis Capital Management | 90 | 0,00 | 4 | 0,00 | ||||
| 2025-08-12 | 13F | Coldstream Capital Management Inc | 0 | −100,00 | 0 | |||||
| 2025-08-13 | 13F | Jones Financial Companies Lllp | 90 | −71,43 | 4 | −69,23 | ||||
| 2025-07-11 | 13F | Farther Finance Advisors, LLC | 4 520 | −2,16 | 223 | 8,25 | ||||
| 2025-08-14 | 13F | Old Mission Capital Llc | 0 | −100,00 | 0 | |||||
| 2025-07-08 | 13F | Next Level Private LLC | 13 933 | −0,02 | 688 | 11,89 | ||||
| 2025-08-11 | 13F | Private Advisor Group, LLC | 4 741 | −8,49 | 234 | 2,63 | ||||
| 2025-07-25 | 13F | Hazlett, Burt & Watson, Inc. | 300 | 0,00 | 0 | |||||
| 2025-07-30 | 13F | Phillips Financial Management, Llc | 4 138 | 0,00 | 204 | 12,09 | ||||
| 2025-08-08 | 13F | Capital Investment Advisory Services, LLC | 63 | 0,00 | 3 | 50,00 | ||||
| 2025-08-13 | 13F | Invesco Ltd. | 14 755 | −8,11 | 728 | 2,82 | ||||
| 2025-07-07 | 13F | Investors Research Corp | 124 | 0,00 | 6 | 20,00 | ||||
| 2025-05-06 | 13F | Venturi Wealth Management, LLC | 0 | −100,00 | 0 | |||||
| 2025-07-14 | 13F | Park Avenue Securities Llc | 0 | −100,00 | 0 | |||||
| 2025-08-06 | 13F | Commonwealth Equity Services, Llc | 45 529 | −8,08 | 2 | 0,00 | ||||
| 2025-04-28 | 13F | Mutual Advisors, LLC | 0 | −100,00 | 0 | |||||
| 2025-07-24 | NP | PLUSX - DWS Multi-Asset Moderate Allocation Fund Class A | 6 529 | 15,89 | 315 | 25,00 | ||||
| 2025-08-14 | 13F | Goldman Sachs Group Inc | 6 955 810 | −32,53 | 343 408 | −24,46 | ||||
| 2025-07-29 | 13F | Activest Wealth Management | 11 | 0,00 | 1 | |||||
| 2025-08-14 | 13F | Glen Eagle Advisors, LLC | 10 | 0,00 | 0 | |||||
| 2025-04-28 | 13F | Resonant Capital Advisors, LLC | 0 | −100,00 | 0 | |||||
| 2025-07-23 | 13F | Vontobel Holding Ltd. | 5 250 | −5,23 | 259 | 6,15 | ||||
| 2025-08-13 | 13F | Vega Investment Solutions | 12 362 | 0,00 | 610 | 11,72 | ||||
| 2025-08-14 | 13F | Mml Investors Services, Llc | 48 294 | 0,81 | 2 | 0,00 | ||||
| 2025-07-14 | 13F | AdvisorNet Financial, Inc | 88 | 0,00 | 4 | 33,33 | ||||
| 2025-08-08 | 13F | Creative Planning | 16 101 | −13,17 | 795 | −2,82 | ||||
| 2025-08-12 | 13F | TCTC Holdings, LLC | 18 200 | 0,00 | 899 | 11,97 | ||||
| 2025-08-06 | 13F | AE Wealth Management LLC | 120 | 0,00 | 6 | 0,00 | ||||
| 2025-08-12 | 13F | Global Retirement Partners, LLC | 6 323 | 34,53 | 312 | 52,20 | ||||
| 2025-05-14 | 13F | Truvestments Capital Llc | 0 | −100,00 | 0 | |||||
| 2025-07-31 | 13F | CVA Family Office, LLC | 3 916 | 0,00 | 193 | 12,21 | ||||
| 2025-08-14 | 13F | Citadel Advisors Llc | Put | 0 | −100,00 | 0 | ||||
| 2025-08-11 | 13F | Hexagon Capital Partners LLC | 0 | −100,00 | 0 | |||||
| 2025-07-30 | 13F | Whittier Trust Co | 75 | 0,00 | 4 | 0,00 | ||||
| 2025-08-12 | 13F | Steward Partners Investment Advisory, Llc | 2 390 | −87,02 | 118 | −85,57 | ||||
| 2025-08-13 | 13F | Schroder Investment Management Group | 1 400 | 0,00 | 69 | 13,11 | ||||
| 2025-07-30 | 13F | Whittier Trust Co Of Nevada Inc | 4 275 | 66,67 | 211 | 86,73 | ||||
| 2025-08-01 | 13F | Banco Santander, S.A. | 160 399 | 54,59 | 7 919 | 73,07 | ||||
| 2025-08-14 | 13F | Royal Bank Of Canada | 203 991 | 87,01 | 10 072 | 109,40 | ||||
| 2025-08-14 | 13F | Partners Capital Investment Group, Llp | 138 569 | −48,12 | 6 841 | −41,91 | ||||
| 2025-07-15 | 13F | Fifth Third Bancorp | 550 | 0,00 | 27 | 12,50 | ||||
| 2025-08-13 | 13F | Cresset Asset Management, LLC | 0 | −100,00 | 0 | |||||
| 2025-08-14 | 13F | McIlrath & Eck, LLC | 0 | −100,00 | 0 | |||||
| 2025-07-22 | 13F | Highland Capital Management, Llc | 11 468 | 0,00 | 566 | 12,08 | ||||
| 2025-08-14 | 13F | Glenmede Investment Management, LP | 600 | 30 | ||||||
| 2025-07-24 | NP | SPDAX - DWS Multi-Asset Conservative Allocation Fund Class A | 9 818 | 0,00 | 474 | 7,74 | ||||
| 2025-08-14 | 13F | FIL Ltd | 25 983 | −39,45 | 1 283 | −32,24 | ||||
| 2025-07-11 | 13F | Afg Fiduciary Services Limited Partnership | 18 798 | 0,00 | 927 | 17,19 | ||||
| 2025-08-13 | 13F | Metlife Inc | 8 803 | −1,96 | 435 | 9,60 | ||||
| 2025-07-14 | 13F | GAMMA Investing LLC | 80 | 4 | ||||||
| 2025-08-08 | 13F | Abc Arbitrage Sa | 15 541 | 24,23 | 767 | 39,20 | ||||
| 2025-08-14 | 13F | Jane Street Group, Llc | 53 267 | −73,92 | 2 630 | −70,81 | ||||
| 2025-08-14 | 13F | UBS Group AG | 525 598 | 17,38 | 25 949 | 31,41 | ||||
| 2025-07-15 | 13F | Compagnie Lombard Odier SCmA | 6 150 | 0,00 | 304 | 11,81 | ||||
| 2025-07-09 | 13F | Breakwater Investment Management | 1 005 | 0,00 | 50 | 11,36 | ||||
| 2025-07-31 | 13F | GenTrust, LLC | 4 490 | −10,20 | 222 | 0,45 | ||||
| 2025-08-05 | 13F | Simplex Trading, Llc | 0 | −100,00 | 0 | |||||
| 2025-08-12 | 13F | Deutsche Bank Ag\ | 361 374 | −25,12 | 17 841 | −16,17 | ||||
| 2025-08-15 | 13F | Morgan Stanley | 1 266 672 | −26,40 | 62 536 | −17,60 | ||||
| 2025-05-15 | 13F | Glenmede Trust Co Na | 600 | 0,00 | 26 | 0,00 | ||||
| 2025-08-13 | 13F | Colonial Trust Advisors | 300 | 0,00 | 15 | 7,69 | ||||
| 2025-08-14 | 13F | Qube Research & Technologies Ltd | 32 505 | 419,83 | 1 605 | 483,27 | ||||
| 2025-08-07 | 13F | Allworth Financial LP | 220 | 340,00 | 11 | 400,00 | ||||
| 2025-08-05 | 13F | Bank Of Montreal /can/ | 4 555 | 9,52 | 225 | 22,40 | ||||
| 2025-08-11 | 13F | Brown Brothers Harriman & Co | 15 | 0,00 | 1 | |||||
| 2025-08-05 | 13F | Bank of New York Mellon Corp | 28 582 | 0,00 | 1 411 | 11,98 | ||||
| 2025-05-15 | 13F | Manufacturers Life Insurance Company, The | 0 | −100,00 | 0 | |||||
| 2025-08-14 | 13F | Engineers Gate Manager LP | 0 | −100,00 | 0 | |||||
| 2025-08-08 | 13F | Mv Capital Management, Inc. | 420 | 43,34 | 21 | 66,67 | ||||
| 2025-08-12 | 13F | Proequities, Inc. | 0 | 0 | ||||||
| 2025-08-13 | 13F | Green Harvest Asset Management LLC | 7 373 | −1,23 | 364 | 10,64 | ||||
| 2025-07-31 | 13F | Cambridge Investment Research Advisors, Inc. | 10 246 | −71,98 | 1 | −100,00 | ||||
| 2025-07-25 | 13F | Sequoia Financial Advisors, LLC | 5 355 | −8,70 | 264 | 2,33 | ||||
| 2025-08-14 | 13F | Wells Fargo & Company/mn | 134 878 | 0,92 | 6 659 | 12,98 | ||||
| 2025-07-18 | 13F | USA Financial Portformulas Corp | 3 061 | −35,30 | 151 | −27,40 | ||||
| 2025-05-14 | 13F | Oarsman Capital, Inc. | 0 | −100,00 | 0 |