Grundläggande statistik
| Institutionella ägare | 81 total, 81 long only, 0 short only, 0 long/short - change of 2,53% MRQ |
| Genomsnittlig portföljallokering | 0.8724 % - change of −0,29% MRQ |
| Institutionella aktier (lång) | 5 845 109 (ex 13D/G) - change of −0,39MM shares −6,32% MRQ |
| Institutionellt värde (lång) | $ 138 156 USD ($1000) |
Institutionellt ägande och aktieägare
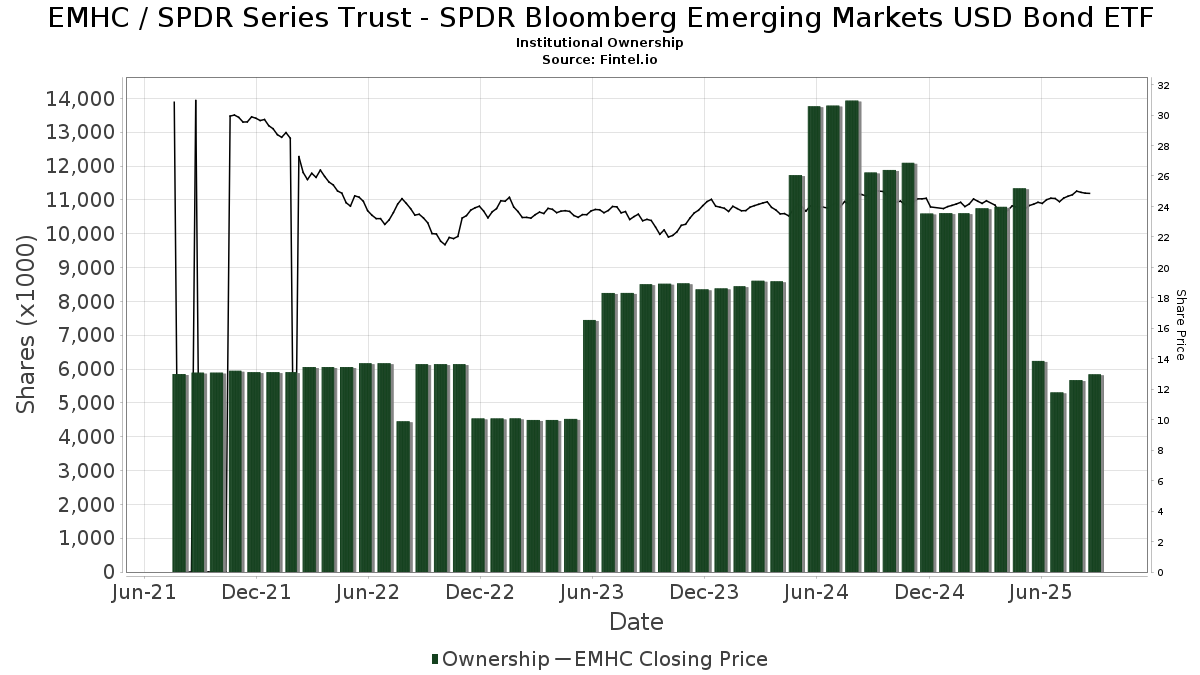
SPDR Series Trust - SPDR Bloomberg Emerging Markets USD Bond ETF (US:EMHC) har 81 Institutionella ägare och aktieägare som har lämnat in 13D/G- eller 13F-formulär till Securities Exchange Commission (SEC). Dessa institut innehar totalt 5,845,109 aktier. Största aktieägare inkluderar LPL Financial LLC, Assetmark, Inc, Envestnet Asset Management Inc, Envestnet Portfolio Solutions, Inc., Advisor Group Holdings, Inc., GAL - SPDR SSGA Global Allocation ETF, Austin Private Wealth, LLC, INKM - SPDR SSGA Income Allocation ETF, Aspire Private Capital, LLC, and GWM Advisors LLC .
SPDR Series Trust - SPDR Bloomberg Emerging Markets USD Bond ETF (ARCA:EMHC) Institutionell ägarstruktur visar institutioners och fonders nuvarande positioner i företaget, samt de senaste förändringarna i positionernas storlek. Större aktieägare kan vara enskilda investerare, fonder, hedgefonder eller institutioner. Bilaga 13D visar att investeraren äger (eller ägde) mer än 5% av företaget och avser (eller avsåg) att aktivt eftersträva en förändring av affärsstrategin. Schedule 13G indikerar en passiv investering på över 5%.
The share price as of September 8, 2025 is 25,07 / share. Previously, on September 9, 2024, the share price was 24,77 / share. This represents an increase of 1,21% over that period.
Fondsentimentets poäng
Fondsentimentet poängen(fka Ägarackumulation-poäng) visar vilka aktier som är mest köpta av fonder. Det är resultatet av en sofistikerad kvantitativ flerfaktormodell som identifierar företag med de högsta nivåerna av institutionell ackumulering. Poängsättningsmodellen använder en kombination av den totala ökningen av redovisade ägare, förändringarna i portföljallokeringarna för dessa ägare och andra mått. Siffran sträcker sig från 0 till 100, där högre siffror indikerar en högre nivå av ackumulering i förhållande till sina konkurrenter, och 50 är genomsnittet.
Uppdateringsfrekvens: Dagligen
Se Ownership Explorer, som innehåller en lista över de högst rankade företagen.
Institutionell sälj/köp-kvot
Förutom att rapportera vanliga eget kapital- och skuldemissioner måste institutioner med mer än 100MM tillgångar under förvaltning också avslöja sina innehav av sälj- och köpoptioner. Eftersom säljoptioner i allmänhet indikerar ett negativt sentiment och köpoptioner indikerar ett positivt sentiment, kan vi få en uppfattning om det övergripande institutionella sentimentet genom att plotta förhållandet mellan säljoptioner och köpoptioner. Diagrammet till höger visar det historiska förhållandet mellan sälj- och köpoptioner för detta instrument.
Genom att använda sälj/köp-kvoten som en indikator på aktieägarnas sentiment undviker man en av de största bristerna med att använda det totala institutionella ägandet, nämligen att en betydande del av de förvaltade tillgångarna investeras passivt för att följa index. Passivt förvaltade fonder köper vanligtvis inte optioner, så indikatorn för sälj/köp-kvoten ger en bättre bild av stämningen i aktivt förvaltade fonder.
13F- och NPORT-arkiveringar
Detaljer om 13F-arkiveringar är gratis. Detaljer om NP-arkiveringar kräver ett premiummedlemskap. Gröna rader indikerar nya positioner. Röda rader indikerar stängda positioner. Klicka på länk symbolen för att se hela transaktionshistoriken.
Uppgradera
för att låsa upp premiumdata och exportera till Excel ![]() .
.
| Fil Datum | Källa | Investerare | Typ | Genomsnittligt pris (beräknat) |
Aktier | Δ Aktier (%) |
Rapporterat värde (1000 USD) |
Δ Värde (%) |
Portföljallokering (%) |
|
|---|---|---|---|---|---|---|---|---|---|---|
| 2025-08-04 | 13F | AlphaStar Capital Management, LLC | 9 799 | −4,39 | 241 | −2,43 | ||||
| 2025-08-14 | 13F | Fmr Llc | 0 | −100,00 | 0 | |||||
| 2025-07-17 | 13F | Raleigh Capital Management Inc. | 80 826 | 6,52 | 1 989 | 8,51 | ||||
| 2025-07-25 | 13F | Cwm, Llc | 971 | −2,12 | 0 | |||||
| 2025-08-12 | 13F | Proequities, Inc. | 0 | 0 | ||||||
| 2025-08-14 | 13F | Old Mission Capital Llc | 59 923 | 462,71 | 1 475 | 473,54 | ||||
| 2025-08-15 | 13F | Fsb Premier Wealth Management, Inc. | 26 532 | −0,31 | 653 | 1,40 | ||||
| 2025-07-21 | 13F | Ascent Group, LLC | 13 134 | −1,49 | 323 | 0,31 | ||||
| 2025-07-25 | 13F | Atria Wealth Solutions, Inc. | 0 | −100,00 | 0 | |||||
| 2025-07-28 | 13F | Axxcess Wealth Management, Llc | 38 357 | 2,17 | 944 | 3,97 | ||||
| 2025-07-29 | 13F | Balboa Wealth Partners | 17 633 | 3,86 | 434 | 5,61 | ||||
| 2025-08-14 | 13F | Royal Bank Of Canada | 227 | 122,55 | 6 | 200,00 | ||||
| 2025-08-14 | 13F | Novus Advisors, Llc | 30 935 | −1,10 | 761 | 0,79 | ||||
| 2025-08-01 | 13F | Austin Private Wealth, LLC | 284 263 | 64,42 | 6 996 | 67,46 | ||||
| 2025-08-13 | 13F | GeoWealth Management, LLC | 8 977 | −3,81 | 221 | −2,22 | ||||
| 2025-07-25 | 13F | Richardson Financial Services Inc. | 13 065 | −10,98 | 321 | −9,60 | ||||
| 2025-08-12 | 13F | Richard W. Paul & Associates, LLC | 3 211 | 0,97 | 79 | 3,95 | ||||
| 2025-06-26 | NP | AAEZX - Enhanced Fixed Income Fund | 1 970 | −99,79 | 47 | −99,79 | ||||
| 2025-08-05 | 13F | Lifeworks Advisors, LLC | 8 703 | −0,59 | 214 | 1,42 | ||||
| 2025-07-10 | 13F | Sharkey, Howes & Javer | 96 217 | −5,58 | 2 368 | −3,86 | ||||
| 2025-07-29 | 13F | Private Trust Co Na | 379 | 0,53 | 9 | 0,00 | ||||
| 2025-07-31 | 13F | Cambridge Investment Research Advisors, Inc. | 104 353 | 6,67 | 3 | 0,00 | ||||
| 2025-07-11 | 13F | International Private Wealth Advisors LLC | 17 663 | 9,85 | 435 | 11,86 | ||||
| 2025-07-22 | 13F | Merit Financial Group, LLC | 33 611 | 238,24 | 827 | 244,58 | ||||
| 2025-07-25 | 13F | Envestnet Portfolio Solutions, Inc. | 456 825 | 17,28 | 11 242 | 19,46 | ||||
| 2025-07-28 | 13F | RFG Advisory, LLC | 36 787 | −1,27 | 905 | 0,56 | ||||
| 2025-08-14 | 13F | Raymond James Financial Inc | 473 | 12 | ||||||
| 2025-08-13 | 13F | Schroder Investment Management Group | 31 642 | 6,51 | 779 | 8,66 | ||||
| 2025-07-14 | 13F | Iams Wealth Management, Llc | 10 285 | 12,77 | 253 | 15,00 | ||||
| 2025-08-12 | 13F | Global Retirement Partners, LLC | 563 | 122,53 | 14 | 116,67 | ||||
| 2025-08-08 | 13F | Hibernia Wealth Partners, LLC | 106 150 | 98,59 | 2 613 | 102,32 | ||||
| 2025-07-24 | 13F | IFP Advisors, Inc | 123 | 0,00 | 3 | 50,00 | ||||
| 2025-08-04 | 13F | Assetmark, Inc | 543 562 | 2,20 | 13 377 | 4,10 | ||||
| 2025-05-14 | 13F | Northwestern Mutual Wealth Management Co | 0 | −100,00 | 0 | |||||
| 2025-05-07 | 13F | Municipal Employees' Retirement System of Michigan | 0 | −100,00 | 0 | |||||
| 2025-07-28 | 13F | Harbour Investments, Inc. | 30 488 | 12,24 | 750 | 14,33 | ||||
| 2025-08-14 | 13F | UBS Group AG | 231 | 148,39 | 6 | 150,00 | ||||
| 2025-05-15 | 13F/A | Orion Portfolio Solutions, LLC | 20 628 | 94,68 | 498 | 98,41 | ||||
| 2025-05-01 | 13F | Quest 10 Wealth Builders, Inc. | 0 | −100,00 | 0 | |||||
| 2025-08-28 | NP | INKM - SPDR SSGA Income Allocation ETF This fund is a listed as child fund of State Street Corp and if that institution has disclosed ownership in this security, then these positions will not be double counted when calculating total shares and total value | 251 965 | −6,25 | 6 201 | −4,51 | ||||
| 2025-08-07 | 13F | Allworth Financial LP | 520 | −58,27 | 13 | −58,62 | ||||
| 2025-08-05 | 13F | Landmark Wealth Management, Inc. | 90 893 | 8,76 | 2 237 | 10,75 | ||||
| 2025-07-15 | 13F | FLP Wealth Management, LLC | 0 | −100,00 | 0 | |||||
| 2025-08-11 | 13F | Covestor Ltd | 24 | 4,35 | 0 | |||||
| 2025-08-11 | 13F | HighTower Advisors, LLC | 56 307 | 12,96 | 1 386 | 15,03 | ||||
| 2025-08-14 | 13F | Bank Of America Corp /de/ | 3 317 | 47,16 | 82 | 50,00 | ||||
| 2025-08-14 | 13F | Smartleaf Asset Management LLC | 3 616 | 10,75 | 88 | 12,82 | ||||
| 2025-09-04 | 13F/A | Advisor Group Holdings, Inc. | 408 095 | 33,70 | 10 006 | 35,68 | ||||
| 2025-08-11 | 13F | Outlook Wealth Advisors, LLC | 10 787 | 4,66 | 265 | 6,43 | ||||
| 2025-08-11 | 13F | Strategic Wealth Partners, Ltd. | 27 | 1 | ||||||
| 2025-08-28 | NP | GAL - SPDR SSGA Global Allocation ETF This fund is a listed as child fund of State Street Corp and if that institution has disclosed ownership in this security, then these positions will not be double counted when calculating total shares and total value | 316 524 | 4,96 | 7 790 | 6,90 | ||||
| 2025-07-11 | 13F | Farther Finance Advisors, LLC | 568 | −80,61 | 14 | −81,43 | ||||
| 2025-08-11 | 13F | Aptus Capital Advisors, LLC | 258 | 0,00 | 6 | 0,00 | ||||
| 2025-07-09 | 13F | VisionPoint Advisory Group, LLC | 11 668 | 287 | ||||||
| 2025-08-14 | 13F | Comerica Bank | 295 | 4,98 | 7 | 16,67 | ||||
| 2025-08-13 | 13F | Flow Traders U.s. Llc | 10 017 | 0,00 | 0 | |||||
| 2025-08-27 | 13F/A | Brinker Capital Investments, LLC | 31 604 | 53,21 | 778 | 56,02 | ||||
| 2025-08-29 | 13F | Evolution Wealth Management Inc. | 39 | 1 | ||||||
| 2025-08-12 | 13F | Jpmorgan Chase & Co | 12 253 | 302 | ||||||
| 2025-08-08 | 13F | Cetera Investment Advisers | 61 173 | −23,35 | 1 505 | −21,94 | ||||
| 2025-08-15 | 13F | Morgan Stanley | 97 | 9 600,00 | 2 | |||||
| 2025-07-10 | 13F | Global Financial Private Client, LLC | 0 | −100,00 | 0 | |||||
| 2025-07-18 | 13F | Lockerman Financial Group, Inc. | 17 108 | 8,43 | 421 | 10,50 | ||||
| 2025-08-12 | 13F | O'shaughnessy Asset Management, Llc | 1 | −75,00 | 0 | |||||
| 2025-07-10 | 13F | Signal Advisors Wealth, LLC | 52 207 | 58,56 | 1 285 | 61,51 | ||||
| 2025-07-23 | 13F | REAP Financial Group, LLC | 92 | 0,00 | 2 | 0,00 | ||||
| 2025-08-12 | 13F | LPL Financial LLC | 1 171 919 | 4,75 | 28 841 | 6,69 | ||||
| 2025-04-22 | 13F | Castleview Partners, Llc | 0 | −100,00 | 0 | |||||
| 2025-08-11 | 13F | Principal Securities, Inc. | 4 076 | 58,60 | 100 | 63,93 | ||||
| 2025-08-06 | 13F | Cannon Financial Strategists, Inc. | 9 828 | 0,75 | 242 | 2,55 | ||||
| 2025-08-06 | 13F | AE Wealth Management LLC | 36 959 | −1,51 | 910 | 0,33 | ||||
| 2025-04-23 | 13F | Mascagni Wealth Management, Inc. | 0 | −100,00 | 0 | −100,00 | ||||
| 2025-07-31 | 13F | Hobart Private Capital, LLC | 76 234 | 13,61 | 1 876 | 15,73 | ||||
| 2025-08-12 | 13F | Wayfinding Financial, LLC | 0 | −100,00 | 0 | |||||
| 2025-08-14 | 13F | Jane Street Group, Llc | 24 920 | −72,50 | 613 | −72,00 | ||||
| 2025-08-14 | 13F | Wells Fargo & Company/mn | 409 | 359,55 | 10 | 400,00 | ||||
| 2025-08-04 | 13F | Family Wealth Group, LLC | 8 760 | 216 | ||||||
| 2025-08-01 | 13F | Rossby Financial, LCC | 61 | 0,00 | 2 | 0,00 | ||||
| 2025-07-22 | 13F | Simplicity Wealth,LLC | 70 122 | 435,90 | 1 726 | 445,89 | ||||
| 2025-07-22 | 13F | Aspire Private Capital, LLC | 213 033 | 2,43 | 5 243 | 4,32 | ||||
| 2025-07-17 | 13F | KWB Wealth | 8 974 | 217 | ||||||
| 2025-08-01 | 13F | Envestnet Asset Management Inc | 477 870 | 12,11 | 11 760 | 14,19 | ||||
| 2025-07-25 | 13F | McNamara Financial Services, Inc. | 39 307 | 26,11 | 967 | 28,42 | ||||
| 2025-08-14 | 13F | Susquehanna International Group, Llp | 0 | −100,00 | 0 | |||||
| 2025-08-12 | 13F | Change Path, LLC | 23 334 | 13,29 | 574 | 15,49 | ||||
| 2025-07-14 | 13F | AdvisorNet Financial, Inc | 729 | 0,00 | 18 | 0,00 | ||||
| 2025-04-23 | 13F | Walkner Condon Financial Advisors LLC | 0 | −100,00 | 0 | |||||
| 2025-08-06 | 13F | Adviser Investments LLC | 10 250 | −26,13 | 252 | −24,78 | ||||
| 2025-05-09 | 13F | CoreCap Advisors, LLC | 0 | −100,00 | 0 | |||||
| 2025-05-12 | 13F | Aveo Capital Partners, LLC | 0 | −100,00 | 0 | |||||
| 2025-08-14 | 13F | GWM Advisors LLC | 114 784 | 5,11 | 2 825 | 7,05 | ||||
| 2025-08-13 | 13F | Transce3nd, LLC | 1 833 | 24,95 | 45 | 28,57 | ||||
| 2025-08-13 | 13F | Safe Harbor Fiduciary, LLC | 227 | 1,34 | 6 | 0,00 | ||||
| 2025-07-14 | 13F | Park Avenue Securities Llc | 112 398 | 1,38 | 3 | 0,00 | ||||
| 2025-08-04 | 13F | Creative Financial Designs Inc /adv | 11 101 | 75,07 | 273 | 78,43 | ||||
| 2025-05-02 | 13F | Capital A Wealth Management, LLC | 20 | −62,26 | 0 | −100,00 |