Grundläggande statistik
| Institutionella ägare | 125 total, 125 long only, 0 short only, 0 long/short - change of 1,63% MRQ |
| Genomsnittlig portföljallokering | 0.0072 % - change of −50,62% MRQ |
| Institutionella aktier (lång) | 2 578 654 (ex 13D/G) - change of 0,01MM shares 0,24% MRQ |
| Institutionellt värde (lång) | $ 55 324 USD ($1000) |
Institutionellt ägande och aktieägare
Global X Funds - Global X Autonomous & Electric Vehicles ETF (US:DRIV) har 125 Institutionella ägare och aktieägare som har lämnat in 13D/G- eller 13F-formulär till Securities Exchange Commission (SEC). Dessa institut innehar totalt 2,578,654 aktier. Största aktieägare inkluderar Bank Of America Corp /de/, LPL Financial LLC, Jane Street Group, Llc, Hancock Prospecting Pty Ltd, Envestnet Asset Management Inc, Northwestern Mutual Wealth Management Co, Flow Traders U.s. Llc, Advisor Group Holdings, Inc., Cetera Investment Advisers, and Raymond James Financial Inc .
Global X Funds - Global X Autonomous & Electric Vehicles ETF (NasdaqGM:DRIV) Institutionell ägarstruktur visar institutioners och fonders nuvarande positioner i företaget, samt de senaste förändringarna i positionernas storlek. Större aktieägare kan vara enskilda investerare, fonder, hedgefonder eller institutioner. Bilaga 13D visar att investeraren äger (eller ägde) mer än 5% av företaget och avser (eller avsåg) att aktivt eftersträva en förändring av affärsstrategin. Schedule 13G indikerar en passiv investering på över 5%.
The share price as of September 10, 2025 is 25,88 / share. Previously, on September 10, 2024, the share price was 21,02 / share. This represents an increase of 23,14% over that period.

Fondsentimentets poäng
Fondsentimentet poängen(fka Ägarackumulation-poäng) visar vilka aktier som är mest köpta av fonder. Det är resultatet av en sofistikerad kvantitativ flerfaktormodell som identifierar företag med de högsta nivåerna av institutionell ackumulering. Poängsättningsmodellen använder en kombination av den totala ökningen av redovisade ägare, förändringarna i portföljallokeringarna för dessa ägare och andra mått. Siffran sträcker sig från 0 till 100, där högre siffror indikerar en högre nivå av ackumulering i förhållande till sina konkurrenter, och 50 är genomsnittet.
Uppdateringsfrekvens: Dagligen
Se Ownership Explorer, som innehåller en lista över de högst rankade företagen.
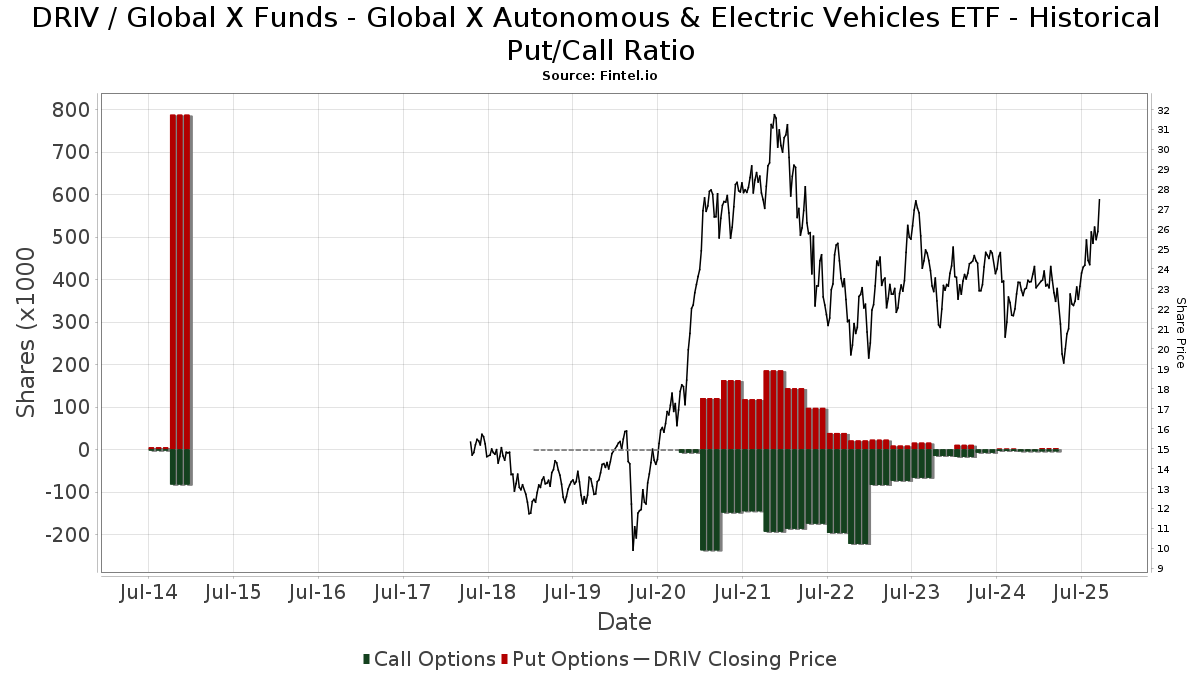
Institutionell sälj/köp-kvot
Förutom att rapportera vanliga eget kapital- och skuldemissioner måste institutioner med mer än 100MM tillgångar under förvaltning också avslöja sina innehav av sälj- och köpoptioner. Eftersom säljoptioner i allmänhet indikerar ett negativt sentiment och köpoptioner indikerar ett positivt sentiment, kan vi få en uppfattning om det övergripande institutionella sentimentet genom att plotta förhållandet mellan säljoptioner och köpoptioner. Diagrammet till höger visar det historiska förhållandet mellan sälj- och köpoptioner för detta instrument.
Genom att använda sälj/köp-kvoten som en indikator på aktieägarnas sentiment undviker man en av de största bristerna med att använda det totala institutionella ägandet, nämligen att en betydande del av de förvaltade tillgångarna investeras passivt för att följa index. Passivt förvaltade fonder köper vanligtvis inte optioner, så indikatorn för sälj/köp-kvoten ger en bättre bild av stämningen i aktivt förvaltade fonder.
13F- och NPORT-arkiveringar
Detaljer om 13F-arkiveringar är gratis. Detaljer om NP-arkiveringar kräver ett premiummedlemskap. Gröna rader indikerar nya positioner. Röda rader indikerar stängda positioner. Klicka på länk symbolen för att se hela transaktionshistoriken.
Uppgradera
för att låsa upp premiumdata och exportera till Excel ![]() .
.
| Fil Datum | Källa | Investerare | Typ | Genomsnittligt pris (beräknat) |
Aktier | Δ Aktier (%) |
Rapporterat värde (1000 USD) |
Δ Värde (%) |
Portföljallokering (%) |
|
|---|---|---|---|---|---|---|---|---|---|---|
| 2025-08-05 | 13F | GPS Wealth Strategies Group, LLC | 2 619 | −21,47 | 61 | −12,86 | ||||
| 2025-07-21 | 13F | Crews Bank & Trust | 1 750 | 0,00 | 41 | 11,11 | ||||
| 2025-08-12 | 13F | Jpmorgan Chase & Co | 362 | 0,00 | 8 | 14,29 | ||||
| 2025-08-14 | 13F | Citadel Advisors Llc | Put | 0 | −100,00 | 0 | ||||
| 2025-08-14 | 13F | Citadel Advisors Llc | 28 898 | −12,97 | 673 | −3,99 | ||||
| 2025-07-25 | 13F | Cwm, Llc | 9 334 | −2,47 | 0 | |||||
| 2025-07-15 | 13F | SJS Investment Consulting Inc. | 80 | 0,00 | 2 | 0,00 | ||||
| 2025-08-12 | 13F | Global Retirement Partners, LLC | 607 | −85,40 | 14 | −85,26 | ||||
| 2025-08-14 | 13F | D. E. Shaw & Co., Inc. | 21 037 | 0,00 | 490 | 10,36 | ||||
| 2025-08-08 | 13F | New England Capital Financial Advisors LLC | 19 | 0,00 | 0 | |||||
| 2025-07-31 | 13F | Brinker Capital Investments, LLC | 0 | −100,00 | 0 | −100,00 | ||||
| 2025-08-06 | 13F | Legacy Investment Solutions, LLC | 5 | 0,00 | 0 | |||||
| 2025-08-12 | 13F | Solano Wealth Investment Advisors LLC | 13 500 | −2,70 | 315 | 7,17 | ||||
| 2025-05-14 | 13F | Ameriprise Financial Inc | 0 | −100,00 | 0 | |||||
| 2025-07-23 | 13F | Hager Investment Management Services, Llc | 475 | −15,93 | 11 | 0,00 | ||||
| 2025-08-14 | 13F/A | Barclays Plc | 3 000 | 0,00 | 0 | |||||
| 2025-08-07 | 13F | Kestra Private Wealth Services, Llc | 9 985 | −3,34 | 233 | 6,42 | ||||
| 2025-08-14 | 13F | Qube Research & Technologies Ltd | 217 | 0,00 | 5 | 25,00 | ||||
| 2025-08-05 | 13F | Key FInancial Inc | 1 021 | 0,00 | 24 | 9,52 | ||||
| 2025-07-11 | 13F | First PREMIER Bank | 740 | 0,00 | 0 | |||||
| 2025-07-29 | 13F | Stratos Wealth Partners, LTD. | 10 602 | −16,85 | 247 | −8,18 | ||||
| 2025-07-10 | 13F | Atticus Wealth Management, Llc | 2 210 | 0,00 | 52 | 10,87 | ||||
| 2025-07-14 | 13F | Armstrong Advisory Group, Inc | 1 140 | −56,44 | 27 | −56,67 | ||||
| 2025-08-22 | 13F | Carter Financial Group, INC. | 0 | −100,00 | 0 | |||||
| 2025-08-13 | 13F | Summit Financial, LLC | 10 677 | −87,02 | 251 | −85,62 | ||||
| 2025-08-14 | 13F | Citadel Advisors Llc | Call | 0 | −100,00 | 0 | ||||
| 2025-08-06 | 13F | Legacy Wealth Managment, LLC/ID | 5 | 0,00 | 0 | |||||
| 2025-08-11 | 13F | Strategic Wealth Partners, Ltd. | 625 | 15 | ||||||
| 2025-08-14 | 13F | McIlrath & Eck, LLC | 41 | 0,00 | 1 | |||||
| 2025-07-22 | 13F | Powell Investment Advisors, LLC | 1 100 | 26 | ||||||
| 2025-07-16 | 13F/A | CX Institutional | 25 226 | −72,35 | 1 | −100,00 | ||||
| 2025-08-12 | 13F | Pathstone Holdings, LLC | 0 | −100,00 | 0 | |||||
| 2025-08-12 | 13F | SRS Capital Advisors, Inc. | 610 | 0,00 | 14 | 16,67 | ||||
| 2025-08-07 | 13F | Flagship Wealth Advisors, Llc | 174 | 0,00 | 4 | 33,33 | ||||
| 2025-07-21 | 13F | Ameriflex Group, Inc. | 500 | 0,00 | 12 | 10,00 | ||||
| 2025-07-21 | 13F | DHJJ Financial Advisors, Ltd. | 947 | 22 | ||||||
| 2025-07-31 | 13F | Oppenheimer & Co Inc | 9 075 | 211 | ||||||
| 2025-07-31 | 13F | Cambridge Investment Research Advisors, Inc. | 24 433 | −28,02 | 1 | |||||
| 2025-08-11 | 13F | Principal Securities, Inc. | 165 | 43,48 | 4 | 50,00 | ||||
| 2025-07-22 | 13F | Cedar Mountain Advisors, LLC | 79 | 0,00 | 2 | 0,00 | ||||
| 2025-07-29 | 13F | Stephens Inc /ar/ | 12 545 | 0,00 | 292 | 10,19 | ||||
| 2025-08-14 | 13F | Mml Investors Services, Llc | 23 398 | −5,65 | 1 | |||||
| 2025-04-28 | 13F | D.a. Davidson & Co. | 0 | −100,00 | 0 | |||||
| 2025-05-16 | 13F | Coppell Advisory Solutions LLC | 0 | −100,00 | 0 | |||||
| 2025-08-04 | 13F | Creekmur Asset Management LLC | 379 | 0,00 | 9 | 0,00 | ||||
| 2025-07-08 | 13F | Parallel Advisors, LLC | 1 250 | 2,46 | 29 | 16,00 | ||||
| 2025-08-11 | 13F | TD Waterhouse Canada Inc. | 7 600 | −0,05 | 177 | 10,63 | ||||
| 2025-08-12 | 13F | MAI Capital Management | 163 | −18,91 | 4 | −25,00 | ||||
| 2025-07-11 | 13F | Global X Japan Co., Ltd. | 3 934 | −2,72 | 92 | 7,06 | ||||
| 2025-04-22 | 13F | PFG Investments, LLC | 0 | −100,00 | 0 | |||||
| 2025-08-01 | 13F | First Command Advisory Services, Inc. | 1 000 | 0,00 | 23 | 9,52 | ||||
| 2025-08-08 | 13F | SBI Securities Co., Ltd. | 1 241 | −18,89 | 29 | −12,50 | ||||
| 2025-08-05 | 13F | Bank Of Montreal /can/ | 1 442 | −29,38 | 34 | −23,26 | ||||
| 2025-08-06 | 13F | Golden State Wealth Management, LLC | 591 | 0,00 | 14 | 8,33 | ||||
| 2025-07-10 | 13F | Wealth Enhancement Advisory Services, Llc | 14 373 | −17,29 | 346 | −5,99 | ||||
| 2025-08-14 | 13F | Ancora Advisors, LLC | 539 | 65,85 | 13 | 100,00 | ||||
| 2025-08-13 | 13F | Flow Traders U.s. Llc | 71 444 | 2 | ||||||
| 2025-08-12 | 13F | Proequities, Inc. | 0 | 0 | ||||||
| 2025-08-14 | 13F | Jane Street Group, Llc | 253 976 | 5 918 | ||||||
| 2025-07-21 | 13F | Ameritas Advisory Services, LLC | 72 | 2 | ||||||
| 2025-08-06 | 13F | Commonwealth Equity Services, Llc | 40 199 | −12,35 | 1 | |||||
| 2025-08-18 | 13F | Hollencrest Capital Management | 505 | 0,00 | 12 | 10,00 | ||||
| 2025-05-15 | 13F | Mariner, LLC | 0 | −100,00 | 0 | |||||
| 2025-05-15 | 13F | Prospera Financial Services Inc | 0 | −100,00 | 0 | |||||
| 2025-08-18 | 13F | Geneos Wealth Management Inc. | 143 | −86,87 | 3 | −86,96 | ||||
| 2025-04-01 | 13F | Modus Advisors, LLC | 0 | −100,00 | 0 | |||||
| 2025-07-02 | 13F | HBW Advisory Services LLC | 0 | −100,00 | 0 | |||||
| 2025-08-14 | 13F | Stifel Financial Corp | 28 269 | −13,07 | 659 | −4,22 | ||||
| 2025-07-16 | 13F | Signaturefd, Llc | 0 | −100,00 | 0 | |||||
| 2025-07-28 | 13F | CGC Financial Services, LLC | 173 | −12,63 | 4 | 0,00 | ||||
| 2025-08-08 | 13F | Creative Planning | 12 355 | 0,14 | 288 | 10,38 | ||||
| 2025-07-24 | 13F | Us Bancorp \de\ | 177 | 4 | ||||||
| 2025-08-14 | 13F | UBS Group AG | 34 739 | 105,98 | 809 | 127,25 | ||||
| 2025-07-11 | 13F | Adirondack Trust Co | 1 260 | 0,00 | 29 | 11,54 | ||||
| 2025-07-16 | 13F | Signature Resources Capital Management, LLC | 225 | 0,00 | 5 | 25,00 | ||||
| 2025-08-06 | 13F | AE Wealth Management LLC | 862 | 116,58 | 20 | 150,00 | ||||
| 2025-07-14 | 13F | Painted Porch Advisors LLC | 0 | −100,00 | 0 | −100,00 | ||||
| 2025-08-14 | 13F | Glenmede Investment Management, LP | 610 | 14 | ||||||
| 2025-07-18 | 13F | Trust Co Of Vermont | 5 | 0,00 | 0 | |||||
| 2025-08-14 | 13F | CoreCap Advisors, LLC | 0 | −100,00 | 0 | |||||
| 2025-05-15 | 13F | Hrt Financial Lp | 0 | −100,00 | 0 | |||||
| 2025-08-14 | 13F | Bank Of America Corp /de/ | 732 440 | −7,92 | 17 066 | 1,49 | ||||
| 2025-07-24 | 13F | IFP Advisors, Inc | 217 | 4,83 | 5 | 25,00 | ||||
| 2025-08-08 | 13F | Pnc Financial Services Group, Inc. | 11 647 | −21,06 | 271 | −12,86 | ||||
| 2025-08-08 | 13F | Cetera Investment Advisers | 56 043 | 0,54 | 1 306 | 10,78 | ||||
| 2025-08-12 | 13F | Stelac Advisory Services LLC | 7 782 | 0,00 | 183 | 10,98 | ||||
| 2025-07-30 | 13F | Advantage Trust Co | 1 880 | 44 | ||||||
| 2025-04-28 | 13F | Strategic Financial Concepts, LLC | 0 | −100,00 | 0 | −100,00 | ||||
| 2025-07-07 | 13F | General Partner, Inc. | 2 000 | 0,00 | 47 | 9,52 | ||||
| 2025-08-05 | 13F | Simplex Trading, Llc | 0 | −100,00 | 0 | |||||
| 2025-08-07 | 13F | Allworth Financial LP | 11 441 | 4,28 | 267 | 17,18 | ||||
| 2025-07-18 | 13F | SOA Wealth Advisors, LLC. | 2 148 | 0,00 | 50 | 11,11 | ||||
| 2025-05-13 | 13F | HighTower Advisors, LLC | 0 | −100,00 | 0 | |||||
| 2025-05-13 | 13F | Measured Risk Portfolios, Inc. | 0 | −100,00 | 0 | |||||
| 2025-08-12 | 13F | Change Path, LLC | 21 747 | 9,83 | 507 | 21,05 | ||||
| 2025-08-13 | 13F | Northwestern Mutual Wealth Management Co | 81 977 | −6,51 | 1 910 | 3,08 | ||||
| 2025-08-13 | 13F | Congress Wealth Management LLC / DE / | 33 686 | 785 | ||||||
| 2025-08-14 | 13F | Murphy & Mullick Capital Management Corp | 375 | 0,00 | 9 | 14,29 | ||||
| 2025-09-04 | 13F/A | Advisor Group Holdings, Inc. | 61 425 | 1,42 | 1 432 | 11,80 | ||||
| 2025-08-01 | 13F | Envestnet Asset Management Inc | 85 573 | 8,72 | 1 994 | 19,84 | ||||
| 2025-08-12 | 13F | LPL Financial LLC | 315 471 | 11,92 | 7 350 | 23,36 | ||||
| 2025-07-11 | 13F | Farther Finance Advisors, LLC | 228 | 111,11 | 5 | 150,00 | ||||
| 2025-07-17 | 13F | Wolff Wiese Magana Llc | 127 | 0,00 | 3 | 0,00 | ||||
| 2025-08-08 | 13F | Larson Financial Group LLC | 4 348 | −12,13 | 101 | −2,88 | ||||
| 2025-08-14 | 13F | Sei Investments Co | 9 230 | 215 | ||||||
| 2025-04-18 | 13F | Wolf Group Capital Advisors | 19 506 | −17,08 | 412 | −32,68 | ||||
| 2025-05-14 | 13F | Caitlin John, LLC | 0 | −100,00 | 0 | |||||
| 2025-08-14 | 13F | Raymond James Financial Inc | 54 028 | −17,28 | 1 259 | −8,84 | ||||
| 2025-07-21 | 13F | Future Financial Wealth Managment LLC | 20 | 0,00 | 0 | |||||
| 2025-08-11 | 13F | Aptus Capital Advisors, LLC | 216 | 0,00 | 5 | 25,00 | ||||
| 2025-08-08 | 13F | Capital Investment Advisory Services, LLC | 354 | 0,00 | 8 | 14,29 | ||||
| 2025-08-14 | 13F | Hancock Prospecting Pty Ltd | 161 901 | 0,00 | 3 772 | 10,23 | ||||
| 2025-08-14 | 13F | Comerica Bank | 2 388 | 0,00 | 56 | 10,00 | ||||
| 2025-08-04 | 13F | Creative Financial Designs Inc /adv | 5 845 | −23,83 | 136 | −16,05 | ||||
| 2025-07-28 | 13F | Harbour Investments, Inc. | 1 746 | −36,74 | 41 | −31,03 | ||||
| 2025-08-12 | 13F | CIBC Private Wealth Group, LLC | 229 | 0,00 | 5 | 25,00 | ||||
| 2025-08-12 | 13F | Steward Partners Investment Advisory, Llc | 412 | 4,30 | 10 | 12,50 | ||||
| 2025-07-17 | 13F | Archford Capital Strategies, LLC | 0 | −100,00 | 0 | |||||
| 2025-04-21 | 13F | Friedenthal Financial | 0 | −100,00 | 0 | |||||
| 2025-08-13 | 13F | Financial Freedom, LLC | 20 019 | −25,60 | 466 | −17,96 | ||||
| 2025-05-28 | 13F | Intrua Financial, LLC | 0 | −100,00 | 0 | −100,00 | ||||
| 2025-05-09 | 13F | Pathway Financial Advisers, LLC | 0 | −100,00 | 0 | |||||
| 2025-05-15 | 13F | Glenmede Trust Co Na | 610 | 0,00 | 13 | −14,29 | ||||
| 2025-07-01 | 13F | Harbor Investment Advisory, Llc | 0 | −100,00 | 0 | |||||
| 2025-07-31 | 13F | Moment Partners, LLC | 13 775 | −3,64 | 321 | 5,96 | ||||
| 2025-08-29 | 13F | Total Investment Management Inc | 686 | 16 | ||||||
| 2025-08-14 | 13F | Destination Wealth Management | 23 909 | −3,30 | 557 | 6,70 | ||||
| 2025-08-14 | 13F | Fmr Llc | 1 209 | −30,84 | 28 | −22,22 | ||||
| 2025-05-02 | 13F | Whittier Trust Co | 0 | −100,00 | 0 | |||||
| 2025-07-24 | 13F | JNBA Financial Advisors | 0 | −100,00 | 0 | |||||
| 2025-07-28 | 13F | Duncker Streett & Co Inc | 101 | 2 | ||||||
| 2025-08-05 | 13F | Cherry Tree Wealth Management, LLC | 1 685 | 0,00 | 39 | 11,43 | ||||
| 2025-08-04 | 13F | Spire Wealth Management | 300 | 50,00 | 7 | 50,00 | ||||
| 2025-07-29 | 13F | Tradewinds Capital Management, LLC | 21 | 0,00 | 0 | |||||
| 2025-05-13 | 13F | EverSource Wealth Advisors, LLC | 0 | −100,00 | 0 | |||||
| 2025-07-17 | 13F | Jackson, Grant Investment Advisers, Inc. | 295 | 0,00 | 7 | 0,00 | ||||
| 2025-08-01 | 13F | Bessemer Group Inc | 1 350 | 1 250,00 | 0 | |||||
| 2025-05-15 | 13F | Tower Research Capital LLC (TRC) | 0 | −100,00 | 0 | |||||
| 2025-05-09 | 13F | GeoWealth Management, LLC | 0 | −100,00 | 0 | |||||
| 2025-08-05 | 13F | NewSquare Capital LLC | 37 | 1 | ||||||
| 2025-08-15 | 13F | Morgan Stanley | 19 195 | −37,47 | 447 | −31,02 | ||||
| 2025-08-18 | 13F | N.E.W. Advisory Services LLC | 271 | 0,00 | 6 | 20,00 | ||||
| 2025-04-25 | 13F | Red Tortoise LLC | 0 | −100,00 | 0 | |||||
| 2025-07-21 | 13F | Mirae Asset Global Investments Co., Ltd. | 7 000 | 0,00 | 163 | 9,40 | ||||
| 2025-08-14 | 13F | Dagco, Inc. | 848 | 0,00 | 20 | 11,76 | ||||
| 2025-07-25 | 13F | NorthRock Partners, LLC | 88 | 0,00 | 2 | 100,00 | ||||
| 2025-07-16 | 13F | PFS Partners, LLC | 97 | 0,00 | 2 | 0,00 | ||||
| 2025-07-17 | 13F | Beacon Capital Management, LLC | 0 | −100,00 | 0 | |||||
| 2025-08-14 | 13F | Susquehanna International Group, Llp | 35 560 | −13,67 | 829 | −4,83 | ||||
| 2025-04-10 | 13F | Grassi Investment Management | 0 | −100,00 | 0 | |||||
| 2025-08-13 | 13F | Capital Analysts, Inc. | 1 570 | 0,00 | 0 | |||||
| 2025-08-08 | 13F | Emerald Investment Partners, Llc | 686 | 16 | ||||||
| 2025-05-14 | 13F | WCG Wealth Advisors LLC | 0 | −100,00 | 0 | |||||
| 2025-08-12 | 13F | Cook Wealth Management Group Llc | 0 | −100,00 | 0 | |||||
| 2025-08-14 | 13F | GWM Advisors LLC | 2 420 | 4,54 | 56 | 16,67 | ||||
| 2025-08-14 | 13F | Federation des caisses Desjardins du Quebec | 4 422 | −2,96 | 103 | 7,29 | ||||
| 2025-07-28 | 13F | BRYN MAWR TRUST Co | 360 | 0,00 | 8 | 14,29 | ||||
| 2025-08-05 | 13F | Westside Investment Management, Inc. | 200 | 0,00 | 5 | 0,00 | ||||
| 2025-08-14 | 13F | Wells Fargo & Company/mn | 19 427 | −10,13 | 453 | −0,88 | ||||
| 2025-06-10 | 13F | Birchbrook, Inc. | 0 | −100,00 | 0 | −100,00 | ||||
| 2025-08-05 | 13F | Fourth Dimension Wealth, LLC | 100 | 0,00 | 2 | 0,00 | ||||
| 2025-08-13 | 13F | Jones Financial Companies Lllp | 5 439 | 24,92 | 127 | 35,48 | ||||
| 2025-08-14 | 13F | Group One Trading, L.p. | 100 | 0,00 | 2 | 0,00 | ||||
| 2025-05-02 | 13F | Capital A Wealth Management, LLC | 0 | −100,00 | 0 | |||||
| 2025-08-11 | 13F | Elite Financial, Inc. | 0 | −100,00 | 0 | |||||
| 2025-08-14 | 13F | Royal Bank Of Canada | 35 717 | −11,48 | 832 | −2,58 |
Other Listings
| MX:DRIV |