Grundläggande statistik
| Institutionella ägare | 130 total, 130 long only, 0 short only, 0 long/short - change of 4,84% MRQ |
| Genomsnittlig portföljallokering | 2.2599 % - change of −2,03% MRQ |
| Institutionella aktier (lång) | 8 692 215 (ex 13D/G) - change of 0,95MM shares 12,28% MRQ |
| Institutionellt värde (lång) | $ 855 845 USD ($1000) |
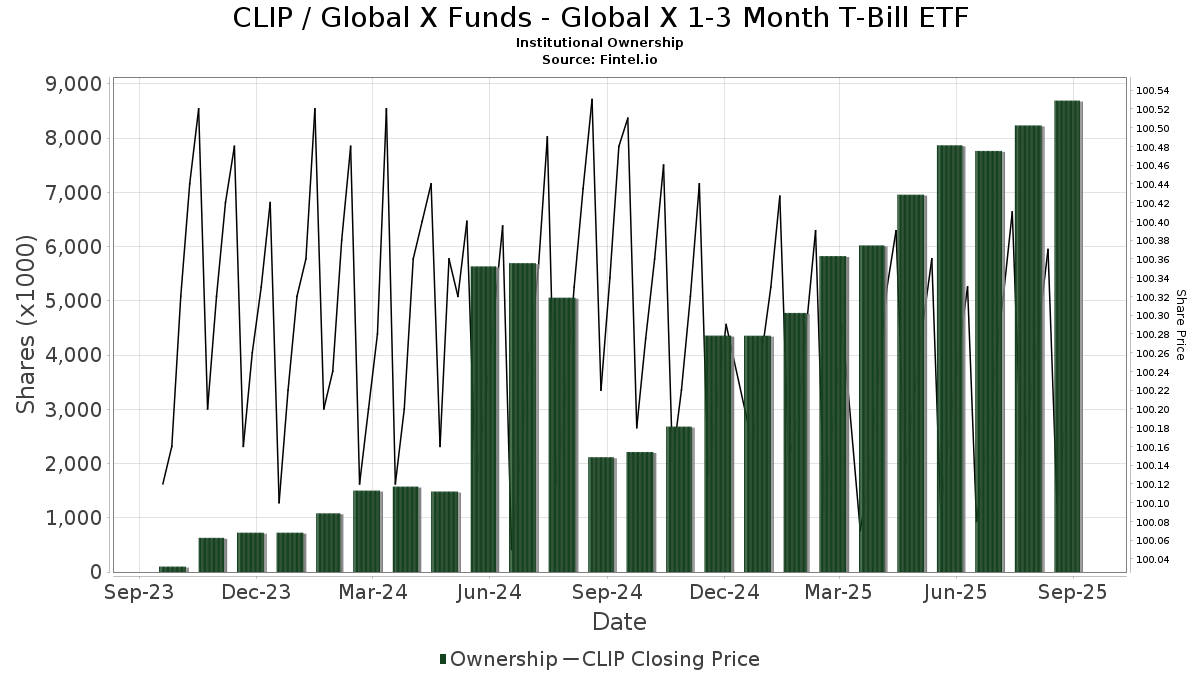
Institutionellt ägande och aktieägare
Global X Funds - Global X 1-3 Month T-Bill ETF (US:CLIP) har 130 Institutionella ägare och aktieägare som har lämnat in 13D/G- eller 13F-formulär till Securities Exchange Commission (SEC). Dessa institut innehar totalt 8,692,215 aktier. Största aktieägare inkluderar Sei Investments Co, LPL Financial LLC, 49 Wealth Management, Llc, Capital Investment Advisors, LLC, Pasadena Private Wealth, LLC, Mjp Associates Inc /adv, Advisor OS, LLC, Accurate Wealth Management, LLC, Peterson Wealth Advisors, LLC, and MIRAE ASSET GLOBAL ETFS HOLDINGS Ltd. .
Global X Funds - Global X 1-3 Month T-Bill ETF (ARCA:CLIP) Institutionell ägarstruktur visar institutioners och fonders nuvarande positioner i företaget, samt de senaste förändringarna i positionernas storlek. Större aktieägare kan vara enskilda investerare, fonder, hedgefonder eller institutioner. Bilaga 13D visar att investeraren äger (eller ägde) mer än 5% av företaget och avser (eller avsåg) att aktivt eftersträva en förändring av affärsstrategin. Schedule 13G indikerar en passiv investering på över 5%.
The share price as of September 16, 2025 is 100,28 / share. Previously, on September 17, 2024, the share price was 100,29 / share. This represents a decline of 0,01% over that period.
Fondsentimentets poäng
Fondsentimentet poängen(fka Ägarackumulation-poäng) visar vilka aktier som är mest köpta av fonder. Det är resultatet av en sofistikerad kvantitativ flerfaktormodell som identifierar företag med de högsta nivåerna av institutionell ackumulering. Poängsättningsmodellen använder en kombination av den totala ökningen av redovisade ägare, förändringarna i portföljallokeringarna för dessa ägare och andra mått. Siffran sträcker sig från 0 till 100, där högre siffror indikerar en högre nivå av ackumulering i förhållande till sina konkurrenter, och 50 är genomsnittet.
Uppdateringsfrekvens: Dagligen
Se Ownership Explorer, som innehåller en lista över de högst rankade företagen.
Institutionell sälj/köp-kvot
Förutom att rapportera vanliga eget kapital- och skuldemissioner måste institutioner med mer än 100MM tillgångar under förvaltning också avslöja sina innehav av sälj- och köpoptioner. Eftersom säljoptioner i allmänhet indikerar ett negativt sentiment och köpoptioner indikerar ett positivt sentiment, kan vi få en uppfattning om det övergripande institutionella sentimentet genom att plotta förhållandet mellan säljoptioner och köpoptioner. Diagrammet till höger visar det historiska förhållandet mellan sälj- och köpoptioner för detta instrument.
Genom att använda sälj/köp-kvoten som en indikator på aktieägarnas sentiment undviker man en av de största bristerna med att använda det totala institutionella ägandet, nämligen att en betydande del av de förvaltade tillgångarna investeras passivt för att följa index. Passivt förvaltade fonder köper vanligtvis inte optioner, så indikatorn för sälj/köp-kvoten ger en bättre bild av stämningen i aktivt förvaltade fonder.
13F- och NPORT-arkiveringar
Detaljer om 13F-arkiveringar är gratis. Detaljer om NP-arkiveringar kräver ett premiummedlemskap. Gröna rader indikerar nya positioner. Röda rader indikerar stängda positioner. Klicka på länk symbolen för att se hela transaktionshistoriken.
Uppgradera
för att låsa upp premiumdata och exportera till Excel ![]() .
.
| Fil Datum | Källa | Investerare | Typ | Genomsnittligt pris (beräknat) |
Aktier | Δ Aktier (%) |
Rapporterat värde (1000 USD) |
Δ Värde (%) |
Portföljallokering (%) |
|
|---|---|---|---|---|---|---|---|---|---|---|
| 2025-08-14 | 13F | Bank Of America Corp /de/ | 41 007 | 115,38 | 4 118 | 115,32 | ||||
| 2025-08-06 | 13F | Convergence Financial, LLC | 50 564 | 5 078 | ||||||
| 2025-07-28 | 13F | Courier Capital Llc | 3 142 | 25,53 | 316 | 25,50 | ||||
| 2025-06-27 | NP | BTRN - Global X Bitcoin Trend Strategy ETF | 53 060 | 77,58 | 5 327 | 77,47 | ||||
| 2025-07-16 | 13F | Beaumont Financial Advisors, LLC | 4 198 | 1,06 | 422 | 0,96 | ||||
| 2025-07-09 | 13F | Byrne Asset Management LLC | 680 | 9,85 | 68 | 9,68 | ||||
| 2025-07-18 | 13F | Truist Financial Corp | 64 660 | −10,26 | 6 493 | −10,28 | ||||
| 2025-05-14 | 13F | Comerica Bank | 0 | −100,00 | 0 | |||||
| 2025-07-17 | 13F/A | Capital Investment Advisors, LLC | 423 479 | 104,10 | 42 526 | 104,06 | ||||
| 2025-07-21 | 13F | Life Planning Partners, Inc | 16 715 | 29,02 | 1 679 | 28,98 | ||||
| 2025-08-14 | 13F | Jane Street Group, Llc | 67 424 | 1 439,71 | 6 771 | 1 442,14 | ||||
| 2025-07-30 | NP | EMBD - Global X Emerging Markets Bond ETF This fund is a listed as child fund of Mirae Asset Global Investments Co., Ltd. and if that institution has disclosed ownership in this security, then these positions will not be double counted when calculating total shares and total value | 20 000 | 0,00 | 2 008 | 0,00 | ||||
| 2025-07-15 | 13F | Accurate Wealth Management, LLC | 281 383 | −15,22 | 28 187 | −15,23 | ||||
| 2025-07-10 | 13F | Stewardship Advisors, LLC | 2 946 | 296 | ||||||
| 2025-07-22 | 13F | SOL Capital Management CO | 56 215 | 28,89 | 6 | 25,00 | ||||
| 2025-08-07 | 13F | Kestra Private Wealth Services, Llc | 4 917 | 494 | ||||||
| 2025-07-30 | NP | RATE - Global X Interest Rate Hedge ETF | 22 450 | 28,65 | 2 254 | 28,65 | ||||
| 2025-08-12 | 13F | Putnam Fl Investment Management Co | 2 935 | −95,31 | 295 | −95,32 | ||||
| 2025-07-25 | 13F | Cwm, Llc | 13 | 8,33 | 0 | |||||
| 2025-07-29 | 13F | Stratos Wealth Partners, LTD. | 20 532 | −14,41 | 2 062 | −14,45 | ||||
| 2025-07-30 | 13F | Nottingham Advisors, Inc. | 29 592 | 3,16 | 2 972 | 3,12 | ||||
| 2025-08-12 | 13F | Jpmorgan Chase & Co | 0 | −100,00 | 0 | |||||
| 2025-05-14 | 13F | Susquehanna International Group, Llp | 0 | −100,00 | 0 | |||||
| 2025-08-11 | 13F | Private Advisor Group, LLC | 66 194 | 124,84 | 6 647 | 124,86 | ||||
| 2025-07-18 | 13F | Precision Wealth Strategies, LLC | 35 484 | 11,16 | 3 563 | 11,14 | ||||
| 2025-08-19 | 13F | Advisory Services Network, LLC | 32 497 | −6,14 | 3 263 | −6,18 | ||||
| 2025-07-28 | 13F | Mutual Advisors, LLC | 6 004 | 1,26 | 602 | 1,18 | ||||
| 2025-08-01 | 13F | Pasadena Private Wealth, LLC | 378 114 | 37 970 | ||||||
| 2025-08-11 | 13F | Principal Securities, Inc. | 4 193 | 58,53 | 421 | 59,47 | ||||
| 2025-07-25 | 13F | Concurrent Investment Advisors, LLC | 14 986 | 1,28 | 1 505 | 1,21 | ||||
| 2025-07-16 | 13F | Maridea Wealth Management LLC | 4 165 | 418 | ||||||
| 2025-07-18 | 13F | PFG Investments, LLC | 3 380 | 0,21 | 339 | 0,30 | ||||
| 2025-07-14 | 13F | Stapp Wealth Management, Pllc | 121 159 | 20,08 | 12 167 | 20,06 | ||||
| 2025-08-08 | 13F | Wealth Alliance | 29 601 | 2 973 | ||||||
| 2025-08-11 | 13F | WPG Advisers, LLC | 977 | −30,95 | 98 | −30,99 | ||||
| 2025-08-13 | 13F | Lumbard & Kellner, LLC | 25 257 | 48,64 | 2 536 | 48,65 | ||||
| 2025-07-23 | 13F | Meitav Dash Investments Ltd | 3 826 | −66,50 | 384 | −66,58 | ||||
| 2025-08-14 | 13F | Mml Investors Services, Llc | 13 309 | 29,43 | 1 | 0,00 | ||||
| 2025-08-07 | 13F | Verus Capital Partners, Llc | 41 150 | −26,12 | 4 132 | −26,14 | ||||
| 2025-07-23 | 13F | Castle Rock Wealth Management, LLC | 19 581 | 31,57 | 1 964 | 31,83 | ||||
| 2025-08-11 | 13F | Rothschild Investment Llc | 9 250 | 0,00 | 929 | −0,11 | ||||
| 2025-08-13 | 13F | Virtue Capital Management, LLC | 0 | −100,00 | 0 | |||||
| 2025-08-08 | 13F | Compass Financial Services Inc | 420 | 0,96 | 42 | 2,44 | ||||
| 2025-07-24 | 13F/A | McElhenny Sheffield Capital Management, LLC | 3 263 | −56,44 | 328 | −56,52 | ||||
| 2025-05-15 | 13F | Gwn Securities Inc. | 0 | −100,00 | 0 | |||||
| 2025-08-04 | 13F | Creekmur Asset Management LLC | 79 559 | −89,47 | 7 989 | −89,48 | ||||
| 2025-08-14 | 13F | Two Sigma Securities, Llc | 5 690 | 571 | ||||||
| 2025-08-12 | 13F | XTX Topco Ltd | 0 | −100,00 | 0 | |||||
| 2025-07-11 | 13F | Global X Japan Co., Ltd. | 100 808 | −75,48 | 10 123 | −75,48 | ||||
| 2025-08-11 | 13F | Inspire Advisors, LLC | 83 566 | 22,78 | 8 392 | 22,77 | ||||
| 2025-08-12 | 13F | PSI Advisors, LLC | 0 | −100,00 | 0 | |||||
| 2025-05-16 | 13F | Coppell Advisory Solutions LLC | 0 | −100,00 | 0 | |||||
| 2025-05-12 | 13F | WealthPlan Investment Management, LLC | 0 | −100,00 | 0 | |||||
| 2025-08-15 | 13F | Equitable Holdings, Inc. | 2 900 | 18,76 | 291 | 18,78 | ||||
| 2025-07-17 | 13F | San Luis Wealth Advisors LLC | 2 312 | −12,32 | 0 | |||||
| 2025-07-15 | 13F | Fortitude Family Office, LLC | 0 | −100,00 | 0 | |||||
| 2025-08-08 | 13F | Kingsview Wealth Management, LLC | 15 328 | 268,46 | 1 539 | 269,06 | ||||
| 2025-08-08 | 13F | Mjp Associates Inc /adv | 354 039 | 14 344,68 | 35 553 | 14 352,03 | ||||
| 2025-08-06 | 13F | Commonwealth Equity Services, Llc | 86 842 | 81,58 | 9 | 100,00 | ||||
| 2025-08-07 | 13F | 49 Wealth Management, Llc | 634 034 | 57,92 | 63 670 | 57,89 | ||||
| 2025-08-11 | 13F | Sykon Capital Llc | 39 692 | −26,02 | 3 986 | −26,04 | ||||
| 2025-08-14 | 13F | Royal Bank Of Canada | 14 283 | 2 984,88 | 1 434 | 3 017,39 | ||||
| 2025-07-16 | 13F | Highline Wealth Partners Llc | 67 149 | −2,07 | 6 743 | −2,08 | ||||
| 2025-07-18 | 13F | Cantor Fitzgerald Investment Adviser L.p. | 8 260 | 19,54 | 829 | 19,45 | ||||
| 2025-08-12 | 13F | Calton & Associates, Inc. | 0 | −100,00 | 0 | |||||
| 2025-08-14 | 13F | Bnp Paribas Arbitrage, Sa | 0 | −100,00 | 0 | |||||
| 2025-07-24 | 13F | IFP Advisors, Inc | 1 532 | 0,07 | 154 | 0,00 | ||||
| 2025-07-31 | 13F | 3EDGE Asset Management, LP | 44 919 | 4 509 | ||||||
| 2025-08-15 | 13F | Morgan Stanley | 1 285 | 44,71 | 129 | 44,94 | ||||
| 2025-05-09 | 13F | GeoWealth Management, LLC | 0 | −100,00 | 0 | −100,00 | ||||
| 2025-08-11 | 13F | Perennial Investment Advisors, LLC | 91 273 | 1,49 | 9 166 | 1,46 | ||||
| 2025-08-14 | 13F | UBS Group AG | 375 | 38 | ||||||
| 2025-08-19 | 13F | Newbridge Financial Services Group, Inc. | 250 | −43,18 | 25 | −43,18 | ||||
| 2025-08-08 | 13F | Cetera Investment Advisers | 70 339 | 5,42 | 7 063 | 5,40 | ||||
| 2025-08-15 | 13F | Alaethes Wealth LLC | 115 120 | −0,65 | 11 560 | −0,67 | ||||
| 2025-08-14 | 13F | Stifel Financial Corp | 6 260 | 43,35 | 629 | 43,38 | ||||
| 2025-07-30 | 13F | D.a. Davidson & Co. | 33 621 | 5,23 | 3 376 | 5,20 | ||||
| 2025-08-14 | 13F | Advisor OS, LLC | 345 261 | 13 986,54 | 34 671 | 13 993,90 | ||||
| 2025-07-10 | 13F | Wealth Enhancement Advisory Services, Llc | 90 046 | 10,70 | 9 016 | 10,35 | ||||
| 2025-09-04 | 13F/A | Advisor Group Holdings, Inc. | 133 842 | 128,64 | 13 443 | 128,61 | ||||
| 2025-08-07 | 13F | PFG Advisors | 7 529 | 50,13 | 756 | 50,30 | ||||
| 2025-07-29 | 13F | Stratos Wealth Advisors, LLC | 2 994 | 0,00 | 301 | 0,00 | ||||
| 2025-08-13 | 13F | Renaissance Technologies Llc | 0 | −100,00 | 0 | |||||
| 2025-08-14 | 13F | Wiley Bros.-aintree Capital, Llc | 2 342 | 11,05 | 240 | 13,74 | ||||
| 2025-08-11 | 13F | United Advisor Group, LLC | 7 383 | 741 | ||||||
| 2025-07-30 | 13F | Exencial Wealth Advisors, Llc | 2 777 | 6,89 | 279 | 6,92 | ||||
| 2025-08-01 | 13F | Envestnet Asset Management Inc | 55 316 | 5,66 | 5 555 | 5,63 | ||||
| 2025-07-11 | 13F | Farther Finance Advisors, LLC | 59 580 | 12,26 | 5 983 | 12,63 | ||||
| 2025-08-14 | 13F | Wells Fargo & Company/mn | 1 | 0,00 | 0 | |||||
| 2025-07-14 | 13F | Park Avenue Securities Llc | 0 | −100,00 | 0 | |||||
| 2025-07-29 | 13F | Beverly Hills Private Wealth, LLC | 17 230 | −22,23 | 1 730 | −22,25 | ||||
| 2025-08-14 | 13F | Talon Private Wealth, LLC | 2 672 | 268 | ||||||
| 2025-08-28 | NP | EDGF - 3EDGE Dynamic Fixed Income ETF | 44 919 | 4 511 | ||||||
| 2025-08-04 | 13F | Creative Financial Designs Inc /adv | 283 | −27,62 | 28 | −28,21 | ||||
| 2025-07-18 | 13F | B.O.S.S. Retirement Advisors, LLC | 31 120 | 21,77 | 3 125 | 21,78 | ||||
| 2025-08-12 | 13F | LPL Financial LLC | 810 867 | 12,98 | 81 427 | 12,95 | ||||
| 2025-07-24 | 13F | Blair William & Co/il | 153 | 0,00 | 15 | 0,00 | ||||
| 2025-08-13 | 13F | WCG Wealth Advisors LLC | 0 | −100,00 | 0 | |||||
| 2025-05-15 | 13F | Ausdal Financial Partners, Inc. | 0 | −100,00 | 0 | |||||
| 2025-08-11 | 13F | Resurgent Financial Advisors LLC | 7 119 | 715 | ||||||
| 2025-08-14 | 13F | Sei Investments Co | 1 461 135 | 3,44 | 146 727 | 3,42 | ||||
| 2025-08-14 | 13F | Raymond James Financial Inc | 14 131 | −5,82 | 1 419 | −5,84 | ||||
| 2025-08-27 | 13F/A | Brinker Capital Investments, LLC | 88 863 | −19,33 | 8 924 | −19,34 | ||||
| 2025-07-25 | 13F | We Are One Seven, LLC | 60 168 | 8,99 | 6 042 | 8,98 | ||||
| 2025-05-14 | 13F | Smartleaf Asset Management LLC | 0 | −100,00 | 0 | |||||
| 2025-07-21 | 13F | Ascent Group, LLC | 2 323 | 233 | ||||||
| 2025-07-29 | 13F | Woodard & Co Asset Management Group Inc /adv | 109 251 | −4,14 | 10 971 | −4,16 | ||||
| 2025-08-14 | 13F | MIRAE ASSET GLOBAL ETFS HOLDINGS Ltd. | 175 510 | 9,95 | 17 625 | 9,92 | ||||
| 2025-08-12 | 13F | Weaver Consulting Group | 4 701 | 472 | ||||||
| 2025-08-14 | 13F | Gerber Kawasaki Wealth & Investment Management | 48 405 | 70,86 | 4 861 | 70,83 | ||||
| 2025-04-23 | 13F | Continuum Advisory, LLC | 0 | −100,00 | 0 | |||||
| 2025-07-16 | 13F | Pacific Sage Partners, LLC | 90 939 | 229,47 | 9 132 | 229,44 | ||||
| 2025-08-08 | 13F | WASHINGTON TRUST Co | 0 | −100,00 | 0 | |||||
| 2025-08-01 | 13F | GoalVest Advisory LLC | 5 000 | 0,00 | 502 | 0,00 | ||||
| 2025-08-06 | 13F | Golden State Wealth Management, LLC | 133 | 17,70 | 13 | 18,18 | ||||
| 2025-07-22 | 13F | Merit Financial Group, LLC | 16 501 | 5,26 | 1 657 | 5,27 | ||||
| 2025-07-28 | 13F | Harbour Investments, Inc. | 95 649 | −3,28 | 9 605 | −3,29 | ||||
| 2025-08-12 | 13F | Running Point Capital Advisors, LLC | 32 938 | 54,38 | 3 308 | 54,39 | ||||
| 2025-08-13 | 13F | Gateway Wealth Partners, LLC | 7 012 | −12,48 | 704 | −12,44 | ||||
| 2025-07-23 | 13F | Gentry Private Wealth, Llc | 5 550 | 0,00 | 557 | 0,00 | ||||
| 2025-08-01 | 13F | Rossby Financial, LCC | 91 | 0,00 | 9 | 0,00 | ||||
| 2025-08-07 | 13F | Curtis Advisory Group, LLC | 102 337 | −15,85 | 10 277 | −15,87 | ||||
| 2025-06-30 | NP | BITS - Global X Blockchain & Bitcoin Strategy ETF This fund is a listed as child fund of Mirae Asset Global Investments Co., Ltd. and if that institution has disclosed ownership in this security, then these positions will not be double counted when calculating total shares and total value | 82 000 | −24,35 | 8 232 | −24,40 | ||||
| 2025-07-23 | 13F | Guild Investment Management, Inc. | 78 960 | 3,32 | 7 929 | 3,30 | ||||
| 2025-08-13 | 13F | Beacon Pointe Advisors, LLC | 11 069 | 0,64 | 1 112 | 0,63 | ||||
| 2025-07-22 | 13F | Belpointe Asset Management LLC | 102 780 | −45,65 | 10 321 | −45,66 | ||||
| 2025-08-18 | 13F | Geneos Wealth Management Inc. | 1 775 | 0,85 | 178 | 1,14 | ||||
| 2025-07-25 | 13F | Community Bank, N.A. | 27 | −94,58 | 3 | −96,00 | ||||
| 2025-07-14 | 13F | Golden State Equity Partners | 0 | −100,00 | 0 | |||||
| 2025-07-14 | 13F | Seed Wealth Management, Inc. | 0 | −100,00 | 0 | |||||
| 2025-07-17 | 13F | K2 Financial Inc. | 6 258 | −5,30 | 627 | −5,29 | ||||
| 2025-08-08 | 13F | Avantax Advisory Services, Inc. | 15 047 | 77,48 | 1 511 | 77,56 | ||||
| 2025-05-12 | 13F | Fmr Llc | 0 | −100,00 | 0 | |||||
| 2025-07-21 | 13F | Mirae Asset Global Investments Co., Ltd. | 55 470 | 556,45 | 5 570 | 556,84 | ||||
| 2025-08-13 | 13F | Flow Traders U.s. Llc | 9 526 | −81,01 | 1 | −100,00 | ||||
| 2025-08-14 | 13F | Fortress Private Ledger, Llc | 3 597 | 16,14 | 361 | 16,08 | ||||
| 2025-08-12 | 13F | Global Retirement Partners, LLC | 698 | −22,96 | 70 | −22,22 | ||||
| 2025-08-11 | 13F | Plum Street Advisors, LLC | 14 483 | −2,19 | 1 454 | −2,22 | ||||
| 2025-08-12 | 13F | Proequities, Inc. | 0 | 0 | ||||||
| 2025-07-09 | 13F | Fiduciary Alliance LLC | 22 844 | 2 294 | ||||||
| 2025-07-25 | 13F | Atria Wealth Solutions, Inc. | 18 306 | −3,43 | 1 838 | −3,47 | ||||
| 2025-08-15 | 13F | Kestra Advisory Services, LLC | 2 990 | 300 | ||||||
| 2025-05-15 | 13F | Centaurus Financial, Inc. | 0 | −100,00 | 0 | |||||
| 2025-07-07 | 13F | Peterson Wealth Advisors, LLC | 246 717 | 0,15 | 24 775 | 0,43 | ||||
| 2025-07-31 | 13F | West Michigan Advisors, Llc | 5 845 | 1,05 | 587 | 1,03 | ||||
| 2025-08-06 | 13F | Prospera Financial Services Inc | 4 450 | −2,20 | 447 | −2,41 | ||||
| 2025-08-14 | 13F | Citadel Advisors Llc | 17 981 | −7,56 | 1 806 | −7,58 | ||||
| 2025-08-08 | 13F | Gts Securities Llc | 0 | −100,00 | 0 | |||||
| 2025-08-08 | 13F | SBI Securities Co., Ltd. | 8 458 | 238,46 | 849 | 238,25 | ||||
| 2025-08-04 | 13F | Terril Brothers, Inc. | 115 869 | 481,03 | 11 636 | 481,17 | ||||
| 2025-08-14 | 13F | GWM Advisors LLC | 3 878 | −92,62 | 389 | −92,63 | ||||
| 2025-05-15 | 13F/A | Orion Portfolio Solutions, LLC | 110 155 | 14,57 | 11 064 | 14,95 | ||||
| 2025-07-31 | 13F | Whipplewood Advisors, LLC | 52 | −95,06 | 5 | 0,00 | ||||
| 2025-08-12 | 13F | Change Path, LLC | 14 839 | 28,88 | 1 490 | 28,89 | ||||
| 2025-07-07 | 13F | Nova Wealth Management, Inc. | 188 | 19 | ||||||
| 2025-08-13 | 13F | Quadrature Capital Ltd | 59 724 | 5 996 | ||||||
| 2025-05-20 | 13F/A | Colony Group, LLC | 0 | −100,00 | 0 |