Grundläggande statistik
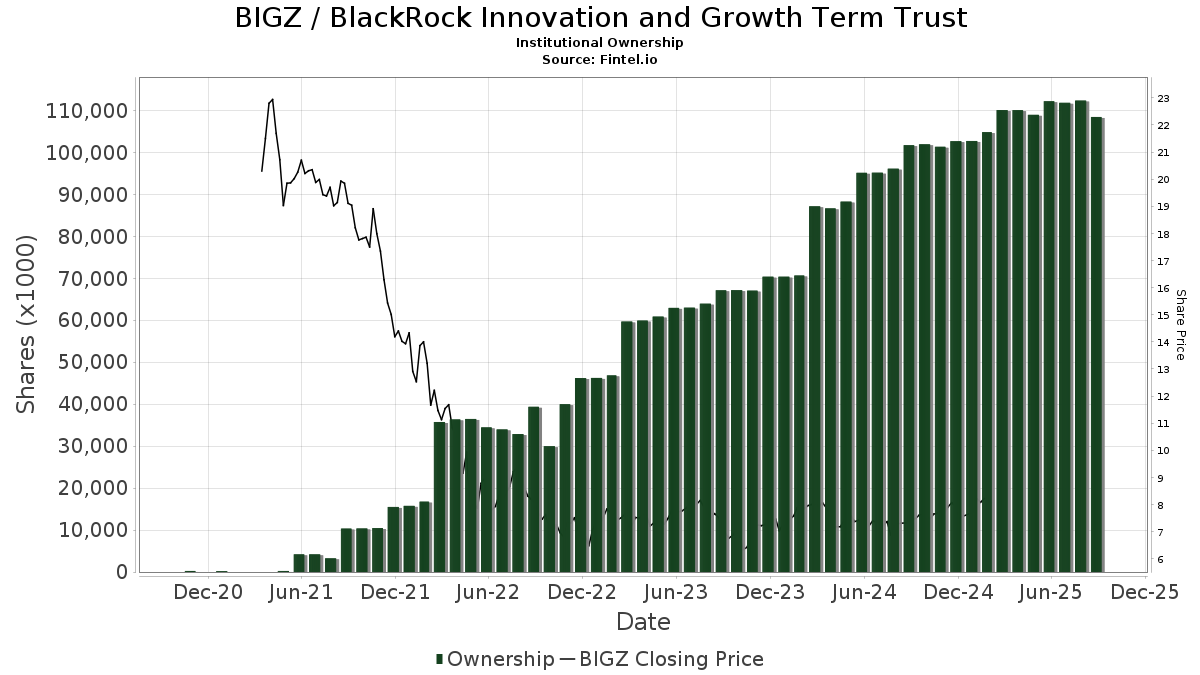
| Institutionella ägare | 124 total, 124 long only, 0 short only, 0 long/short - change of −0,80% MRQ |
| Genomsnittlig portföljallokering | 0.4867 % - change of −7,88% MRQ |
| Institutionella aktier (lång) | 108 457 748 (ex 13D/G) - change of −3,72MM shares −3,31% MRQ |
| Institutionellt värde (lång) | $ 714 766 USD ($1000) |
Institutionellt ägande och aktieägare
BlackRock Innovation and Growth Term Trust (US:BIGZ) har 124 Institutionella ägare och aktieägare som har lämnat in 13D/G- eller 13F-formulär till Securities Exchange Commission (SEC). Dessa institut innehar totalt 108,457,748 aktier. Största aktieägare inkluderar Saba Capital Management, L.P., Morgan Stanley, Sit Investment Associates Inc, CEFS - Saba Closed-End Funds ETF, PCEF - Invesco CEF Income Composite ETF, Lazard Asset Management Llc, Invesco Ltd., Absolute Investment Advisers Llc, Raymond James Financial Inc, and Penserra Capital Management LLC .
BlackRock Innovation and Growth Term Trust (NYSE:BIGZ) Institutionell ägarstruktur visar institutioners och fonders nuvarande positioner i företaget, samt de senaste förändringarna i positionernas storlek. Större aktieägare kan vara enskilda investerare, fonder, hedgefonder eller institutioner. Bilaga 13D visar att investeraren äger (eller ägde) mer än 5% av företaget och avser (eller avsåg) att aktivt eftersträva en förändring av affärsstrategin. Schedule 13G indikerar en passiv investering på över 5%.
The share price as of February 19, 2025 is 8,06 / share. Previously, on September 13, 2024, the share price was 7,38 / share. This represents an increase of 9,21% over that period.
Fondsentimentets poäng
Fondsentimentet poängen(fka Ägarackumulation-poäng) visar vilka aktier som är mest köpta av fonder. Det är resultatet av en sofistikerad kvantitativ flerfaktormodell som identifierar företag med de högsta nivåerna av institutionell ackumulering. Poängsättningsmodellen använder en kombination av den totala ökningen av redovisade ägare, förändringarna i portföljallokeringarna för dessa ägare och andra mått. Siffran sträcker sig från 0 till 100, där högre siffror indikerar en högre nivå av ackumulering i förhållande till sina konkurrenter, och 50 är genomsnittet.
Uppdateringsfrekvens: Dagligen
Se Ownership Explorer, som innehåller en lista över de högst rankade företagen.
Institutionell sälj/köp-kvot
Förutom att rapportera vanliga eget kapital- och skuldemissioner måste institutioner med mer än 100MM tillgångar under förvaltning också avslöja sina innehav av sälj- och köpoptioner. Eftersom säljoptioner i allmänhet indikerar ett negativt sentiment och köpoptioner indikerar ett positivt sentiment, kan vi få en uppfattning om det övergripande institutionella sentimentet genom att plotta förhållandet mellan säljoptioner och köpoptioner. Diagrammet till höger visar det historiska förhållandet mellan sälj- och köpoptioner för detta instrument.
Genom att använda sälj/köp-kvoten som en indikator på aktieägarnas sentiment undviker man en av de största bristerna med att använda det totala institutionella ägandet, nämligen att en betydande del av de förvaltade tillgångarna investeras passivt för att följa index. Passivt förvaltade fonder köper vanligtvis inte optioner, så indikatorn för sälj/köp-kvoten ger en bättre bild av stämningen i aktivt förvaltade fonder.
13F- och NPORT-arkiveringar
Detaljer om 13F-arkiveringar är gratis. Detaljer om NP-arkiveringar kräver ett premiummedlemskap. Gröna rader indikerar nya positioner. Röda rader indikerar stängda positioner. Klicka på länk symbolen för att se hela transaktionshistoriken.
Uppgradera
för att låsa upp premiumdata och exportera till Excel ![]() .
.
| Fil Datum | Källa | Investerare | Typ | Genomsnittligt pris (beräknat) |
Aktier | Δ Aktier (%) |
Rapporterat värde (1000 USD) |
Δ Värde (%) |
Portföljallokering (%) |
|
|---|---|---|---|---|---|---|---|---|---|---|
| 2025-08-13 | 13F | Northwestern Mutual Wealth Management Co | 880 | 6 | ||||||
| 2025-08-15 | 13F | Morgan Stanley | 5 560 989 | −3,09 | 40 818 | 13,63 | ||||
| 2025-08-15 | 13F | CI Private Wealth, LLC | 0 | −100,00 | 0 | |||||
| 2025-05-09 | 13F | CoreCap Advisors, LLC | 0 | −100,00 | 0 | |||||
| 2025-08-13 | 13F | Cresset Asset Management, LLC | 0 | −100,00 | 0 | |||||
| 2025-08-08 | 13F | City Of London Investment Management Co Ltd | 0 | −100,00 | 0 | |||||
| 2025-08-14 | 13F | Stifel Financial Corp | 143 053 | −28,75 | 1 050 | −16,40 | ||||
| 2025-08-11 | 13F | Pineridge Advisors LLC | 1 350 | 0,00 | 10 | 12,50 | ||||
| 2025-08-13 | 13F | Yakira Capital Management, Inc. | 805 926 | 471,51 | 5 915 | 570,63 | ||||
| 2025-04-24 | 13F | Matisse Capital | 0 | −100,00 | 0 | |||||
| 2025-07-25 | 13F | Allspring Global Investments Holdings, LLC | 259 150 | 4,43 | 1 902 | 22,47 | ||||
| 2025-07-28 | 13F | RFG Advisory, LLC | 29 031 | 17,53 | 213 | 38,31 | ||||
| 2025-08-12 | 13F | LPL Financial LLC | 75 985 | 28,93 | 558 | 51,36 | ||||
| 2025-08-14 | 13F | Goldman Sachs Group Inc | 27 908 | 205 | ||||||
| 2025-08-14 | 13F | CF Capital LLC | 566 000 | −42,83 | 4 144 | −33,78 | ||||
| 2025-07-24 | 13F | Eastern Bank | 1 867 | 0,00 | 14 | 18,18 | ||||
| 2025-08-08 | 13F | Creative Planning | 13 132 | 0,00 | 96 | 17,07 | ||||
| 2025-08-14 | 13F | Quantedge Capital Pte Ltd | 12 729 | −82,90 | 93 | −80,00 | ||||
| 2025-04-24 | 13F | Vista Investment Partners Ii, Llc | 0 | −100,00 | 0 | |||||
| 2025-07-10 | 13F | Redhawk Wealth Advisors, Inc. | 34 916 | 256 | ||||||
| 2025-08-27 | NP | ACEFX - Absolute Strategies Fund Institutional Shares | 120 828 | −1,73 | 887 | 15,21 | ||||
| 2025-08-11 | 13F | Blue Bell Private Wealth Management, Llc | 363 966 | −5,35 | 2 672 | 10,97 | ||||
| 2025-08-04 | 13F | Assetmark, Inc | 223 | −23,89 | 2 | 0,00 | ||||
| 2025-08-14 | 13F | Millennium Management Llc | 13 902 | 102 | ||||||
| 2025-05-14 | 13F | Virtus ETF Advisers LLC | 0 | −100,00 | 0 | |||||
| 2025-08-13 | 13F | Sessa Capital IM, L.P. | 2 015 096 | 0,00 | 14 791 | 17,25 | ||||
| 2025-08-14 | 13F | Bulldog Investors, LLP | 610 207 | 23,94 | 4 479 | 45,34 | ||||
| 2025-08-14 | 13F | Comerica Bank | 7 355 | 4,09 | 54 | 20,45 | ||||
| 2025-04-23 | 13F | Winebrenner Capital Management Llc | 0 | −100,00 | 0 | |||||
| 2025-08-14 | 13F | Susquehanna Advisors Group, Inc. | 10 600 | 0,00 | 78 | 16,67 | ||||
| 2025-08-14 | 13F | Bluefin Capital Management, Llc | 54 353 | −90,81 | 399 | −89,25 | ||||
| 2025-08-12 | 13F | Jpmorgan Chase & Co | 1 965 | 14 | ||||||
| 2025-08-14 | 13F | Mariner, LLC | 11 000 | −46,92 | 81 | −37,98 | ||||
| 2025-07-29 | 13F | Uhlmann Price Securities, Llc | 0 | −100,00 | 0 | −100,00 | ||||
| 2025-08-14 | 13F | Royal Bank Of Canada | 542 560 | −77,86 | 3 983 | −74,04 | ||||
| 2025-08-15 | 13F | Prevail Innovative Wealth Advisors, Llc | 228 552 | −4,87 | 1 678 | 11,58 | ||||
| 2025-05-14 | 13F | Landscape Capital Management, L.l.c. | 0 | −100,00 | 0 | |||||
| 2025-08-06 | 13F | Commonwealth Equity Services, Llc | 14 108 | −8,89 | 0 | |||||
| 2025-08-05 | 13F | Bank of New York Mellon Corp | 10 662 | 78 | ||||||
| 2025-08-04 | 13F | Wolverine Asset Management Llc | 12 034 | 88 | ||||||
| 2025-07-14 | 13F | Chapin Davis, Inc. | 93 211 | 30,45 | 684 | 53,02 | ||||
| 2025-07-24 | NP | CEFS - Saba Closed-End Funds ETF | 3 750 438 | 0,00 | 26 178 | −1,83 | ||||
| 2025-05-14 | 13F | Mml Investors Services, Llc | 0 | −100,00 | 0 | |||||
| 2025-09-04 | 13F/A | Advisor Group Holdings, Inc. | 60 959 | 12,29 | 448 | 31,86 | ||||
| 2025-07-15 | 13F | Absolute Investment Advisers Llc | 2 600 158 | 29,97 | 19 085 | 52,40 | ||||
| 2025-08-27 | NP | Special Opportunities Fund, Inc. | 305 194 | 23,94 | 2 240 | 45,36 | ||||
| 2025-08-14 | 13F | Ameriprise Financial Inc | 454 913 | 25,60 | 3 339 | 47,29 | ||||
| 2025-08-14 | 13F | Quarry LP | 1 200 691 | 56,47 | 8 813 | 83,49 | ||||
| 2025-07-17 | 13F | Janney Montgomery Scott LLC | 67 292 | −1,59 | 0 | |||||
| 2025-08-14 | 13F | Balyasny Asset Management Llc | 217 150 | 1 594 | ||||||
| 2025-08-14 | 13F | K2 Principal Fund, L.p. | 34 843 | −0,45 | 256 | 16,44 | ||||
| 2025-07-18 | 13F | PFG Investments, LLC | 17 789 | −4,10 | 131 | 12,07 | ||||
| 2025-08-14 | 13F | UBS Group AG | 1 128 902 | 7,99 | 8 286 | 26,62 | ||||
| 2025-08-08 | 13F | Avantax Advisory Services, Inc. | 0 | −100,00 | 0 | |||||
| 2025-08-13 | 13F | Virtus Investment Advisers, Inc. | 140 903 | −3,70 | 1 034 | 13,01 | ||||
| 2025-08-14 | 13F/A | Rockefeller Capital Management L.P. | 357 576 | 0,24 | 2 625 | 17,56 | ||||
| 2025-07-21 | 13F | Ameritas Advisory Services, LLC | 7 300 | 54 | ||||||
| 2025-07-31 | 13F | Oppenheimer & Co Inc | 225 009 | −0,13 | 1 652 | 17,09 | ||||
| 2025-08-14 | 13F | Jane Street Group, Llc | 86 506 | 13,66 | 635 | 33,19 | ||||
| 2025-07-16 | 13F | Plancorp, LLC | 10 000 | 0,00 | 73 | 17,74 | ||||
| 2025-04-15 | 13F | Noble Wealth Management PBC | 33 400 | 209 | ||||||
| 2025-05-15 | 13F | Baird Financial Group, Inc. | 0 | −100,00 | 0 | |||||
| 2025-08-19 | 13F | National Asset Management, Inc. | 13 108 | −13,47 | 96 | −14,29 | ||||
| 2025-08-13 | 13F/A | StoneX Group Inc. | 10 577 | 78 | ||||||
| 2025-07-31 | 13F | Cambridge Investment Research Advisors, Inc. | 0 | −100,00 | 0 | |||||
| 2025-05-02 | 13F | Mountain Hill Investment Partners Corp. | 0 | −100,00 | 0 | |||||
| 2025-08-14 | 13F | Css Llc/il | 202 841 | −71,74 | 1 489 | −66,88 | ||||
| 2025-08-06 | 13F | Wedbush Securities Inc | 85 212 | −9,58 | 1 | |||||
| 2025-06-26 | NP | Voya Prime Rate Trust | 330 506 | 0,00 | 2 072 | −23,54 | ||||
| 2025-08-12 | 13F | BlackRock, Inc. | 5 000 | 0,00 | 37 | 16,13 | ||||
| 2025-07-24 | 13F | Us Bancorp \de\ | 5 000 | 37 | ||||||
| 2025-07-25 | 13F | Atria Wealth Solutions, Inc. | 42 025 | 104,00 | 309 | 140,63 | ||||
| 2025-08-04 | 13F | Integrity Alliance, Llc. | 0 | −100,00 | 0 | |||||
| 2025-07-14 | 13F | Armstrong Advisory Group, Inc | 2 730 | 20 | ||||||
| 2025-08-14 | 13F | SWAN Capital LLC | 340 | 0,00 | 2 | 0,00 | ||||
| 2025-08-08 | 13F | Hartland & Co., LLC | 12 712 | −29,69 | 93 | −17,70 | ||||
| 2025-08-07 | 13F | Readystate Asset Management Lp | 110 780 | 50,08 | 813 | 75,97 | ||||
| 2025-08-13 | 13F | Hbk Investments L P | 119 957 | −43,52 | 880 | −33,78 | ||||
| 2025-08-06 | 13F | Modera Wealth Management, LLC | 22 982 | 3,02 | 169 | 20,86 | ||||
| 2025-05-12 | 13F | Covestor Ltd | 0 | −100,00 | 0 | |||||
| 2025-08-05 | 13F | Shaker Financial Services, LLC | 0 | −100,00 | 0 | |||||
| 2025-08-28 | NP | YYY - Amplify High Income ETF | 2 227 326 | 2,00 | 16 349 | 19,59 | ||||
| 2025-08-19 | 13F | Newbridge Financial Services Group, Inc. | 6 990 | 51 | ||||||
| 2025-05-12 | 13F | Fmr Llc | 0 | −100,00 | 0 | −100,00 | ||||
| 2025-08-07 | 13F | Fountainhead AM, LLC | 67 235 | 0,00 | 494 | 17,38 | ||||
| 2025-08-14 | 13F | Bank Of America Corp /de/ | 1 153 901 | −8,41 | 8 470 | 7,39 | ||||
| 2025-08-14 | 13F | Prestige Wealth Management Group LLC | 47 | 0,00 | 0 | |||||
| 2025-08-12 | 13F | Steward Partners Investment Advisory, Llc | 88 029 | 0,17 | 646 | 17,45 | ||||
| 2025-08-14 | 13F | Sit Investment Associates Inc | 5 515 699 | 9,76 | 40 | 29,03 | ||||
| 2025-08-13 | 13F | Level Four Advisory Services, Llc | 12 896 | −20,37 | 95 | −6,93 | ||||
| 2025-08-18 | 13F | Geneos Wealth Management Inc. | 6 558 | −10,65 | 48 | 6,67 | ||||
| 2025-08-14 | 13F | Capstone Investment Advisors, Llc | 261 043 | 0,98 | 1 916 | 18,42 | ||||
| 2025-08-05 | 13F | Tsfg, Llc | 1 051 | 3,65 | 0 | |||||
| 2025-08-06 | 13F | Tabor Asset Management, LP | 0 | −100,00 | 0 | −100,00 | ||||
| 2025-05-15 | 13F | Barclays Plc | 0 | −100,00 | 0 | |||||
| 2025-08-11 | 13F | WPG Advisers, LLC | 2 788 | −0,82 | 20 | 17,65 | ||||
| 2025-08-14 | 13F | Almitas Capital LLC | 195 710 | 1,20 | 1 437 | 18,68 | ||||
| 2025-08-13 | 13F | Invesco Ltd. | 2 800 615 | −23,75 | 20 557 | −10,59 | ||||
| 2025-07-17 | 13F | City Holding Co | 0 | −100,00 | 0 | |||||
| 2025-08-12 | 13F | Change Path, LLC | 19 866 | −12,38 | 146 | 2,84 | ||||
| 2025-08-14 | 13F | Karpus Management, Inc. | 1 423 101 | −4,36 | 10 446 | 12,14 | ||||
| 2025-08-12 | 13F | MAI Capital Management | 684 | 0,00 | 5 | 25,00 | ||||
| 2025-08-14 | 13F | Raymond James Financial Inc | 2 488 527 | −0,51 | 18 266 | 16,65 | ||||
| 2025-08-14 | 13F | D. E. Shaw & Co., Inc. | 16 406 | −53,31 | 120 | −45,21 | ||||
| 2025-08-14 | 13F | Alpine Global Management, LLC | 43 038 | 316 | ||||||
| 2025-06-25 | NP | VPC - Virtus Private Credit Strategy ETF | 133 661 | −3,25 | 838 | −25,97 | ||||
| 2025-05-14 | 13F | CIBC Private Wealth Group, LLC | 0 | −100,00 | 0 | −100,00 | ||||
| 2025-08-14 | 13F | Rivernorth Capital Management, Llc | 1 270 917 | −29,53 | 9 329 | −17,37 | ||||
| 2025-08-11 | 13F | NewEdge Wealth, LLC | 10 767 | 0,00 | 80 | 17,91 | ||||
| 2025-08-14 | 13F | Dymon Asia Capital (singapore) Pte. Ltd. | 76 667 | 563 | ||||||
| 2025-08-14 | 13F | Susquehanna International Group, Llp | 0 | −100,00 | 0 | |||||
| 2025-08-14 | 13F | 1607 Capital Partners, LLC | 248 540 | −7,96 | 1 824 | 7,93 | ||||
| 2025-04-14 | 13F | Farther Finance Advisors, LLC | 0 | −100,00 | 0 | |||||
| 2025-08-08 | 13F/A | Ignite Planners, LLC | 14 294 | −9,70 | 107 | 5,94 | ||||
| 2025-08-13 | 13F | Jones Financial Companies Lllp | 0 | −100,00 | 0 | |||||
| 2025-08-08 | 13F | Pnc Financial Services Group, Inc. | 19 776 | −50,16 | 145 | −41,53 | ||||
| 2025-07-16 | 13F | Dakota Wealth Management | 22 606 | −2,61 | 166 | 13,79 | ||||
| 2025-08-11 | 13F | Principal Securities, Inc. | 555 | 4 | ||||||
| 2025-05-05 | 13F | IFP Advisors, Inc | 0 | −100,00 | 0 | |||||
| 2025-07-07 | 13F | Investors Research Corp | 848 | 0,00 | 6 | 20,00 | ||||
| 2025-08-12 | 13F | J.w. Cole Advisors, Inc. | 0 | −100,00 | 0 | |||||
| 2025-08-04 | 13F | Kovack Advisors, Inc. | 20 309 | 149 | ||||||
| 2025-08-15 | 13F | Tower Research Capital LLC (TRC) | 3 122 | −22,84 | 23 | −12,00 | ||||
| 2025-08-11 | 13F | Elequin Capital Lp | 56 526 | 415 | ||||||
| 2025-07-09 | 13F | David J Yvars Group | 13 424 | 8,57 | 99 | 27,27 | ||||
| 2025-08-14 | 13F | Two Sigma Securities, Llc | 0 | −100,00 | 0 | |||||
| 2025-05-01 | 13F | Corrado Advisors, Llc | 0 | −100,00 | 0 | −100,00 | ||||
| 2025-05-16 | 13F | Coppell Advisory Solutions LLC | 0 | −100,00 | 0 | |||||
| 2025-08-14 | 13F | CIBC World Markets Inc. | 20 000 | 147 | ||||||
| 2025-07-28 | NP | PCEF - Invesco CEF Income Composite ETF This fund is a listed as child fund of Invesco Ltd. and if that institution has disclosed ownership in this security, then these positions will not be double counted when calculating total shares and total value | 3 716 268 | 11,92 | 25 940 | 9,87 | ||||
| 2025-07-25 | 13F | Cwm, Llc | 9 339 | 2,99 | 0 | |||||
| 2025-08-14 | 13F | Quantinno Capital Management LP | 146 020 | 1 072 | ||||||
| 2025-08-11 | 13F | Advisor Resource Council | 0 | −100,00 | 0 | |||||
| 2025-08-14 | 13F | GWM Advisors LLC | 57 624 | 14,61 | 423 | 34,39 | ||||
| 2025-07-21 | 13F | Precedent Wealth Partners, Llc | 10 900 | 80 | ||||||
| 2025-08-04 | 13F | Bay Colony Advisory Group, Inc d/b/a Bay Colony Advisors | 0 | −100,00 | 0 | −100,00 | ||||
| 2025-08-12 | 13F | Nemes Rush Group LLC | 0 | −100,00 | 0 | |||||
| 2025-07-29 | NP | Putnam High Income Securities Fund | 176 341 | 49,62 | 1 231 | 46,95 | ||||
| 2025-08-13 | 13F | IAG Wealth Partners, LLC | 0 | 0 | ||||||
| 2025-08-07 | 13F | Samalin Investment Counsel, LLC | 0 | −100,00 | 0 | |||||
| 2025-07-25 | 13F | Concurrent Investment Advisors, LLC | 35 274 | −6,20 | 259 | 9,79 | ||||
| 2025-08-14 | 13F | Harris Associates L P | 25 000 | 184 | ||||||
| 2025-08-14 | 13F | Saba Capital Management, L.P. | 60 675 395 | 0,00 | 445 357 | 17,25 | ||||
| 2025-08-14 | 13F | Wells Fargo & Company/mn | 8 265 | −40,12 | 61 | −30,23 | ||||
| 2025-08-12 | 13F | Proequities, Inc. | 0 | 0 | ||||||
| 2025-05-12 | 13F | Virtu Financial LLC | 0 | −100,00 | 0 | |||||
| 2025-07-21 | 13F | Successful Portfolios LLC | 13 565 | −0,18 | 100 | 16,47 | ||||
| 2025-08-12 | 13F | Insigneo Advisory Services, Llc | 15 100 | 0,00 | 111 | 17,02 | ||||
| 2025-08-13 | 13F | Thomas J. Herzfeld Advisors, Inc. | 0 | −100,00 | 0 | |||||
| 2025-08-11 | 13F | HighTower Advisors, LLC | 80 139 | 149,71 | 588 | 194,00 | ||||
| 2025-08-12 | 13F | Advisors Asset Management, Inc. | 175 298 | 73,18 | 1 287 | 103,16 | ||||
| 2025-07-17 | 13F | HB Wealth Management, LLC | 13 750 | 101 | ||||||
| 2025-07-28 | 13F | Mutual Advisors, LLC | 30 475 | 24,90 | 223 | 45,75 | ||||
| 2025-08-11 | 13F | Private Advisor Group, LLC | 151 876 | 31,04 | 1 115 | 53,66 | ||||
| 2025-07-31 | 13F | City State Bank | 12 913 | 0,00 | 95 | 17,50 | ||||
| 2025-08-04 | 13F | Pensionmark Financial Group, Llc | 0 | −100,00 | 0 | |||||
| 2025-08-06 | 13F | Penserra Capital Management LLC | 2 250 256 | 3,05 | 17 | 23,08 | ||||
| 2025-08-14 | 13F | Lazard Asset Management Llc | 2 871 719 | 16,48 | 21 | 40,00 | ||||
| 2025-07-22 | 13F | Merit Financial Group, LLC | 13 540 | 99 | ||||||
| 2025-07-07 | 13F | Thurston, Springer, Miller, Herd & Titak, Inc. | 40 000 | 0,00 | 294 | 17,20 | ||||
| 2025-08-04 | 13F | 4wealth Advisors, Inc. | 11 021 | 0,00 | 81 | 17,65 | ||||
| 2025-07-11 | 13F | Seacrest Wealth Management, Llc | 56 991 | 11,41 | 418 | 30,63 | ||||
| 2025-08-14 | 13F | Wiley Bros.-aintree Capital, Llc | 15 601 | 0,00 | 115 | 16,33 | ||||
| 2025-07-21 | 13F | Barrett & Company, Inc. | 11 493 | 0,00 | 84 | 18,31 |
Other Listings
| US:BTX | 6,93 US$ |