Grundläggande statistik
| Institutionella ägare | 113 total, 113 long only, 0 short only, 0 long/short - change of −5,00% MRQ |
| Genomsnittlig portföljallokering | 0.1082 % - change of −11,80% MRQ |
| Institutionella aktier (lång) | 6 242 353 (ex 13D/G) - change of 0,08MM shares 1,35% MRQ |
| Institutionellt värde (lång) | $ 231 819 USD ($1000) |
Institutionellt ägande och aktieägare
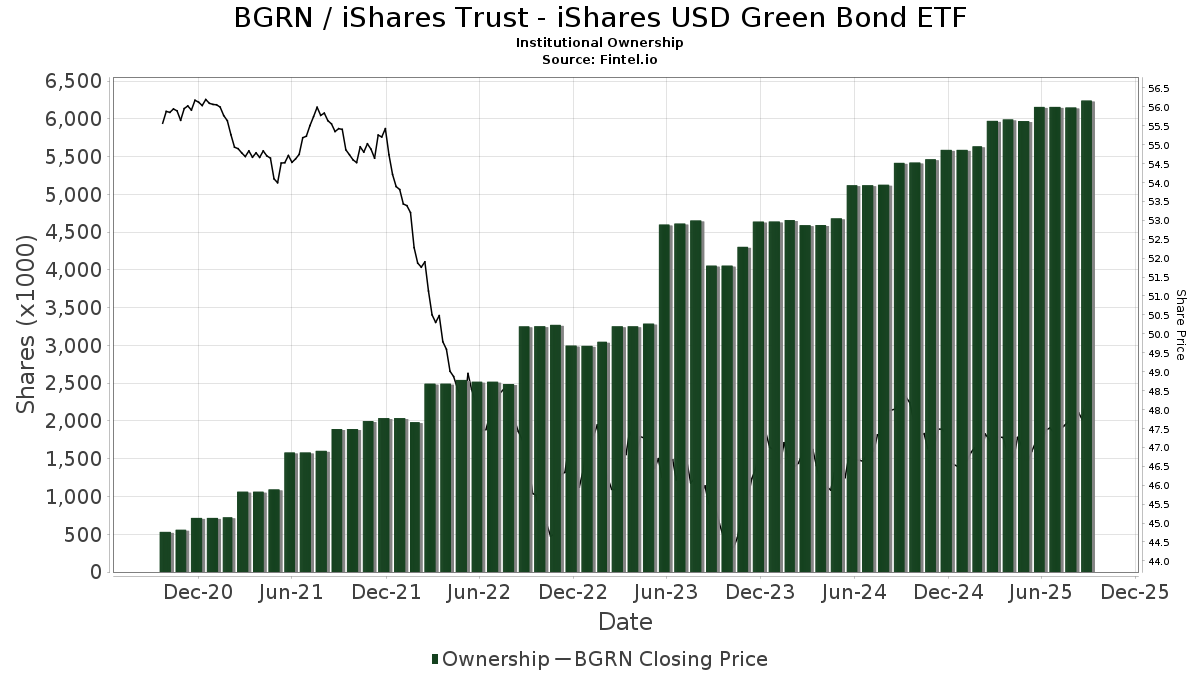
iShares Trust - iShares USD Green Bond ETF (US:BGRN) har 113 Institutionella ägare och aktieägare som har lämnat in 13D/G- eller 13F-formulär till Securities Exchange Commission (SEC). Dessa institut innehar totalt 6,242,353 aktier. Största aktieägare inkluderar Betterment LLC, Empower Advisory Group, LLC, Mercer Global Advisors Inc /adv, Envestnet Asset Management Inc, Bank Of America Corp /de/, Francis Financial, Inc., Royal Bank Of Canada, LPL Financial LLC, Creative Planning, and Seeds Investor Llc .
iShares Trust - iShares USD Green Bond ETF (NasdaqGM:BGRN) Institutionell ägarstruktur visar institutioners och fonders nuvarande positioner i företaget, samt de senaste förändringarna i positionernas storlek. Större aktieägare kan vara enskilda investerare, fonder, hedgefonder eller institutioner. Bilaga 13D visar att investeraren äger (eller ägde) mer än 5% av företaget och avser (eller avsåg) att aktivt eftersträva en förändring av affärsstrategin. Schedule 13G indikerar en passiv investering på över 5%.
The share price as of September 12, 2025 is 48,21 / share. Previously, on September 16, 2024, the share price was 48,52 / share. This represents a decline of 0,63% over that period.
Fondsentimentets poäng
Fondsentimentet poängen(fka Ägarackumulation-poäng) visar vilka aktier som är mest köpta av fonder. Det är resultatet av en sofistikerad kvantitativ flerfaktormodell som identifierar företag med de högsta nivåerna av institutionell ackumulering. Poängsättningsmodellen använder en kombination av den totala ökningen av redovisade ägare, förändringarna i portföljallokeringarna för dessa ägare och andra mått. Siffran sträcker sig från 0 till 100, där högre siffror indikerar en högre nivå av ackumulering i förhållande till sina konkurrenter, och 50 är genomsnittet.
Uppdateringsfrekvens: Dagligen
Se Ownership Explorer, som innehåller en lista över de högst rankade företagen.
Institutionell sälj/köp-kvot
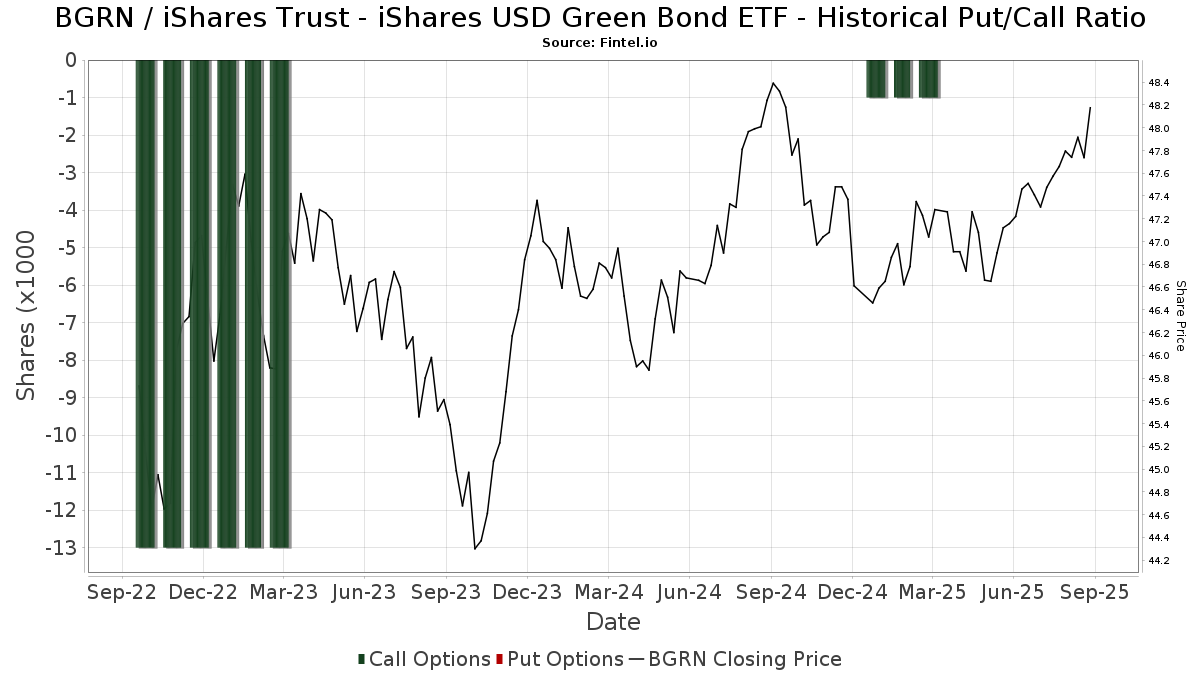
Förutom att rapportera vanliga eget kapital- och skuldemissioner måste institutioner med mer än 100MM tillgångar under förvaltning också avslöja sina innehav av sälj- och köpoptioner. Eftersom säljoptioner i allmänhet indikerar ett negativt sentiment och köpoptioner indikerar ett positivt sentiment, kan vi få en uppfattning om det övergripande institutionella sentimentet genom att plotta förhållandet mellan säljoptioner och köpoptioner. Diagrammet till höger visar det historiska förhållandet mellan sälj- och köpoptioner för detta instrument.
Genom att använda sälj/köp-kvoten som en indikator på aktieägarnas sentiment undviker man en av de största bristerna med att använda det totala institutionella ägandet, nämligen att en betydande del av de förvaltade tillgångarna investeras passivt för att följa index. Passivt förvaltade fonder köper vanligtvis inte optioner, så indikatorn för sälj/köp-kvoten ger en bättre bild av stämningen i aktivt förvaltade fonder.
13F- och NPORT-arkiveringar
Detaljer om 13F-arkiveringar är gratis. Detaljer om NP-arkiveringar kräver ett premiummedlemskap. Gröna rader indikerar nya positioner. Röda rader indikerar stängda positioner. Klicka på länk symbolen för att se hela transaktionshistoriken.
Uppgradera
för att låsa upp premiumdata och exportera till Excel ![]() .
.
| Fil Datum | Källa | Investerare | Typ | Genomsnittligt pris (beräknat) |
Aktier | Δ Aktier (%) |
Rapporterat värde (1000 USD) |
Δ Värde (%) |
Portföljallokering (%) |
|
|---|---|---|---|---|---|---|---|---|---|---|
| 2025-08-12 | 13F | SRS Capital Advisors, Inc. | 14 272 | 680 | ||||||
| 2025-08-13 | 13F | Providence Capital Advisors, LLC | 126 | 6 | ||||||
| 2025-08-04 | 13F | Assetmark, Inc | 67 385 | 2,40 | 3 212 | 3,08 | ||||
| 2025-08-14 | 13F | Atomi Financial Group, Inc. | 13 199 | 1,21 | 629 | 1,94 | ||||
| 2025-07-31 | 13F | Cambridge Investment Research Advisors, Inc. | 0 | −100,00 | 0 | |||||
| 2025-08-07 | 13F | LFA - Lugano Financial Advisors SA | 0 | −100,00 | 0 | |||||
| 2025-08-11 | 13F | Johnson Financial Group, LLC | 14 028 | 0,00 | 669 | 0,60 | ||||
| 2025-08-15 | 13F | Morgan Stanley | 6 538 | −42,14 | 312 | −41,87 | ||||
| 2025-08-07 | 13F | Brio Consultants, LLC | 18 083 | 0,04 | 862 | 0,58 | ||||
| 2025-08-18 | 13F/A | National Bank Of Canada /fi/ | 738 | 0,00 | 35 | 2,94 | ||||
| 2025-08-05 | 13F | Bank of New York Mellon Corp | 84 609 | 1,89 | 4 033 | 2,57 | ||||
| 2025-04-24 | 13F | Trust Co Of Vermont | 0 | −100,00 | 0 | |||||
| 2025-08-14 | 13F | GWM Advisors LLC | 11 137 | 4,97 | 531 | 5,58 | ||||
| 2025-07-18 | 13F | Tanager Wealth Management LLP | 14 690 | 0,00 | 700 | 0,72 | ||||
| 2025-08-12 | 13F | Pathstone Holdings, LLC | 36 187 | 1 725 | ||||||
| 2025-07-21 | 13F | Ameritas Advisory Services, LLC | 2 346 | 112 | ||||||
| 2025-08-13 | 13F | Continuum Advisory, LLC | 0 | −100,00 | 0 | |||||
| 2025-07-24 | 13F | Morton Brown Family Wealth, LLC | 3 527 | 2,17 | 168 | 3,07 | ||||
| 2025-07-22 | 13F | Mascoma Wealth Management LLC | 108 | 0,00 | 5 | 0,00 | ||||
| 2025-07-16 | 13F | Perigon Wealth Management, LLC | 4 353 | 0,00 | 208 | 0,49 | ||||
| 2025-08-05 | 13F | GPS Wealth Strategies Group, LLC | 101 | 1,00 | 5 | 0,00 | ||||
| 2025-08-14 | 13F | Mml Investors Services, Llc | 7 898 | −2,07 | 0 | |||||
| 2025-09-04 | 13F/A | Advisor Group Holdings, Inc. | 13 551 | 20,89 | 645 | 21,47 | ||||
| 2025-08-14 | 13F | Smartleaf Asset Management LLC | 63 | −70,83 | 3 | −80,00 | ||||
| 2025-07-25 | 13F | Envestnet Portfolio Solutions, Inc. | 20 301 | −46,22 | 968 | −45,89 | ||||
| 2025-07-07 | 13F | Trust Co | 1 433 | −1,98 | 68 | −1,45 | ||||
| 2025-07-16 | 13F | Falcon Wealth Planning | 15 399 | 32,50 | 734 | 33,45 | ||||
| 2025-08-13 | 13F | Northwest & Ethical Investments L.P. | 910 | 4,12 | ||||||
| 2025-08-14 | 13F/A | Bank Julius Baer & Co. Ltd, Zurich | 42 700 | 37,10 | 2 036 | 22,08 | ||||
| 2025-08-12 | 13F | Foster Dykema Cabot & Partners, Llc | 4 | 0,00 | 0 | |||||
| 2025-08-12 | 13F | MAI Capital Management | 6 902 | 0,19 | 329 | 0,92 | ||||
| 2025-08-07 | 13F | Sound View Wealth Advisors Group, LLC | 12 614 | 7,60 | 601 | 8,29 | ||||
| 2025-08-05 | 13F | Scarborough Advisors, LLC | 425 | 20 | ||||||
| 2025-07-18 | 13F/A | MJT & Associates Financial Advisory Group, Inc. | 220 | −36,78 | 10 | −37,50 | ||||
| 2025-08-14 | 13F | Raymond James Financial Inc | 68 389 | 107,12 | 3 260 | 108,57 | ||||
| 2025-08-08 | 13F | JFG Wealth Management, LLC | 0 | −100,00 | 0 | |||||
| 2025-08-01 | 13F | Fort Vancouver Investment Management, LLC | 220 | 0,00 | 10 | 0,00 | ||||
| 2025-07-25 | 13F | Atria Wealth Solutions, Inc. | 0 | −100,00 | 0 | |||||
| 2025-08-14 | 13F | Stifel Financial Corp | 5 719 | 28,00 | 273 | 28,91 | ||||
| 2025-08-14 | 13F | Ameriprise Financial Inc | 13 383 | −2,14 | 638 | −1,55 | ||||
| 2025-08-14 | 13F | Federation des caisses Desjardins du Quebec | 1 718 | 4,56 | 82 | 5,19 | ||||
| 2025-08-08 | 13F | Hartland & Co., LLC | 0 | −100,00 | 0 | |||||
| 2025-08-08 | 13F | Creative Planning | 141 099 | 11,51 | 6 726 | 12,25 | ||||
| 2025-07-25 | 13F | LRI Investments, LLC | 3 099 | 0,00 | 148 | 0,68 | ||||
| 2025-08-12 | 13F | Coston, McIsaac & Partners | 40 | 0,00 | 0 | |||||
| 2025-08-12 | 13F | Steward Partners Investment Advisory, Llc | 1 448 | 1,76 | 69 | 2,99 | ||||
| 2025-07-11 | 13F | Westfuller Advisors, LLC | 8 101 | 0,19 | 386 | 1,05 | ||||
| 2025-08-13 | 13F | Lido Advisors, LLC | 7 283 | −16,82 | 347 | −16,18 | ||||
| 2025-08-11 | 13F | HighTower Advisors, LLC | 20 344 | −23,46 | 970 | −22,97 | ||||
| 2025-07-24 | 13F | Financial Connections Group, Inc. | 1 034 | 0 | ||||||
| 2025-07-23 | 13F | Sachetta, LLC | 2 572 | 7,30 | 123 | 7,96 | ||||
| 2025-07-25 | 13F | PrairieView Partners, LLC | 14 915 | 3,15 | 1 | |||||
| 2025-07-24 | 13F | IFP Advisors, Inc | 307 | −1,29 | 15 | 0,00 | ||||
| 2025-08-28 | 13F/A | Lavaca Capital Llc | Call | 0 | −100,00 | 0 | −100,00 | |||
| 2025-07-09 | 13F | Fermata Advisors, LLC | 0 | −100,00 | 0 | |||||
| 2025-08-08 | 13F | Laurel Wealth Planning LLC | 63 416 | 6,94 | 3 023 | 7,66 | ||||
| 2025-08-26 | 13F/A | Thrivent Financial For Lutherans | 7 045 | 0 | ||||||
| 2025-08-13 | 13F | Twin Peaks Wealth Advisors, LLC | 97 | 5 | ||||||
| 2025-08-14 | 13F | Mercer Global Advisors Inc /adv | 747 624 | 14,42 | 35 639 | 15,17 | ||||
| 2025-08-14 | 13F | Royal Bank Of Canada | 224 446 | 3,27 | 10 699 | 3,94 | ||||
| 2025-08-01 | 13F | Equita Financial Network, Inc. | 12 408 | 46,48 | 591 | 47,38 | ||||
| 2025-04-22 | 13F | Synergy Financial Management, LLC | 0 | −100,00 | 0 | |||||
| 2025-08-13 | 13F | KilterHowling LLC | 5 529 | 0,36 | 264 | 1,94 | ||||
| 2025-08-14 | 13F | Susquehanna International Group, Llp | 0 | −100,00 | 0 | |||||
| 2025-08-14 | 13F | Fmr Llc | 43 | 2 | ||||||
| 2025-08-13 | 13F | Ally Invest Advisors Inc. | 0 | −100,00 | 0 | |||||
| 2025-08-07 | 13F | Kestra Private Wealth Services, Llc | 9 373 | 0,56 | 447 | 1,13 | ||||
| 2025-07-07 | 13F | Shotwell Rutter Baer Inc | 15 693 | −0,98 | 744 | −0,67 | ||||
| 2025-05-08 | 13F | Harbour Investments, Inc. | 0 | −100,00 | 0 | |||||
| 2025-08-12 | 13F | Proequities, Inc. | 0 | 0 | ||||||
| 2025-07-08 | 13F | Parallel Advisors, LLC | 2 378 | 0,00 | 113 | 0,89 | ||||
| 2025-08-11 | 13F | Birchbrook, Inc. | 466 | −2,71 | 22 | 0,00 | ||||
| 2025-04-25 | 13F | JNBA Financial Advisors | 0 | −100,00 | 0 | |||||
| 2025-07-18 | 13F | Bartlett & Co. Wealth Management Llc | 115 | 0,00 | 5 | 0,00 | ||||
| 2025-08-14 | 13F | Bank Of America Corp /de/ | 299 337 | 16,11 | 14 269 | 16,87 | ||||
| 2025-08-14 | 13F | Aprio Wealth Management, LLC | 14 051 | 3,94 | 670 | 4,53 | ||||
| 2025-08-14 | 13F | Modern Wealth Management, LLC | 30 718 | 78,71 | 1 464 | 79,85 | ||||
| 2025-04-24 | 13F | Elevated Capital Advisors, LLC | 0 | −100,00 | 0 | |||||
| 2025-08-13 | 13F | Jones Financial Companies Lllp | 4 554 | 17,83 | 216 | 18,68 | ||||
| 2025-08-14 | 13F | Wells Fargo & Company/mn | 34 825 | 17 758,97 | 1 660 | 18 344,44 | ||||
| 2025-04-22 | 13F | PFG Investments, LLC | 0 | −100,00 | 0 | |||||
| 2025-08-05 | 13F | Dunhill Financial, LLC | 84 | 0,00 | 4 | 33,33 | ||||
| 2025-08-05 | 13F | Bank Of Montreal /can/ | 3 332 | 0,00 | 159 | 0,64 | ||||
| 2025-07-17 | 13F | XY Planning Network, Inc. | 5 386 | 2,73 | 257 | 3,23 | ||||
| 2025-07-09 | 13F | Archer Investment Management, LLC | 11 149 | 0,00 | 531 | 0,57 | ||||
| 2025-07-15 | 13F | Carr Financial Group Corp | 0 | −100,00 | 0 | |||||
| 2025-08-12 | 13F | Ameritas Investment Partners, Inc. | 9 469 | 4,05 | 451 | 4,88 | ||||
| 2025-08-14 | 13F | UBS Group AG | 71 932 | −3,44 | 3 429 | −2,81 | ||||
| 2025-07-08 | 13F | First National Corp /ma/ /adv | 5 604 | 3,09 | 267 | 3,89 | ||||
| 2025-05-15 | 13F | Tower Research Capital LLC (TRC) | 0 | −100,00 | 0 | |||||
| 2025-07-14 | 13F | Pacifica Partners Inc. | 417 | 0,00 | 20 | 0,00 | ||||
| 2025-07-16 | 13F | Signature Resources Capital Management, LLC | 73 | 114,71 | 3 | 200,00 | ||||
| 2025-08-05 | 13F | Plante Moran Financial Advisors, LLC | 65 | 3 | ||||||
| 2025-07-23 | 13F | 1 North Wealth Services Llc | 85 | 0,00 | 4 | 0,00 | ||||
| 2025-08-11 | 13F | Citigroup Inc | 9 943 | −10,06 | 474 | −9,56 | ||||
| 2025-08-08 | 13F | Empower Advisory Group, LLC | 1 062 274 | 1,13 | 50 639 | 1,79 | ||||
| 2025-08-08 | 13F | Emerald Investment Partners, Llc | 2 359 | −0,42 | 112 | 0,00 | ||||
| 2025-08-12 | 13F | LPL Financial LLC | 141 492 | 18,25 | 6 745 | 19,03 | ||||
| 2025-08-08 | 13F | Omega Financial Group, LLC | 18 062 | 1,99 | 861 | 2,74 | ||||
| 2025-07-25 | 13F | Richardson Financial Services Inc. | 785 | 0,00 | 37 | 0,00 | ||||
| 2025-08-11 | 13F | CBIZ Investment Advisory Services, LLC | 1 080 | 1,12 | 51 | 2,00 | ||||
| 2025-08-08 | 13F | Smithfield Trust Co | 920 | 0,00 | 0 | |||||
| 2025-07-29 | 13F | Private Wealth Management Group, LLC | 24 969 | −0,99 | 1 190 | −0,34 | ||||
| 2025-08-14 | 13F | Jane Street Group, Llc | 0 | −100,00 | 0 | |||||
| 2025-04-17 | 13F | Stewardship Advisors, LLC | 0 | −100,00 | 0 | |||||
| 2025-07-11 | 13F | Farther Finance Advisors, LLC | 0 | −100,00 | 0 | |||||
| 2025-07-09 | 13F | Dynamic Advisor Solutions LLC | 16 959 | 3,86 | 808 | 4,53 | ||||
| 2025-08-08 | 13F | Cetera Investment Advisers | 51 807 | −43,88 | 2 470 | −43,53 | ||||
| 2025-07-31 | 13F | Wealthfront Advisers Llc | 24 602 | 26,35 | 1 173 | 27,11 | ||||
| 2025-05-02 | 13F | Invera Wealth Advisors, LLC | 22 758 | 12,07 | 1 078 | 13,85 | ||||
| 2025-07-28 | 13F | DORVAL Corp | 5 738 | 0,00 | 274 | 0,37 | ||||
| 2025-08-08 | 13F | Francis Financial, Inc. | 253 244 | −31,51 | 12 072 | −31,06 | ||||
| 2025-08-12 | 13F | Archer Investment Corp | 463 | 0,00 | 22 | 4,76 | ||||
| 2025-08-12 | 13F | CIBC Private Wealth Group, LLC | 4 070 | 0,00 | 194 | 2,65 | ||||
| 2025-08-06 | 13F | Walkner Condon Financial Advisors LLC | 20 600 | −12,13 | 982 | −11,53 | ||||
| 2025-04-18 | 13F | Halbert Hargrove Global Advisors, Llc | 0 | −100,00 | 0 | −100,00 | ||||
| 2025-07-30 | 13F | Financial Perspectives, Inc | 355 | 0,85 | 17 | 0,00 | ||||
| 2025-08-11 | 13F | Plum Street Advisors, LLC | 29 569 | −4,78 | 1 410 | −4,15 | ||||
| 2025-08-14 | 13F | Colony Group, LLC | 4 238 | 202 | ||||||
| 2025-08-05 | 13F | Blue Barn Wealth, LLC | 21 188 | 3,74 | 1 010 | 4,45 | ||||
| 2025-08-08 | 13F | Larson Financial Group LLC | 76 | 72,73 | 4 | 50,00 | ||||
| 2025-08-08 | 13F | Better Money Decisions, LLC | 16 112 | 2,30 | 768 | 3,09 | ||||
| 2025-08-15 | 13F | Kestra Advisory Services, LLC | 8 025 | 30,76 | 383 | 31,72 | ||||
| 2025-08-14 | 13F | Betterment LLC | 1 310 676 | −0,82 | 62 | 0,00 | ||||
| 2025-08-12 | 13F | Jpmorgan Chase & Co | 0 | −100,00 | 0 | |||||
| 2025-07-21 | 13F | Cliftonlarsonallen Wealth Advisors, Llc | 39 105 | −1,08 | 1 864 | −0,43 | ||||
| 2025-05-14 | 13F | Hsbc Holdings Plc | 0 | −100,00 | 0 | |||||
| 2025-08-14 | 13F | Clarity Asset Management, Inc. | 1 489 | 0,13 | 71 | 1,43 | ||||
| 2025-07-25 | 13F | Cwm, Llc | 1 495 | 0,20 | 0 | |||||
| 2025-08-11 | 13F | Principal Securities, Inc. | 8 668 | 25,44 | 413 | 28,26 | ||||
| 2025-08-13 | 13F | Congress Wealth Management LLC / DE / | 5 423 | 21,84 | 259 | 22,86 | ||||
| 2025-07-23 | 13F | Vontobel Holding Ltd. | 11 786 | 0,00 | 562 | 0,54 | ||||
| 2025-08-01 | 13F | Envestnet Asset Management Inc | 659 577 | 3,58 | 31 442 | 4,26 | ||||
| 2025-05-02 | 13F | BlackRock, Inc. | 0 | −100,00 | 0 | |||||
| 2025-08-15 | 13F | WFA of San Diego, LLC | 1 341 | 0,00 | 64 | −1,56 | ||||
| 2025-08-07 | 13F | Allworth Financial LP | 119 | 0,00 | 6 | 0,00 | ||||
| 2025-08-06 | 13F | Commonwealth Equity Services, Llc | 35 426 | 12,39 | 2 | 0,00 | ||||
| 2025-07-31 | 13F | Cardinal Point Capital Management, ULC | 12 154 | 37,50 | 579 | 38,52 | ||||
| 2025-08-12 | 13F | Seeds Investor Llc | 112 730 | −4,96 | 5 374 | −4,34 | ||||
| 2025-08-12 | 13F | Franklin Resources Inc | 18 354 | 1,07 | 875 | 1,63 | ||||
| 2025-04-21 | 13F | Nelson, Van Denburg & Campbell Wealth Management Group, LLC | 0 | −100,00 | 0 | |||||
| 2025-08-14 | 13F | Citadel Advisors Llc | 0 | −100,00 | 0 |