Grundläggande statistik
| Institutionella ägare | 96 total, 94 long only, 1 short only, 1 long/short - change of −6,80% MRQ |
| Genomsnittlig portföljallokering | 0.0453 % - change of −4,90% MRQ |
| Institutionella aktier (lång) | 748 561 (ex 13D/G) - change of −0,08MM shares −9,69% MRQ |
| Institutionellt värde (lång) | $ 109 696 USD ($1000) |
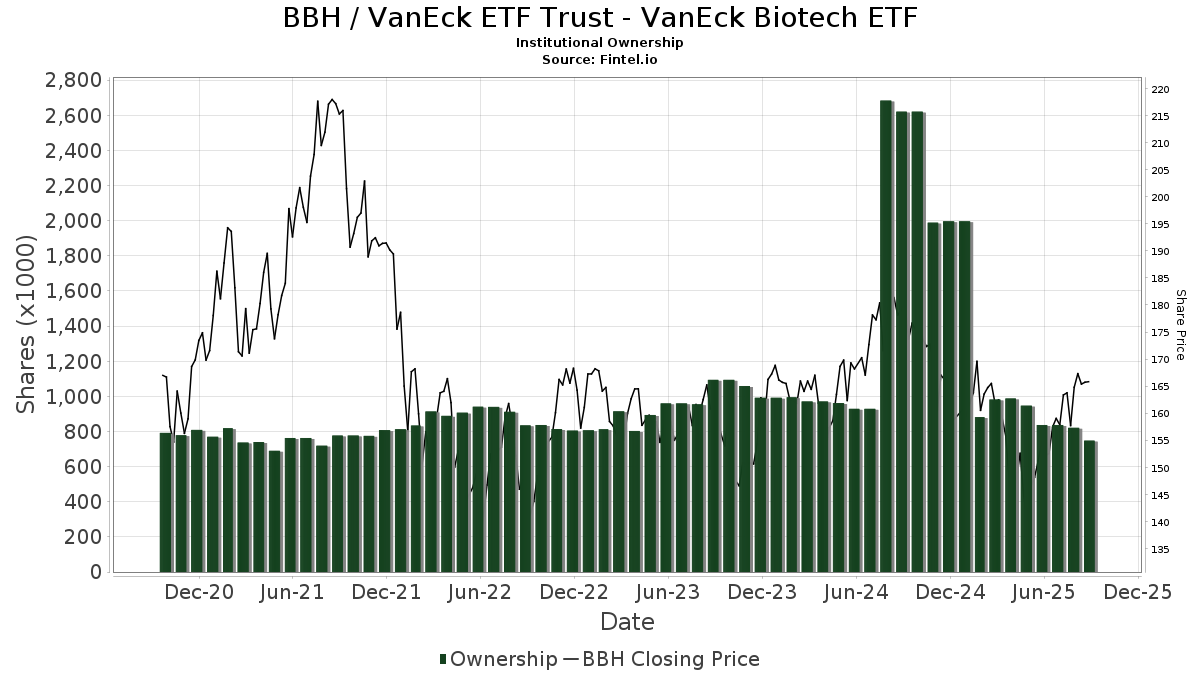
Institutionellt ägande och aktieägare
VanEck ETF Trust - VanEck Biotech ETF (US:BBH) har 96 Institutionella ägare och aktieägare som har lämnat in 13D/G- eller 13F-formulär till Securities Exchange Commission (SEC). Dessa institut innehar totalt 748,561 aktier. Största aktieägare inkluderar Goldman Sachs Group Inc, Miller Investment Management, LP, Raymond James Financial Inc, TD Waterhouse Canada Inc., Bank Of America Corp /de/, Morgan Stanley, Wells Fargo & Company/mn, LPL Financial LLC, UBS Group AG, and Royal Bank Of Canada .
VanEck ETF Trust - VanEck Biotech ETF (NasdaqGM:BBH) Institutionell ägarstruktur visar institutioners och fonders nuvarande positioner i företaget, samt de senaste förändringarna i positionernas storlek. Större aktieägare kan vara enskilda investerare, fonder, hedgefonder eller institutioner. Bilaga 13D visar att investeraren äger (eller ägde) mer än 5% av företaget och avser (eller avsåg) att aktivt eftersträva en förändring av affärsstrategin. Schedule 13G indikerar en passiv investering på över 5%.
The share price as of September 8, 2025 is 167,92 / share. Previously, on September 9, 2024, the share price was 176,72 / share. This represents a decline of 4,98% over that period.
Fondsentimentets poäng
Fondsentimentet poängen(fka Ägarackumulation-poäng) visar vilka aktier som är mest köpta av fonder. Det är resultatet av en sofistikerad kvantitativ flerfaktormodell som identifierar företag med de högsta nivåerna av institutionell ackumulering. Poängsättningsmodellen använder en kombination av den totala ökningen av redovisade ägare, förändringarna i portföljallokeringarna för dessa ägare och andra mått. Siffran sträcker sig från 0 till 100, där högre siffror indikerar en högre nivå av ackumulering i förhållande till sina konkurrenter, och 50 är genomsnittet.
Uppdateringsfrekvens: Dagligen
Se Ownership Explorer, som innehåller en lista över de högst rankade företagen.
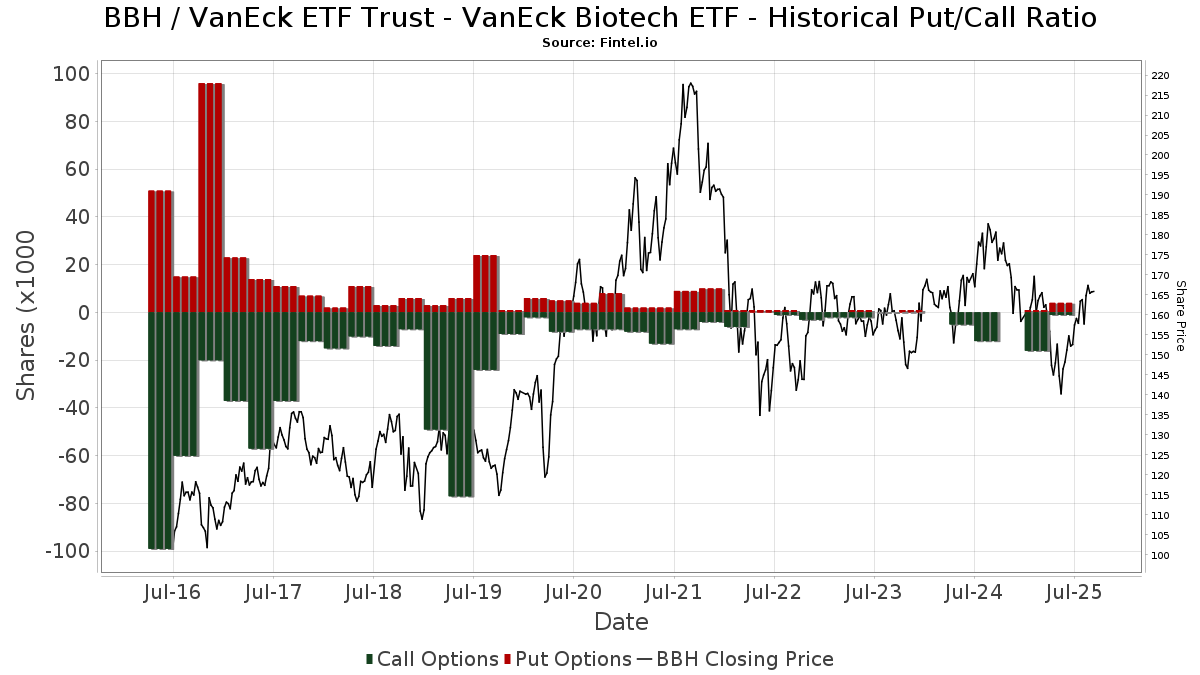
Institutionell sälj/köp-kvot
Förutom att rapportera vanliga eget kapital- och skuldemissioner måste institutioner med mer än 100MM tillgångar under förvaltning också avslöja sina innehav av sälj- och köpoptioner. Eftersom säljoptioner i allmänhet indikerar ett negativt sentiment och köpoptioner indikerar ett positivt sentiment, kan vi få en uppfattning om det övergripande institutionella sentimentet genom att plotta förhållandet mellan säljoptioner och köpoptioner. Diagrammet till höger visar det historiska förhållandet mellan sälj- och köpoptioner för detta instrument.
Genom att använda sälj/köp-kvoten som en indikator på aktieägarnas sentiment undviker man en av de största bristerna med att använda det totala institutionella ägandet, nämligen att en betydande del av de förvaltade tillgångarna investeras passivt för att följa index. Passivt förvaltade fonder köper vanligtvis inte optioner, så indikatorn för sälj/köp-kvoten ger en bättre bild av stämningen i aktivt förvaltade fonder.
13F- och NPORT-arkiveringar
Detaljer om 13F-arkiveringar är gratis. Detaljer om NP-arkiveringar kräver ett premiummedlemskap. Gröna rader indikerar nya positioner. Röda rader indikerar stängda positioner. Klicka på länk symbolen för att se hela transaktionshistoriken.
Uppgradera
för att låsa upp premiumdata och exportera till Excel ![]() .
.
| Fil Datum | Källa | Investerare | Typ | Genomsnittligt pris (beräknat) |
Aktier | Δ Aktier (%) |
Rapporterat värde (1000 USD) |
Δ Värde (%) |
Portföljallokering (%) |
|
|---|---|---|---|---|---|---|---|---|---|---|
| 2025-08-14 | 13F | UBS Group AG | 21 223 | −23,82 | 3 253 | −25,78 | ||||
| 2025-07-15 | 13F | North Star Investment Management Corp. | 373 | 0,00 | 57 | −1,72 | ||||
| 2025-08-01 | 13F | Belvedere Trading LLC | Call | 0 | −100,00 | 0 | −100,00 | |||
| 2025-08-08 | 13F | Larson Financial Group LLC | 70 | 11 | ||||||
| 2025-05-20 | 13F/A | Colony Group, LLC | 0 | −100,00 | 0 | −100,00 | ||||
| 2025-08-13 | 13F | Continuum Advisory, LLC | 0 | −100,00 | 0 | −100,00 | ||||
| 2025-07-31 | 13F | Wealthfront Advisers Llc | 5 945 | −18,02 | 911 | −20,09 | ||||
| 2025-07-21 | 13F | HighMark Wealth Management LLC | 80 | 0,00 | 12 | 0,00 | ||||
| 2025-08-13 | 13F | Jones Financial Companies Lllp | 2 570 | −9,35 | 393 | −12,69 | ||||
| 2025-07-14 | 13F | Pacifica Partners Inc. | 25 | 0,00 | 4 | 0,00 | ||||
| 2025-08-14 | 13F | Peapack Gladstone Financial Corp | 7 438 | −8,79 | 1 | 0,00 | ||||
| 2025-08-15 | 13F | CI Private Wealth, LLC | 13 290 | 63,47 | 2 037 | 59,27 | ||||
| 2025-07-31 | 13F | Conservest Capital Advisors, Inc. | 15 713 | −9,85 | 2 408 | −12,18 | ||||
| 2025-08-05 | 13F | Bank Of Montreal /can/ | 287 | 0,00 | 44 | −4,44 | ||||
| 2025-07-29 | 13F | Aspiriant, Llc | 3 727 | −12,04 | 571 | −14,26 | ||||
| 2025-07-30 | 13F | Whittier Trust Co | 100 | 0,00 | 15 | 0,00 | ||||
| 2025-08-07 | 13F | Allworth Financial LP | 120 | 0,00 | 18 | 0,00 | ||||
| 2025-05-13 | 13F | Tocqueville Asset Management L.p. | 0 | −100,00 | 0 | −100,00 | ||||
| 2025-08-18 | 13F | Tyler-Stone Wealth Management | 1 308 | 0,00 | 201 | −2,44 | ||||
| 2025-08-14 | 13F | Stifel Financial Corp | 6 756 | −0,73 | 1 036 | −3,27 | ||||
| 2025-08-14 | 13F | Goldman Sachs Group Inc | 109 971 | 3,57 | 16 856 | 0,90 | ||||
| 2025-04-29 | 13F | Truist Financial Corp | 0 | −100,00 | 0 | |||||
| 2025-07-28 | 13F | Harbour Investments, Inc. | 235 | 0,00 | 36 | 0,00 | ||||
| 2025-07-30 | 13F | Financial Perspectives, Inc | 88 | 0,00 | 13 | 0,00 | ||||
| 2025-08-12 | 13F | MAI Capital Management | 265 | 0,00 | 41 | −2,44 | ||||
| 2025-08-01 | 13F | Strategic Financial Services, Inc, | 0 | −100,00 | 0 | −100,00 | ||||
| 2025-07-25 | 13F | NorthRock Partners, LLC | 756 | 0,00 | 116 | −2,54 | ||||
| 2025-08-15 | 13F | Tower Research Capital LLC (TRC) | 2 997 | −28,44 | 459 | −30,24 | ||||
| 2025-09-04 | 13F/A | Advisor Group Holdings, Inc. | 1 465 | 87,10 | 225 | 82,11 | ||||
| 2025-05-15 | 13F | Integrated Wealth Concepts LLC | 0 | −100,00 | 0 | |||||
| 2025-07-28 | 13F | BRYN MAWR TRUST Co | 1 032 | 1,78 | 158 | −0,63 | ||||
| 2025-05-05 | 13F | Private Advisor Group, LLC | 0 | −100,00 | 0 | |||||
| 2025-08-13 | 13F | Truvestments Capital Llc | 250 | 0,00 | 38 | −2,56 | ||||
| 2025-08-08 | 13F | Cetera Investment Advisers | 2 031 | −34,36 | 311 | −36,01 | ||||
| 2025-07-25 | 13F | Cwm, Llc | 225 | 0,00 | 0 | |||||
| 2025-08-13 | 13F | Navis Wealth Advisors, LLC | 3 978 | 0,00 | 610 | −2,56 | ||||
| 2025-08-11 | 13F | Banque Cantonale Vaudoise | 1 206 | 0 | ||||||
| 2025-07-21 | 13F | Ameritas Advisory Services, LLC | 371 | 57 | ||||||
| 2025-08-12 | 13F | Proequities, Inc. | 0 | 0 | ||||||
| 2025-04-23 | 13F | Oppenheimer & Co Inc | 0 | −100,00 | 0 | |||||
| 2025-08-18 | 13F | Hollencrest Capital Management | 70 | 0,00 | 11 | −9,09 | ||||
| 2025-08-12 | 13F | Coldstream Capital Management Inc | 0 | −100,00 | 0 | |||||
| 2025-04-29 | 13F | Envestnet Asset Management Inc | 0 | −100,00 | 0 | |||||
| 2025-08-04 | 13F | Assetmark, Inc | 0 | −100,00 | 0 | |||||
| 2025-08-06 | 13F | Commonwealth Equity Services, Llc | 10 758 | −62,40 | 2 | −75,00 | ||||
| 2025-08-14 | 13F | Wells Fargo & Company/mn | 27 471 | −55,63 | 4 211 | −56,78 | ||||
| 2025-08-12 | 13F | Manchester Capital Management LLC | 300 | 0,00 | 46 | −4,26 | ||||
| 2025-05-12 | 13F | Independent Advisor Alliance | 0 | −100,00 | 0 | |||||
| 2025-08-14 | 13F | Bank Of America Corp /de/ | 52 466 | 17,72 | 8 042 | 14,71 | ||||
| 2025-08-11 | 13F | Principal Securities, Inc. | 72 | 0,00 | 11 | 0,00 | ||||
| 2025-08-14 | 13F | Boston Private Wealth Llc | 0 | −100,00 | 0 | |||||
| 2025-07-18 | 13F | Founders Capital Management | 100 | 0,00 | 15 | 0,00 | ||||
| 2025-08-18 | 13F/A | National Bank Of Canada /fi/ | 25 | 0,00 | 4 | 0,00 | ||||
| 2025-08-14 | 13F | GWM Advisors LLC | 39 | 0,00 | 6 | −16,67 | ||||
| 2025-07-11 | 13F | Farther Finance Advisors, LLC | 121 | 0,00 | 19 | 0,00 | ||||
| 2025-08-15 | 13F | Morgan Stanley | 31 311 | −59,32 | 4 799 | −60,37 | ||||
| 2025-08-11 | 13F | Citigroup Inc | 5 482 | 840 | ||||||
| 2025-08-14 | 13F | Aspen Grove Capital, LLC | 9 978 | 0,00 | 1 529 | −2,55 | ||||
| 2025-08-12 | 13F | BlackRock, Inc. | 70 | 11 | ||||||
| 2025-07-18 | 13F | Institute for Wealth Management, LLC. | 7 581 | 0,00 | 1 162 | −2,52 | ||||
| 2025-08-12 | 13F | Ameritas Investment Partners, Inc. | 30 | 0,00 | 5 | 0,00 | ||||
| 2025-08-08 | 13F | Altfest L J & Co Inc | 8 530 | 11,34 | 1 307 | 8,46 | ||||
| 2025-08-07 | 13F | Commerce Bank | 0 | −100,00 | 0 | |||||
| 2025-08-12 | 13F | CIBC Private Wealth Group, LLC | 4 958 | 0,00 | 760 | 9,37 | ||||
| 2025-08-05 | 13F | Simplex Trading, Llc | 0 | −100,00 | 0 | |||||
| 2025-05-15 | 13F | Edmond De Rothschild Holding S.a. | 0 | −100,00 | 0 | |||||
| 2025-07-15 | 13F | EWG Elevate Inc. | 2 371 | 363 | ||||||
| 2025-07-24 | 13F | Us Bancorp \de\ | 148 | 0,00 | 23 | −4,35 | ||||
| 2025-08-12 | 13F | Global Retirement Partners, LLC | 124 | 0,00 | 19 | −5,26 | ||||
| 2025-07-23 | 13F | 1 North Wealth Services Llc | 78 | 0,00 | 12 | −8,33 | ||||
| 2025-08-06 | 13F | Miller Investment Management, LP | 81 432 | −11,30 | 12 482 | −13,58 | ||||
| 2025-08-01 | 13F | Belvedere Trading LLC | Put | 1 800 | 276 | |||||
| 2025-07-21 | 13F | Consolidated Investment Group LLC | 0 | −100,00 | 0 | |||||
| 2025-08-14 | 13F | CoreCap Advisors, LLC | 190 | 0,00 | 29 | 0,00 | ||||
| 2025-08-12 | 13F | Jpmorgan Chase & Co | 4 296 | −41,47 | 658 | −42,98 | ||||
| 2025-05-09 | 13F | Commonwealth Retirement Investments LLC | 0 | −100,00 | 0 | |||||
| 2025-08-08 | 13F | SBI Securities Co., Ltd. | 432 | 0,23 | 66 | −1,49 | ||||
| 2025-05-14 | 13F | Flow Traders U.s. Llc | 0 | −100,00 | 0 | |||||
| 2025-08-14 | 13F | Jane Street Group, Llc | 0 | −100,00 | 0 | |||||
| 2025-08-15 | 13F | Kestra Advisory Services, LLC | 3 528 | −2,84 | 541 | −5,43 | ||||
| 2025-08-13 | 13F | Blue Fin Capital, Inc. | 1 570 | 0,00 | 241 | −2,44 | ||||
| 2025-07-17 | 13F | Janney Montgomery Scott LLC | 3 065 | 0,00 | 0 | |||||
| 2025-08-14 | 13F | Paragon Private Wealth Management, LLC | 4 140 | 635 | ||||||
| 2025-08-11 | 13F | HighTower Advisors, LLC | 9 622 | −2,39 | 1 475 | −4,90 | ||||
| 2025-05-19 | 13F/A | Kovitz Investment Group Partners, LLC | 0 | −100,00 | 0 | −100,00 | ||||
| 2025-08-01 | 13F | Red Lighthouse Investment Management, Llc | 0 | −100,00 | 0 | |||||
| 2025-07-31 | 13F | United Community Bank | 0 | −100,00 | 0 | |||||
| 2025-08-11 | 13F | Tidemark, LLC | 207 | 0,00 | 32 | −3,12 | ||||
| 2025-09-04 | 13F | ZynergyRetirementPlanningLLC | 0 | −100,00 | 0 | |||||
| 2025-08-11 | 13F | TD Waterhouse Canada Inc. | 64 736 | 0,04 | 10 050 | 0,89 | ||||
| 2025-05-15 | 13F | Two Sigma Securities, Llc | 0 | −100,00 | 0 | −100,00 | ||||
| 2025-08-14 | 13F/A | Rockefeller Capital Management L.P. | 11 811 | 2,55 | 1 811 | −0,11 | ||||
| 2025-08-14 | 13F | Ameriprise Financial Inc | 7 424 | −2,26 | 1 138 | −4,85 | ||||
| 2025-07-24 | 13F | Blair William & Co/il | 425 | 0,00 | 65 | −1,52 | ||||
| 2025-05-15 | 13F | Two Sigma Investments, Lp | 0 | −100,00 | 0 | |||||
| 2025-08-12 | 13F | LPL Financial LLC | 22 295 | −7,78 | 3 417 | −10,15 | ||||
| 2025-07-17 | 13F | Coastline Trust Co | 190 | 0,00 | 29 | 0,00 | ||||
| 2025-08-13 | 13F | Cerity Partners LLC | 5 795 | 0,75 | 888 | −1,77 | ||||
| 2025-07-30 | 13F | Pacific Sun Financial Corp | 4 393 | −8,92 | 673 | −11,21 | ||||
| 2025-04-28 | 13F | Strategic Financial Concepts, LLC | 0 | −100,00 | 0 | −100,00 | ||||
| 2025-04-25 | 13F | Westside Investment Management, Inc. | 0 | −100,00 | 0 | −100,00 | ||||
| 2025-08-14 | 13F | Royal Bank Of Canada | 19 002 | 5,44 | 2 913 | 2,75 | ||||
| 2025-07-10 | 13F | Wealth Enhancement Advisory Services, Llc | 2 270 | 0,00 | 358 | 0,00 | ||||
| 2025-08-14 | 13F | Raymond James Financial Inc | 67 940 | 245,87 | 10 414 | 236,99 | ||||
| 2025-08-04 | 13F | Flagship Harbor Advisors, Llc | 2 460 | 12,90 | 377 | 9,94 | ||||
| 2025-08-14 | 13F | CIBC World Markets Inc. | 0 | −100,00 | 0 | |||||
| 2025-08-14 | 13F | Cardiff Park Advisors, Llc | 35 | 0,00 | 5 | 0,00 | ||||
| 2025-07-11 | 13F/A | Umb Bank N A/mo | 900 | 0,00 | 138 | −2,84 | ||||
| 2025-08-06 | 13F | Texas Yale Capital Corp. | 2 085 | 0,00 | 320 | −2,74 | ||||
| 2025-07-30 | 13F | Bleakley Financial Group, LLC | 18 980 | 2 909 | ||||||
| 2025-08-19 | 13F | Anchor Investment Management, LLC | 160 | 0,00 | 25 | −4,00 | ||||
| 2025-07-24 | 13F | Robertson Stephens Wealth Management, LLC | 1 402 | 3,70 | 215 | 0,94 | ||||
| 2025-08-12 | 13F | Boston Research & Management Inc | 10 812 | −4,41 | 2 | 0,00 | ||||
| 2025-08-11 | 13F | FSA Wealth Management LLC | 305 | 0,00 | 47 | −2,13 | ||||
| 2025-08-14 | 13F | Comerica Bank | 675 | 0,00 | 103 | −2,83 | ||||
| 2025-08-07 | 13F | LFA - Lugano Financial Advisors SA | 310 | 0,00 | 48 | −2,08 | ||||
| 2025-08-12 | 13F | Atlas Capital Advisors Llc | 5 700 | 0,00 | 874 | −2,57 | ||||
| 2025-08-08 | 13F | Creative Planning | 1 376 | −21,06 | 211 | −23,36 | ||||
| 2025-08-14 | 13F | Susquehanna International Group, Llp | Put | 2 400 | 84,62 | 368 | 79,90 | |||
| 2025-08-14 | 13F | Susquehanna International Group, Llp | 4 943 | −12,61 | 758 | −14,85 | ||||
| 2025-08-08 | 13F | Pnc Financial Services Group, Inc. | 4 000 | 0,00 | 613 | −2,54 | ||||
| 2025-08-14 | 13F | Williams Jones Wealth Management, LLC. | 2 200 | 0,00 | 337 | −2,60 | ||||
| 2025-07-24 | 13F | Cyndeo Wealth Partners, LLC | 0 | −100,00 | 0 | |||||
| 2025-08-13 | 13F | Northwestern Mutual Wealth Management Co | 1 508 | −93,26 | 231 | −93,43 | ||||
| 2025-08-14 | 13F | Fmr Llc | 332 | 0,91 | 51 | −1,96 | ||||
| 2025-08-14 | 13F | Susquehanna International Group, Llp | Call | 1 800 | −86,76 | 276 | −87,14 | |||
| 2025-08-14 | 13F | Citadel Advisors Llc | 8 160 | 223,55 | 1 251 | 215,66 | ||||
| 2025-08-14 | 13F | Qube Research & Technologies Ltd | 24 | 0,00 | 4 | 0,00 | ||||
| 2025-07-15 | 13F | Mather Group, Llc. | 0 | −100,00 | 0 | |||||
| 2025-07-24 | 13F | Ronald Blue Trust, Inc. | 43 | 7 | ||||||
| 2025-07-09 | 13F | Hummer Financial Advisory Services Inc | 1 410 | 0,00 | 216 | −2,26 |