Grundläggande statistik
| Institutionella aktier (lång) | 218 500 244 - 71,58% (ex 13D/G) - change of −37,31MM shares −14,59% MRQ |
| Institutionellt värde (lång) | $ 1 702 789 USD ($1000) |
Institutionellt ägande och aktieägare
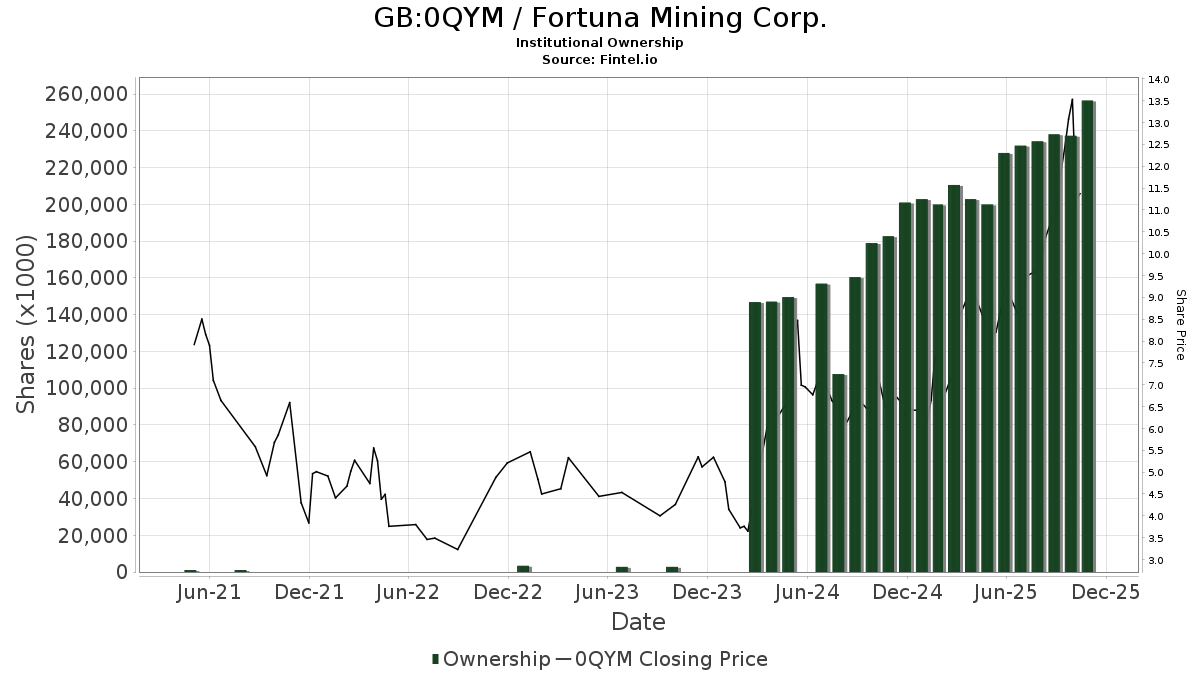
Fortuna Mining Corp. (GB:0QYM) har 246 Institutionella ägare och aktieägare som har lämnat in 13D/G- eller 13F-formulär till Securities Exchange Commission (SEC). Dessa institut innehar totalt 218,500,244 aktier. Största aktieägare inkluderar Van Eck Associates Corp, Arrowstreet Capital, Limited Partnership, MIRAE ASSET GLOBAL ETFS HOLDINGS Ltd., Acadian Asset Management Llc, Dimensional Fund Advisors Lp, Toroso Investments, LLC, SIL - Global X Silver Miners ETF, Morgan Stanley, American Century Companies Inc, and Vanguard Group Inc .
Fortuna Mining Corp. (LSE:0QYM) Institutionell ägarstruktur visar institutioners och fonders nuvarande positioner i företaget, samt de senaste förändringarna i positionernas storlek. Större aktieägare kan vara enskilda investerare, fonder, hedgefonder eller institutioner. Bilaga 13D visar att investeraren äger (eller ägde) mer än 5% av företaget och avser (eller avsåg) att aktivt eftersträva en förändring av affärsstrategin. Schedule 13G indikerar en passiv investering på över 5%.
The share price as of March 24, 2026 is 12,68 / share. Previously, on March 28, 2025, the share price was 8,89 / share. This represents an increase of 42,63% over that period.
Fondsentimentets poäng
Fondsentimentet poängen(fka Ägarackumulation-poäng) visar vilka aktier som är mest köpta av fonder. Det är resultatet av en sofistikerad kvantitativ flerfaktormodell som identifierar företag med de högsta nivåerna av institutionell ackumulering. Poängsättningsmodellen använder en kombination av den totala ökningen av redovisade ägare, förändringarna i portföljallokeringarna för dessa ägare och andra mått. Siffran sträcker sig från 0 till 100, där högre siffror indikerar en högre nivå av ackumulering i förhållande till sina konkurrenter, och 50 är genomsnittet.
Uppdateringsfrekvens: Dagligen
Se Ownership Explorer, som innehåller en lista över de högst rankade företagen.
AI+ Ask Fintel’s AI assistant about Fortuna Mining Corp..
Select a question to share a public post with an AI-crafted answer.
Thinking of good questions…
13F- och NPORT-arkiveringar
Detaljer om 13F-arkiveringar är gratis. Detaljer om NP-arkiveringar kräver ett premiummedlemskap. Gröna rader indikerar nya positioner. Röda rader indikerar stängda positioner. Klicka på länk symbolen för att se hela transaktionshistoriken.
Uppgradera
för att låsa upp premiumdata och exportera till Excel ![]() .
.
| Fil Datum | Källa | Investerare | Typ | Genomsnittligt pris (beräknat) |
Aktier | Δ Aktier (%) |
Rapporterat värde (1000 USD) |
Δ Värde (%) |
Portföljallokering (%) |
|
|---|---|---|---|---|---|---|---|---|---|---|
| 2026-02-11 | 13F | Deutsche Bank Ag\ | 1 243 414 | 28,70 | 12 198 | 40,91 | ||||
| 2026-02-17 | 13F | Balyasny Asset Management Llc | 721 721 | 52,89 | 7 080 | 67,42 | ||||
| 2026-02-11 | 13F | Picton Mahoney Asset Management | 157 668 | −27,95 | 1 547 | 154 600,00 | ||||
| 2026-02-11 | 13F | Jpmorgan Chase & Co | 144 772 | −69,57 | 1 420 | −66,69 | ||||
| 2026-02-13 | 13F | Global Strategic Management Inc | 941 349 | 9 | ||||||
| 2026-02-10 | 13F | Jupiter Asset Management Ltd | 231 361 | 276,61 | 2 270 | 312,73 | ||||
| 2026-02-12 | 13F | Aristides Capital LLC | 0 | −100,00 | 0 | |||||
| 2026-02-13 | 13F | Van Eck Associates Corp | 24 185 050 | −17,40 | 237 | −9,54 | ||||
| 2026-02-13 | 13F | Walleye Capital LLC | Put | 126 900 | 111,85 | 1 245 | 132,09 | |||
| 2026-02-13 | 13F | Walleye Capital LLC | Call | 91 300 | 271,14 | 896 | 306,82 | |||
| 2026-02-13 | 13F | Charles Schwab Investment Management Inc | 655 431 | 42,04 | 6 431 | 55,64 | ||||
| 2026-02-02 | 13F | Intact Investment Management Inc. | 126 400 | 1 239 | ||||||
| 2026-02-05 | 13F | Allworth Financial LP | 3 500 | 0,00 | 34 | 9,68 | ||||
| 2025-10-07 | 13F | Quintet Private Bank (Europe) S.A. | 0 | −100,00 | 0 | −100,00 | ||||
| 2026-02-17 | 13F | Guggenheim Capital Llc | 409 728 | 2,39 | 4 019 | 12,11 | ||||
| 2026-02-12 | 13F | Campbell & CO Investment Adviser LLC | 221 566 | 15,80 | 2 174 | 26,78 | ||||
| 2026-02-13 | 13F | Ingalls & Snyder Llc | 27 500 | 0,00 | 0 | |||||
| 2026-02-17 | 13F | Man Group plc | 783 022 | 192,48 | 7 681 | 220,31 | ||||
| 2025-11-14 | 13F | Luminist Capital LLC | 0 | −100,00 | 0 | |||||
| 2026-02-11 | 13F | Hughes Financial Services, LLC | 60 | 0,00 | 1 | |||||
| 2026-02-13 | 13F | National Bank Of Canada /fi/ | 506 332 | −57,65 | 4 959 | −53,38 | ||||
| 2026-01-09 | 13F | Pacifica Partners Inc. | 880 | 0,00 | 8 | 14,29 | ||||
| 2025-10-16 | 13F | Ronald Blue Trust, Inc. | 0 | −100,00 | 0 | −100,00 | ||||
| 2026-02-13 | 13F | MAI Capital Management | 482 | 0,00 | 5 | 0,00 | ||||
| 2026-02-12 | 13F | Northwest & Ethical Investments L.P. | 75 262 | −28,82 | 738 | −22,09 | ||||
| 2026-02-17 | 13F | Schonfeld Strategic Advisors LLC | 17 860 | −78,29 | 175 | −76,22 | ||||
| 2026-02-12 | 13F | Scotia Capital Inc. | 0 | −100,00 | 0 | |||||
| 2026-02-10 | 13F | Godfrey Financial Associates, Inc. | 55 | 1 | ||||||
| 2026-01-14 | 13F | Cypress Wealth Services, LLC | 21 030 | −26,97 | 206 | −20,16 | ||||
| 2026-02-17 | 13F | CastleKnight Management LP | 157 700 | 1 547 | ||||||
| 2026-02-17 | 13F | Jones Financial Companies Lllp | 4 653 | 365,30 | 46 | 462,50 | ||||
| 2025-09-29 | NP | GOEX - Global X Gold Explorers ETF This fund is a listed as child fund of Mirae Asset Global Investments Co., Ltd. and if that institution has disclosed ownership in this security, then these positions will not be double counted when calculating total shares and total value | 202 181 | −5,03 | 1 307 | −1,36 | ||||
| 2026-02-17 | 13F | CastleKnight Management LP | Call | 100 000 | 981 | |||||
| 2026-02-13 | 13F | Causeway Capital Management Llc | 863 628 | 645,36 | 8 474 | 717,16 | ||||
| 2026-02-13 | 13F | Wells Fargo & Company/mn | 5 190 | −47,73 | 51 | −43,18 | ||||
| 2026-02-17 | 13F | Millennium Management Llc | 1 523 049 | −63,14 | 14 941 | −59,64 | ||||
| 2026-02-17 | 13F | Two Sigma Investments, Lp | 3 341 086 | −12,11 | 32 776 | −3,77 | ||||
| 2026-01-30 | 13F | R Squared Ltd | 0 | −100,00 | 0 | |||||
| 2025-09-29 | NP | CRNSX - CATHOLIC RESPONSIBLE INVESTMENTS INTERNATIONAL SMALL-CAP FUND Institutional Shares | 18 606 | −4,93 | 120 | −0,83 | ||||
| 2025-10-08 | 13F | Sheets Smith Investment Management | 166 059 | 1 488 | ||||||
| 2026-02-09 | 13F | Harbour Investments, Inc. | 1 775 | −31,07 | 17 | −26,09 | ||||
| 2026-01-21 | 13F | Stone House Investment Management, LLC | 36 | 157,14 | 0 | |||||
| 2026-02-13 | 13F | SRS Capital Advisors, Inc. | 441 | 47,00 | 4 | 100,00 | ||||
| 2026-02-13 | 13F | Alberta Investment Management Corp | 313 600 | 3 073 | ||||||
| 2026-02-18 | 13F | State of Tennessee, Treasury Department | 34 925 | −65,15 | 342 | −61,98 | ||||
| 2026-01-15 | 13F | SILVER OAK SECURITIES, Inc | 24 915 | 0,00 | 248 | 10,76 | ||||
| 2026-02-17 | 13F | DZ BANK AG Deutsche Zentral Genossenschafts Bank, Frankfurt am Main | 1 789 733 | −2,29 | 17 557 | 7,08 | ||||
| 2026-01-21 | 13F | Rathbone Brothers plc | 0 | −100,00 | 0 | |||||
| 2026-02-10 | 13F/A | Northwestern Mutual Wealth Management Co | 683 | 7 | ||||||
| 2026-01-26 | 13F | Merit Financial Group, LLC | 11 248 | 5,45 | 110 | 15,79 | ||||
| 2026-03-13 | 13F/A | Pensionmark Financial Group, Llc | 144 276 | 1 415 | ||||||
| 2026-02-10 | 13F | Quantbot Technologies LP | 62 176 | −86,64 | 610 | −85,39 | ||||
| 2026-02-17 | 13F | Amundi | 3 754 336 | 1,38 | 36 830 | 10,87 | ||||
| 2026-02-12 | 13F | Swiss National Bank | 607 930 | 1,28 | 5 969 | 11,03 | ||||
| 2026-02-17 | 13F | PDT Partners, LLC | 102 831 | 0,00 | 1 009 | 9,45 | ||||
| 2026-02-13 | 13F | Prudential Financial Inc | 37 200 | −19,48 | 365 | −11,62 | ||||
| 2026-02-17 | 13F | Pinnacle Financial Partners, Inc. | 28 500 | 280 | ||||||
| 2026-02-17 | 13F | Numerai GP LLC | 51 191 | −33,77 | 502 | −27,46 | ||||
| 2026-02-12 | 13F | Principal Securities, Inc. | 0 | −100,00 | 0 | −100,00 | ||||
| 2026-02-13 | 13F | Pine Valley Investments Ltd Liability Co | 383 771 | 0,89 | 3 765 | 10,45 | ||||
| 2026-02-17 | 13F | Capital Fund Management S.a. | Put | 56 200 | −44,08 | 551 | −38,78 | |||
| 2026-02-12 | 13F | Hollencrest Capital Management | 116 100 | 0,00 | 1 139 | 9,42 | ||||
| 2025-11-14 | 13F | SummitTX Capital, L.P. | 0 | −100,00 | 0 | |||||
| 2025-11-07 | 13F | Shell Asset Management Co | 4 682 | −73,38 | 0 | |||||
| 2026-02-17 | 13F | SIG North Trading, ULC | Put | 91 000 | −30,21 | 893 | −23,63 | |||
| 2026-02-17 | 13F | SIG North Trading, ULC | Call | 38 600 | −53,94 | 379 | −49,60 | |||
| 2026-02-06 | 13F | IFP Advisors, Inc | 3 000 | 29 | ||||||
| 2026-02-11 | 13F | Winton Capital Group Ltd | 29 400 | 288 | ||||||
| 2026-02-17 | 13F | Capital Fund Management S.a. | Call | 168 600 | −14,24 | 1 654 | −6,13 | |||
| 2026-02-17 | 13F | SIG North Trading, ULC | 192 842 | 111,27 | 1 892 | 131,46 | ||||
| 2026-02-13 | 13F | Peak6 Llc | Call | 191 600 | −87,83 | 1 880 | −86,68 | |||
| 2026-02-13 | 13F | Dynamic Technology Lab Private Ltd | 56 972 | −34,42 | 559 | −28,15 | ||||
| 2025-11-14 | 13F | Cubist Systematic Strategies, LLC | 1 401 371 | 45,44 | 12 555 | 99,24 | ||||
| 2026-02-09 | 13F | Legal & General Group Plc | 1 458 914 | 13,13 | 14 311 | 23,89 | ||||
| 2026-01-22 | 13F | Greenberg Financial Group | 10 000 | 98 | ||||||
| 2026-02-12 | 13F | Sprott Inc. | 276 085 | −9,46 | 2 708 | −0,88 | ||||
| 2026-02-13 | 13F | Y-Intercept (Hong Kong) Ltd | 206 504 | −32,19 | 2 026 | −25,77 | ||||
| 2026-02-05 | 13F | Navalign, LLC | 197 | 2 | ||||||
| 2026-02-12 | 13F | Groupe la Francaise | 695 000 | 0,00 | 6 809 | 9,31 | ||||
| 2026-02-13 | 13F | Citigroup Inc | 30 756 | 33,74 | 302 | 46,83 | ||||
| 2026-02-12 | 13F | BlackRock, Inc. | 63 079 | 3 153 850,00 | 619 | |||||
| 2026-02-02 | 13F | Wolverine Asset Management Llc | Put | 551 500 | 4,75 | 5 410 | 14,69 | |||
| 2026-02-17 | 13F | D. E. Shaw & Co., Inc. | Call | 271 800 | 165,69 | 2 666 | 191,05 | |||
| 2026-02-17 | 13F | D. E. Shaw & Co., Inc. | 7 527 066 | 19,97 | 73 832 | 31,35 | ||||
| 2026-02-04 | 13F | Plato Investment Management Ltd | 7 537 | 74 | ||||||
| 2026-02-17 | 13F | Canada Pension Plan Investment Board | 1 081 000 | −32,87 | 10 593 | −26,50 | ||||
| 2026-02-18 | 13F | Mackenzie Financial Corp | 1 761 664 | 330,04 | 17 509 | 377,58 | ||||
| 2026-02-10 | 13F | CIBC World Markets Inc. | 225 968 | 12,59 | 2 214 | 23,27 | ||||
| 2025-11-13 | 13F | Farringdon Capital, Ltd. | 0 | −100,00 | 0 | |||||
| 2026-02-10 | 13F | Close Asset Management Ltd | 10 000 | 0,00 | 0 | |||||
| 2026-02-17 | 13F | Prelude Capital Management, Llc | 23 534 | −48,56 | 231 | −43,77 | ||||
| 2025-10-23 | 13F | Kingswood Wealth Advisors, Llc | 0 | −100,00 | 0 | |||||
| 2026-02-10 | 13F | CIBC Asset Management Inc | 288 377 | −2,91 | 2 828 | 6,44 | ||||
| 2026-02-17 | 13F | Toronto Dominion Bank | 2 680 091 | −1,18 | 26 263 | 8,19 | ||||
| 2026-02-17 | 13F | Toronto Dominion Bank | Put | 3 200 | −31,91 | 31 | −26,19 | |||
| 2026-02-17 | 13F | Toronto Dominion Bank | Call | 4 300 | −35,82 | 42 | −28,81 | |||
| 2025-11-13 | 13F | Blueshift Asset Management, LLC | 0 | −100,00 | 0 | −100,00 | ||||
| 2025-11-14 | 13F | Marex Group plc | 0 | −100,00 | 0 | −100,00 | ||||
| 2026-01-14 | 13F | Klein Pavlis & Peasley Financial, Inc. | 119 262 | −6,78 | 1 170 | 2,01 | ||||
| 2026-01-15 | 13F | Hara Capital LLC | 2 700 | 0,00 | 26 | 8,33 | ||||
| 2026-02-13 | 13F | De Lisle Partners LLP | 228 775 | −23,43 | 2 245 | −16,17 | ||||
| 2026-02-17 | 13F | Jain Global LLC | 61 164 | 5,34 | 599 | 15,41 | ||||
| 2026-01-26 | 13F | Abbington Investment Group | 120 870 | 21,07 | 1 186 | 32,55 | ||||
| 2026-01-09 | 13F | SG Americas Securities, LLC | 59 736 | 1 | ||||||
| 2026-02-13 | 13F | BRITISH COLUMBIA INVESTMENT MANAGEMENT Corp | 163 075 | −8,84 | 1 598 | −0,19 | ||||
| 2026-02-13 | 13F | Integrated Wealth Concepts LLC | 0 | −100,00 | 0 | |||||
| 2026-02-12 | 13F | Jane Street Group, Llc | Call | 93 700 | 337,85 | 919 | 381,15 | |||
| 2026-02-13 | 13F | Kilter Group LLC | 43 | 0,00 | 0 | |||||
| 2026-02-12 | 13F | Jane Street Group, Llc | 2 420 469 | 382,63 | 23 745 | 428,47 | ||||
| 2026-02-06 | 13F | Profund Advisors Llc | 31 532 | −16,73 | 309 | −8,85 | ||||
| 2026-02-12 | 13F | Jane Street Group, Llc | Put | 68 300 | 64,18 | 670 | 80,11 | |||
| 2026-02-13 | 13F | Barclays Plc | 282 605 | −41,24 | 2 772 | 24,53 | ||||
| 2026-02-17 | 13F | Keebeck Alpha, LP | 23 534 | −48,56 | 231 | −43,77 | ||||
| 2026-02-14 | 13F | Rockefeller Capital Management L.P. | 1 000 | 0,00 | 10 | 12,50 | ||||
| 2026-02-17 | 13F | Cape Investment Advisory, Inc. | 100 | 1 | ||||||
| 2026-02-17 | 13F | Lazard Asset Management Llc | 61 523 | −61,79 | 603 | −58,22 | ||||
| 2026-02-19 | 13F | Invesco Ltd. | 3 004 000 | −3,68 | 29 469 | 5,46 | ||||
| 2026-02-10 | 13F | Hillsdale Investment Management Inc. | 1 361 635 | −50,78 | 13 367 | −46,02 | ||||
| 2026-02-13 | 13F | Quarry LP | 1 344 | −97,09 | 13 | −96,85 | ||||
| 2026-02-12 | 13F | Bank Of Montreal /can/ | Call | 511 500 | 5 012 | |||||
| 2026-02-11 | 13F | Tiaa Trust, National Association | 436 540 | 0,00 | 4 282 | 9,49 | ||||
| 2026-02-12 | 13F | Bank Of Montreal /can/ | Put | 20 800 | 204 | |||||
| 2026-02-12 | 13F | Bank Of Montreal /can/ | 3 496 112 | −15,22 | 34 260 | −7,18 | ||||
| 2026-01-21 | 13F | Sound Income Strategies, LLC | 1 000 | 0,00 | 10 | 25,00 | ||||
| 2026-01-30 | 13F | Oakworth Capital, Inc. | 200 | 0,00 | 2 | 0,00 | ||||
| 2026-02-13 | 13F | JustInvest LLC | 15 179 | 3,56 | 149 | 12,98 | ||||
| 2026-02-03 | 13F | SBI Securities Co., Ltd. | 3 127 | −5,81 | 31 | 3,45 | ||||
| 2026-02-10 | 13F | Acadian Asset Management Llc | 11 382 736 | −2,48 | 112 | 6,73 | ||||
| 2026-01-27 | 13F | Zurcher Kantonalbank (Zurich Cantonalbank) | 93 280 | 12,67 | 915 | 23,48 | ||||
| 2026-02-17 | 13F | Engineers Gate Manager LP | 85 180 | −66,92 | 836 | −63,81 | ||||
| 2026-02-04 | 13F | Swiss Life Asset Management Ltd | 33 947 | 141,89 | 333 | 165,60 | ||||
| 2026-02-11 | 13F | Allianz Asset Management GmbH | 188 495 | 2,45 | 1 850 | 12,26 | ||||
| 2026-02-17 | 13F | Captrust Financial Advisors | 12 485 | 0,00 | 122 | 9,91 | ||||
| 2025-11-14 | 13F | Point72 Asia (Singapore) Pte. Ltd. | 0 | −100,00 | 0 | |||||
| 2026-02-02 | 13F | Wolverine Asset Management Llc | Call | 128 100 | 128 000,00 | 1 257 | ||||
| 2026-02-04 | 13F | Versor Investments LP | 0 | −100,00 | 0 | |||||
| 2026-02-17 | 13F | Brevan Howard Capital Management LP | 111 207 | 456,01 | 1 091 | 508,94 | ||||
| 2026-02-13 | 13F | Colony Group, LLC | 12 471 | 122 | ||||||
| 2026-02-04 | 13F | Centric Wealth Management | 11 000 | 10,00 | 108 | 30,49 | ||||
| 2025-11-14 | 13F | Axa S.a. | 0 | −100,00 | 0 | |||||
| 2026-01-20 | 13F | Coastal Investment Advisors, Inc. | 55 650 | −38,46 | 546 | −32,72 | ||||
| 2026-02-06 | 13F | Leonteq Securities AG | 2 000 | 0,00 | 27 | 8,33 | ||||
| 2026-01-27 | 13F | Proffitt & Goodson Inc | 2 500 | 0,00 | 25 | 9,09 | ||||
| 2026-02-10 | 13F | State of Wyoming | 22 190 | 218 | ||||||
| 2026-02-11 | 13F | Vise Technologies, Inc. | 0 | −100,00 | 0 | |||||
| 2026-02-12 | 13F | CoreCommodity Management, LLC | 76 897 | −18,09 | 754 | −10,34 | ||||
| 2025-11-14 | 13F | Capstone Investment Advisors, Llc | 30 057 | 269 | ||||||
| 2026-02-02 | 13F | PKO Investment Management Joint-Stock Co | 104 377 | 0,00 | 1 025 | 9,64 | ||||
| 2025-10-27 | 13F | Kiker Wealth Management, LLC | 0 | −100,00 | 0 | |||||
| 2026-03-04 | 13F | SHP Wealth Management | 100 | 1 | ||||||
| 2026-02-17 | 13F | Russell Investments Group, Ltd. | 990 008 | −4,69 | 9 718 | 4,56 | ||||
| 2026-02-17 | 13F | Massar Capital Management, LP | 43 914 | 431 | ||||||
| 2026-02-11 | 13F | Franklin Resources Inc | 183 514 | 7,56 | 1 798 | 17,75 | ||||
| 2026-02-06 | 13F | Larson Financial Group LLC | 442 | 281,03 | 4 | 300,00 | ||||
| 2026-02-17 | 13F | Parallax Volatility Advisers, L.P. | Call | 400 000 | 0,00 | 3 924 | 9,49 | |||
| 2026-02-09 | 13F | Geode Capital Management, Llc | 1 464 898 | 17,84 | 19 002 | 27,95 | ||||
| 2025-11-14 | 13F | Beacon Pointe Advisors, LLC | 0 | −100,00 | 0 | |||||
| 2026-02-17 | 13F | Citadel Advisors Llc | Call | 453 400 | 4,21 | 4 448 | 14,08 | |||
| 2026-02-17 | 13F | Citadel Advisors Llc | 207 063 | −88,93 | 2 031 | −87,88 | ||||
| 2026-02-17 | 13F | Advisor Group Holdings, Inc. | 10 774 | 63,19 | 106 | 94,44 | ||||
| 2026-02-17 | 13F | Citadel Advisors Llc | Put | 174 300 | −34,08 | 1 710 | −27,86 | |||
| 2026-02-13 | 13F | American Century Companies Inc | 8 269 909 | 2,96 | 81 053 | 12,69 | ||||
| 2026-02-13 | 13F | Aire Advisors, Llc | 0 | −100,00 | 0 | |||||
| 2026-02-05 | 13F | Cardinal Point Capital Management, ULC | 28 750 | −21,12 | 282 | −13,50 | ||||
| 2026-02-17 | 13F | Susquehanna International Group, Llp | 416 874 | 422,37 | 4 090 | 471,89 | ||||
| 2026-02-03 | 13F | McIlrath & Eck, LLC | 300 | 0,00 | 3 | 0,00 | ||||
| 2026-02-04 | 13F | Tsfg, Llc | 1 000 | 0,00 | 0 | |||||
| 2026-02-17 | 13F | Susquehanna International Group, Llp | Put | 351 000 | 47,54 | 3 443 | 61,57 | |||
| 2026-02-12 | 13F | Skopos Labs, Inc. | 17 577 | 175 | ||||||
| 2026-01-28 | 13F | CAPROCK Group, Inc. | 36 868 | 104,94 | 362 | 161,59 | ||||
| 2026-02-17 | 13F | Fmr Llc | 0 | −100,00 | 0 | |||||
| 2026-02-17 | 13F | Susquehanna International Group, Llp | Call | 1 144 700 | −6,40 | 11 230 | 2,47 | |||
| 2026-02-06 | 13F | Global Retirement Partners, LLC | 233 | 0,00 | 2 | 0,00 | ||||
| 2026-02-13 | 13F | BNP Paribas Asset Management Holding S.A. | 252 533 | 3 | ||||||
| 2026-02-17 | 13F | PharVision Advisers, LLC | 19 895 | −21,39 | 195 | −13,72 | ||||
| 2026-02-05 | 13F | Chase Investment Counsel Corp | 371 199 | 4 | ||||||
| 2026-01-14 | 13F | Generali Investments CEE, investicni spolecnost, a.s. | 8 000 | 0,00 | 78 | 9,86 | ||||
| 2026-02-12 | 13F | Steward Partners Investment Advisory, Llc | 5 000 | 0,00 | 49 | 11,36 | ||||
| 2026-02-13 | 13F | Public Sector Pension Investment Board | 0 | −100,00 | 0 | |||||
| 2025-11-14 | 13F | Evelyn Partners Investment Management (Europe) Ltd | 0 | −100,00 | 0 | −100,00 | ||||
| 2025-12-09 | 13F/A | Tudor Investment Corp Et Al | 25 378 | −74,41 | 227 | −64,97 | ||||
| 2026-02-11 | 13F | Simplex Trading, Llc | 10 934 | 107 | ||||||
| 2026-02-12 | 13F | Commonwealth Equity Services, Llc | 19 072 | −2,69 | 187 | |||||
| 2026-02-17 | 13F | Raymond James Financial Inc | 57 955 | 91,40 | 569 | 109,59 | ||||
| 2026-02-17 | 13F | Two Sigma Securities, Llc | 13 299 | 130 | ||||||
| 2026-01-23 | 13F | Assetmark, Inc | 65 | 0,00 | 1 | |||||
| 2026-02-13 | 13F | Morgan Stanley | 8 472 690 | −7,38 | 83 117 | 1,41 | ||||
| 2026-01-20 | 13F | Sheets Smith Wealth Management | 68 973 | −0,06 | 677 | 9,39 | ||||
| 2026-02-13 | 13F | Mariner, LLC | 96 874 | 134,42 | 950 | 156,76 | ||||
| 2026-02-05 | 13F | Baader Bank INC | 0 | −100,00 | 0 | |||||
| 2025-11-14 | 13F | Capula Management Ltd | 0 | −100,00 | 0 | −100,00 | ||||
| 2026-02-17 | 13F | Capital Fund Management S.a. | 555 821 | 49,22 | 5 453 | 63,38 | ||||
| 2026-02-18 | 13F | Vident Advisory, LLC | 40 323 | −86,98 | 396 | −85,76 | ||||
| 2025-11-14 | 13F | Walleye Capital LLC | 0 | −100,00 | 0 | −100,00 | ||||
| 2026-02-17 | 13F | Susquehanna Advisors Group, Inc. | 33 700 | 331 | ||||||
| 2026-02-17 | 13F | SPWM Advisors LLC | 10 010 | 98 | ||||||
| 2026-02-13 | 13F | Virtus ETF Advisers LLC | 37 681 | 0,00 | 370 | 9,50 | ||||
| 2025-11-13 | 13F | FORA Capital, LLC | 0 | −100,00 | 0 | −100,00 | ||||
| 2026-01-08 | 13F | Dagco, Inc. | 800 | 0,00 | 8 | 0,00 | ||||
| 2025-11-07 | 13F | Synovus Financial Corp | 28 500 | 0,00 | 255 | 37,10 | ||||
| 2026-01-21 | 13F | Towarzystwo Funduszy Inwestycyjnych Allianz Polska S.A. | 145 600 | 14,11 | 1 449 | 26,68 | ||||
| 2026-01-23 | 13F | Ritholtz Wealth Management | 175 396 | 104,18 | 1 721 | 123,67 | ||||
| 2026-02-17 | 13F | Jump Financial, LLC | 475 726 | 4 667 | ||||||
| 2026-02-06 | 13F | EverSource Wealth Advisors, LLC | 5 363 | −0,72 | 53 | 8,33 | ||||
| 2026-02-13 | 13F | Manufacturers Life Insurance Company, The | 0 | −100,00 | 0 | |||||
| 2026-02-17 | 13F/A | Sentinus, LLC | 10 500 | 103 | ||||||
| 2025-11-14 | 13F | Virtu Financial LLC | 0 | −100,00 | 0 | |||||
| 2026-01-30 | 13F | Pvg Asset Management Corp | 25 960 | 255 | ||||||
| 2026-02-13 | 13F | Walleye Trading LLC | Put | 23 300 | 1 692,31 | 229 | 1 972,73 | |||
| 2026-02-13 | 13F | Walleye Trading LLC | Call | 78 900 | 155,34 | 774 | 180,43 | |||
| 2026-02-24 | 13F | Chelsea Counsel Co | 8 680 | 0,00 | 85 | 10,39 | ||||
| 2026-01-27 | 13F | WealthCollab, LLC | 1 762 | 0,00 | 17 | 13,33 | ||||
| 2026-02-17 | 13F | Ancora Advisors, LLC | 1 332 | 0,00 | 13 | 18,18 | ||||
| 2026-02-17 | 13F | Scientech Research LLC | 29 297 | 287 | ||||||
| 2026-02-12 | 13F | Hohimer Wealth Management, Llc | 0 | −100,00 | 0 | |||||
| 2026-02-17 | 13F | Qube Research & Technologies Ltd | 2 547 053 | 1 614,33 | 24 987 | 1 777,24 | ||||
| 2026-02-11 | 13F | Prudential Plc | 43 120 | −7,35 | 423 | 1,44 | ||||
| 2026-02-10 | 13F | Connor, Clark & Lunn Investment Management Ltd. | 573 130 | −78,37 | 5 616 | −76,33 | ||||
| 2026-02-17 | 13F | Gotham Asset Management, LLC | 363 376 | 41,85 | 3 565 | 55,29 | ||||
| 2026-02-02 | 13F | Miracle Mile Advisors, LLC | 15 000 | 0,00 | 147 | 9,70 | ||||
| 2026-02-09 | 13F | IPG Investment Advisors LLC | 30 500 | 0,00 | 299 | 9,52 | ||||
| 2026-02-17 | 13F | Royal Bank Of Canada | 1 047 884 | 80,78 | 10 279 | 97,94 | ||||
| 2026-02-12 | 13F | Renaissance Technologies Llc | 1 517 600 | −31,83 | 14 888 | −25,36 | ||||
| 2026-02-13 | 13F | Squarepoint Ops LLC | Put | 11 300 | 0,00 | 111 | 8,91 | |||
| 2026-02-18 | 13F | GWM Advisors LLC | 211 355 | 6,31 | 2 073 | 16,40 | ||||
| 2025-11-14 | 13F | Point72 (DIFC) Ltd | 0 | −100,00 | 0 | |||||
| 2026-02-17 | 13F | Quantitative Investment Management, LLC | 0 | −100,00 | 0 | |||||
| 2026-02-17 | 13F | Tower Research Capital LLC (TRC) | 100 | −91,43 | 1 | −100,00 | ||||
| 2026-02-24 | 13F | DGS Capital Management, LLC | 10 454 | −3,22 | 103 | 6,25 | ||||
| 2025-09-29 | NP | SIL - Global X Silver Miners ETF This fund is a listed as child fund of Mirae Asset Global Investments Co., Ltd. and if that institution has disclosed ownership in this security, then these positions will not be double counted when calculating total shares and total value | 9 043 819 | 18,06 | 58 480 | 22,62 | ||||
| 2026-01-12 | 13F | DAVENPORT & Co LLC | 50 700 | 0,00 | 497 | 9,47 | ||||
| 2026-02-13 | 13F | Arrowstreet Capital, Limited Partnership | 20 216 810 | 3,52 | 198 176 | 13,33 | ||||
| 2026-02-10 | 13F | Goldman Sachs Group Inc | 3 977 108 | −45,66 | 39 015 | −40,51 | ||||
| 2026-02-10 | 13F | Savant Capital, LLC | 45 798 | 4,80 | 449 | 14,83 | ||||
| 2026-02-17 | 13F | Optiver Holding B.V. | 0 | −100,00 | 0 | |||||
| 2026-02-17 | 13F | Alliancebernstein L.p. | 138 939 | 217,50 | 1 363 | 247,45 | ||||
| 2026-02-10 | 13F | PCJ Investment Counsel Ltd. | 486 520 | 24,20 | 4 768 | 35,97 | ||||
| 2026-02-17 | 13F | Graham Capital Management, L.P. | 27 338 | 31,97 | 268 | 44,86 | ||||
| 2026-02-17 | 13F | New Vernon Capital Holdings II LLC | 7 475 | 0,00 | 101 | 51,52 | ||||
| 2026-02-13 | 13F | Verition Fund Management LLC | 22 000 | −56,42 | 216 | −52,43 | ||||
| 2025-11-14 | 13F | Squarepoint Ops LLC | 0 | −100,00 | 0 | −100,00 | ||||
| 2026-02-17 | 13F | Cetera Investment Advisers | 14 343 | 22,19 | 141 | 33,33 | ||||
| 2026-01-27 | 13F | TD Waterhouse Canada Inc. | 49 252 | 146,70 | 483 | 172,32 | ||||
| 2026-02-11 | 13F | Erste Asset Management GmbH | 65 600 | 651 | ||||||
| 2026-01-28 | 13F | U S Global Investors Inc | 560 601 | 5 499 | ||||||
| 2026-01-28 | 13F | Geneos Wealth Management Inc. | 4 100 | 2,50 | 40 | 14,29 | ||||
| 2026-02-17 | 13F | Perritt Capital Management Inc | 0 | −100,00 | 0 | |||||
| 2026-02-13 | 13F | Caitong International Asset Management Co., Ltd | 883 | −47,57 | 9 | −46,67 | ||||
| 2026-01-29 | 13F | Pictet Asset Management Holding SA | 55 920 | 12,29 | 549 | 23,15 | ||||
| 2026-02-06 | 13F | Banque Cantonale Vaudoise | 595 | 6 | ||||||
| 2026-01-23 | 13F | Rsm Us Wealth Management Llc | 11 688 | 1,82 | 116 | 13,73 | ||||
| 2026-02-13 | 13F | Centiva Capital, LP | 12 884 | 126 | ||||||
| 2026-01-29 | 13F | Vanguard Group Inc | 8 255 178 | 80,95 | 80 892 | 98,06 | ||||
| 2026-02-10 | 13F | Td Asset Management Inc | 1 629 640 | −7,69 | 15 990 | 1,14 | ||||
| 2026-02-17 | 13F | Advisory Services Network, LLC | 0 | −100,00 | 0 | |||||
| 2026-02-12 | 13F | Dimensional Fund Advisors Lp | 10 066 599 | 8,15 | 98 758 | 18,43 | ||||
| 2025-11-12 | 13F | Catalyst Funds Management Pty Ltd | 0 | −100,00 | 0 | |||||
| 2026-02-11 | 13F | LPL Financial LLC | 120 628 | −24,98 | 1 183 | −17,85 | ||||
| 2025-11-14 | 13F | ExodusPoint Capital Management, LP | 160 085 | −44,61 | 1 434 | 143 300,00 | ||||
| 2026-02-13 | 13F | Aigen Investment Management, Lp | 0 | −100,00 | 0 | |||||
| 2026-02-17 | 13F | Two Sigma Advisers, Lp | 1 207 100 | −1,83 | 11 842 | 7,48 | ||||
| 2026-02-17 | 13F | Trexquant Investment LP | 971 709 | −40,74 | 9 532 | −35,12 | ||||
| 2026-02-12 | 13F | Hrt Financial Lp | 246 537 | 2 | ||||||
| 2026-02-17 | 13F | Crabel Capital Management, LLC | 0 | −100,00 | 0 | |||||
| 2026-02-06 | 13F | Auxano Advisors, LLC | 200 000 | 1 962 | ||||||
| 2026-02-12 | 13F | Federation des caisses Desjardins du Quebec | 158 579 | 0,95 | 1 554 | 12,12 | ||||
| 2025-11-12 | 13F | Headlands Technologies LLC | 0 | −100,00 | 0 | |||||
| 2026-01-26 | 13F | PFG Investments, LLC | 13 579 | 0,00 | 133 | 9,92 | ||||
| 2026-02-03 | 13F | Farmers & Merchants Investments Inc | 150 | 0,00 | 1 | 0,00 | ||||
| 2025-11-14 | 13F | Algert Global Llc | 0 | −100,00 | 0 | |||||
| 2026-01-21 | 13F | Carolina Wealth Advisors, LLC | 245 | 0,00 | 2 | 0,00 | ||||
| 2026-01-21 | 13F/A | Euro Pacific Asset Management, LLC | 4 464 769 | 0,88 | 43 | 10,26 | ||||
| 2026-02-04 | 13F | Drive Wealth Management, Llc | 13 973 | 2,66 | 137 | 13,22 | ||||
| 2026-01-14 | 13F | ORG Partners LLC | 600 | 5 900,00 | 6 | |||||
| 2026-02-12 | 13F | Nuveen, LLC | 2 584 403 | −13,51 | 25 359 | −5,23 | ||||
| 2026-02-13 | 13F | Smartleaf Asset Management LLC | 2 374 | 24 | ||||||
| 2026-01-14 | 13F | Sicart Associates LLC | 648 736 | 1,96 | 6 364 | 11,65 | ||||
| 2026-02-17 | 13F | Voloridge Investment Management, Llc | 2 221 012 | 6,67 | 21 788 | 16,79 | ||||
| 2026-01-21 | 13F | Flagship Harbor Advisors, Llc | 394 | 4 | ||||||
| 2026-02-13 | 13F | Toroso Investments, LLC | 9 666 827 | 8,04 | 94 832 | 18,29 | ||||
| 2026-01-07 | 13F | Aventura Private Wealth, LLC | 1 500 | 0,00 | 15 | 7,69 | ||||
| 2026-01-29 | 13F | UBS Group AG | Put | 300 000 | 0,00 | 2 943 | 9,49 | |||
| 2026-01-29 | 13F | UBS Group AG | 2 695 663 | 34,80 | 26 444 | 47,58 | ||||
| 2026-02-10 | 13F | Bnp Paribas Arbitrage, Sa | 37 112 | −21,16 | 364 | −13,54 | ||||
| 2026-02-04 | 13F | Independent Advisor Alliance | 14 930 | −2,07 | 146 | 7,35 | ||||
| 2026-02-13 | 13F | Bridgefront Capital, LLC | 19 804 | 194 | ||||||
| 2026-02-13 | 13F | Neuberger Berman Group LLC | 142 084 | 76,44 | 1 394 | 93,34 | ||||
| 2026-02-10 | 13F | Root Financial Partners, LLC | 93 | 0,00 | 1 | |||||
| 2025-11-24 | 13F | Penn Capital Management Co Inc | 0 | −100,00 | 0 | −100,00 | ||||
| 2026-02-17 | 13F | XTX Topco Ltd | 61 686 | −57,66 | 605 | −53,64 | ||||
| 2026-02-17 | 13F | Public Employees Retirement System Of Ohio | 812 040 | −2,17 | 7 968 | 7,18 | ||||
| 2026-02-13 | 13F | Kestra Advisory Services, LLC | 7 920 | 78 | ||||||
| 2026-01-13 | 13F | West Financial Advisors, LLC | 150 | 0,00 | 1 | 0,00 | ||||
| 2026-01-20 | 13F | AdvisorNet Financial, Inc | 3 135 | −18,25 | 31 | −11,76 | ||||
| 2026-02-17 | 13F | Bank Of America Corp /de/ | 1 600 972 | 181,32 | 15 706 | 208,00 | ||||
| 2026-02-17 | 13F | MIRAE ASSET GLOBAL ETFS HOLDINGS Ltd. | 18 013 453 | 31,42 | 176 751 | 44,00 | ||||
| 2026-02-17 | 13F | Investment Management Corp of Ontario | 37 673 | 230,90 | 370 | 261,76 | ||||
| 2026-02-10 | 13F | Envestnet Asset Management Inc | 25 254 | 56,50 | 248 | 71,53 | ||||
| 2025-11-14 | 13F | Ubs Asset Management Americas Inc | 0 | −100,00 | 0 | |||||
| 2026-02-17 | 13F | Point72 Asset Management, L.P. | 700 334 | 546,89 | 6 869 | 608,88 | ||||
| 2025-09-29 | NP | PDN - Invesco FTSE RAFI Developed Markets ex-U.S. Small-Mid ETF This fund is a listed as child fund of Invesco Ltd. and if that institution has disclosed ownership in this security, then these positions will not be double counted when calculating total shares and total value | 53 198 | −16,39 | 344 | −13,38 | ||||
| 2026-01-29 | 13F | UMA Financial Services, Inc. | 60 | 1 | ||||||
| 2026-02-11 | 13F | O'shaughnessy Asset Management, Llc | 897 363 | −3,33 | 8 798 | 5,86 | ||||
| 2026-01-23 | 13F | Farther Finance Advisors, LLC | 8 629 | 0,47 | 85 | 10,53 | ||||
| 2026-02-17 | 13F | Aqr Capital Management Llc | 138 788 | 1 360 | ||||||
| 2026-02-05 | 13F | Cambridge Investment Research Advisors, Inc. | 48 590 | −17,92 | 0 | |||||
| 2025-09-29 | NP | AIM SECTOR FUNDS (INVESCO SECTOR FUNDS) - Invesco Oppenheimer Gold & Special Minerals Fund Class C | 292 539 | −89,12 | 1 887 | −88,78 | ||||
| 2026-02-09 | 13F | Employees Retirement System of Texas | 7 263 | 0,00 | 0 | |||||
| 2026-01-13 | 13F | Kathmere Capital Management, LLC | 14 115 | 138 | ||||||
| 2026-02-13 | 13F | Entropy Technologies, LP | 77 192 | 757 |