Grundläggande statistik
| Institutionella aktier (lång) | 16 442 720 - 45,78% (ex 13D/G) - change of −1,90MM shares −10,35% MRQ |
| Institutionellt värde (lång) | $ 478 808 USD ($1000) |
Institutionellt ägande och aktieägare
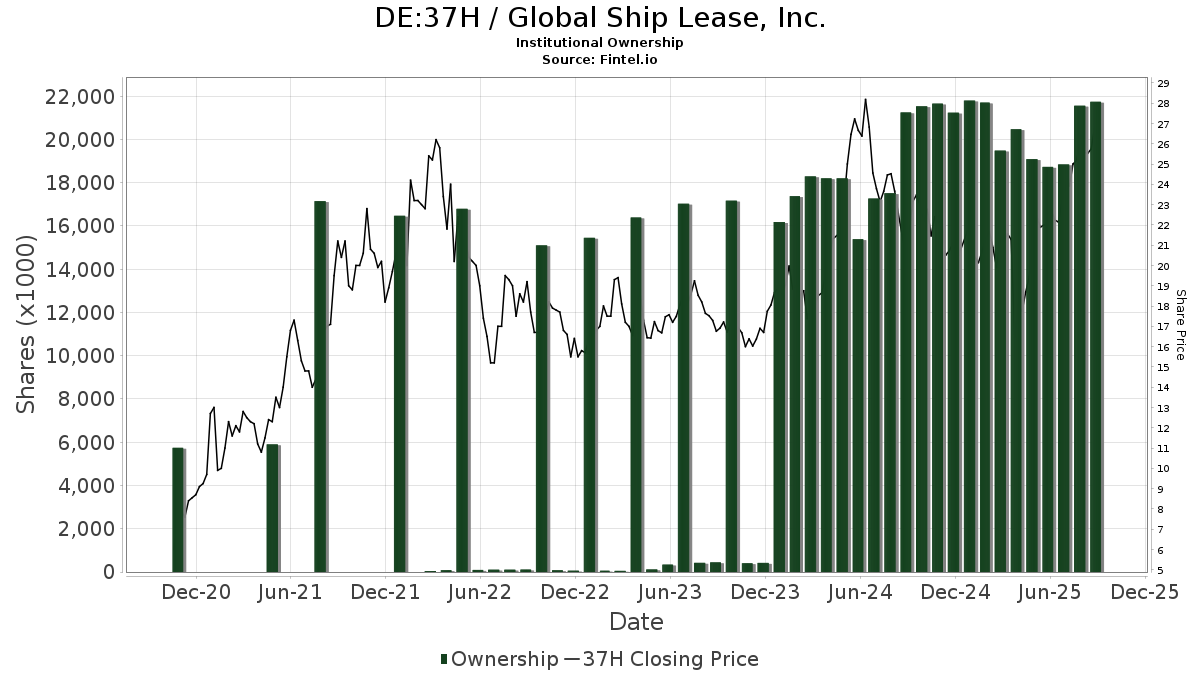
Global Ship Lease, Inc. (DE:37H) har 205 Institutionella ägare och aktieägare som har lämnat in 13D/G- eller 13F-formulär till Securities Exchange Commission (SEC). Dessa institut innehar totalt 16,442,720 aktier. Största aktieägare inkluderar Donald Smith & Co., Inc., Acadian Asset Management Llc, Punch & Associates Investment Management, Inc., Renaissance Technologies Llc, Two Sigma Investments, Lp, Two Sigma Advisers, Lp, MIRAE ASSET GLOBAL ETFS HOLDINGS Ltd., Qube Research & Technologies Ltd, CSM Advisors, LLC, and RBF Capital, LLC .
Global Ship Lease, Inc. (DB:37H) Institutionell ägarstruktur visar institutioners och fonders nuvarande positioner i företaget, samt de senaste förändringarna i positionernas storlek. Större aktieägare kan vara enskilda investerare, fonder, hedgefonder eller institutioner. Bilaga 13D visar att investeraren äger (eller ägde) mer än 5% av företaget och avser (eller avsåg) att aktivt eftersträva en förändring av affärsstrategin. Schedule 13G indikerar en passiv investering på över 5%.
The share price as of April 24, 2026 is 32,10 / share. Previously, on April 28, 2025, the share price was 18,50 / share. This represents an increase of 73,51% over that period.
Fondsentimentets poäng
Fondsentimentet poängen(fka Ägarackumulation-poäng) visar vilka aktier som är mest köpta av fonder. Det är resultatet av en sofistikerad kvantitativ flerfaktormodell som identifierar företag med de högsta nivåerna av institutionell ackumulering. Poängsättningsmodellen använder en kombination av den totala ökningen av redovisade ägare, förändringarna i portföljallokeringarna för dessa ägare och andra mått. Siffran sträcker sig från 0 till 100, där högre siffror indikerar en högre nivå av ackumulering i förhållande till sina konkurrenter, och 50 är genomsnittet.
Uppdateringsfrekvens: Dagligen
Se Ownership Explorer, som innehåller en lista över de högst rankade företagen.
AI+ Ask Fintel’s AI assistant about Global Ship Lease, Inc..
Select a question to share a public post with an AI-crafted answer.
Thinking of good questions…
13F- och NPORT-arkiveringar
Detaljer om 13F-arkiveringar är gratis. Detaljer om NP-arkiveringar kräver ett premiummedlemskap. Gröna rader indikerar nya positioner. Röda rader indikerar stängda positioner. Klicka på länk symbolen för att se hela transaktionshistoriken.
Uppgradera
för att låsa upp premiumdata och exportera till Excel ![]() .
.
| Fil Datum | Källa | Investerare | Typ | Genomsnittligt pris (beräknat) |
Aktier | Δ Aktier (%) |
Rapporterat värde (1000 USD) |
Δ Värde (%) |
Portföljallokering (%) |
|
|---|---|---|---|---|---|---|---|---|---|---|
| 2026-02-13 | 13F | Walleye Trading LLC | 0 | −100,00 | 0 | −100,00 | ||||
| 2026-02-03 | 13F | SBI Securities Co., Ltd. | 8 941 | 310,33 | 313 | 374,24 | ||||
| 2026-02-17 | 13F | Creative Planning | 16 492 | 21,88 | 578 | 39,04 | ||||
| 2026-02-11 | 13F | Group One Trading, L.p. | Call | 11 000 | 50,68 | 385 | 71,88 | |||
| 2026-02-11 | 13F | Group One Trading, L.p. | Put | 500 | −88,37 | 18 | −87,12 | |||
| 2026-02-17 | 13F | Susquehanna International Group, Llp | 0 | −100,00 | 0 | |||||
| 2026-02-11 | 13F | Group One Trading, L.p. | 238 | −94,29 | 8 | −93,75 | ||||
| 2026-02-12 | 13F | Barnett & Company, Inc. | 25 345 | 0,86 | 888 | 15,18 | ||||
| 2026-02-10 | 13F | Commonwealth Of Pennsylvania Public School Empls Retrmt Sys | 34 244 | 0,00 | 1 200 | 14,08 | ||||
| 2026-01-23 | 13F | Penn Mutual Asset Management, LLC | 0 | −100,00 | 0 | |||||
| 2026-02-17 | 13F | D. E. Shaw & Co., Inc. | Put | 9 100 | 319 | |||||
| 2026-02-17 | 13F | Petrus Trust Company, LTA | 0 | −100,00 | 0 | −100,00 | ||||
| 2026-02-17 | 13F | D. E. Shaw & Co., Inc. | Call | 18 800 | 659 | |||||
| 2026-02-17 | 13F | Ameriprise Financial Inc | 101 190 | −0,89 | 3 547 | 13,18 | ||||
| 2026-02-17 | 13F | D. E. Shaw & Co., Inc. | 71 757 | 2 514 | ||||||
| 2026-02-06 | 13F | HighTower Advisors, LLC | 6 224 | 218 | ||||||
| 2026-02-10 | 13F/A | Northwestern Mutual Wealth Management Co | 833 | 29 | ||||||
| 2026-02-12 | 13F | BlackRock, Inc. | 217 709 | 2,48 | 7 629 | 16,98 | ||||
| 2026-04-20 | 13F | State of Alaska, Department of Revenue | 1 987 | 0,00 | 0 | |||||
| 2026-02-17 | 13F | Jones Financial Companies Lllp | 20 994 | 16,73 | 736 | 28,27 | ||||
| 2026-02-11 | 13F | Winton Capital Group Ltd | 27 079 | 949 | ||||||
| 2026-02-17 | 13F | Numerai GP LLC | 25 421 | 891 | ||||||
| 2026-02-12 | 13F | Triumph Capital Management | 1 700 | 106,06 | 60 | 136,00 | ||||
| 2026-04-14 | 13F | Nbc Securities, Inc. | 0 | −100,00 | 0 | |||||
| 2026-02-12 | 13F | Campbell & CO Investment Adviser LLC | 9 233 | 9,24 | 324 | 24,71 | ||||
| 2025-11-12 | 13F | CIBC Bancorp USA Inc. | 22 525 | 692 | ||||||
| 2026-02-17 | 13F | Grantham, Mayo, Van Otterloo & Co. LLC | 20 700 | 725 | ||||||
| 2026-02-18 | 13F | State of Tennessee, Treasury Department | 61 554 | −9,23 | 2 311 | 11,00 | ||||
| 2026-02-17 | 13F | Quadrature Capital Ltd | 0 | −100,00 | 0 | |||||
| 2025-11-20 | 13F | Wbi Investments, Inc. | 0 | −100,00 | 0 | −100,00 | ||||
| 2026-02-17 | 13F | Magnetar Financial LLC | 17 487 | 613 | ||||||
| 2026-02-05 | 13F | Plante Moran Financial Advisors, LLC | 375 | 13 | ||||||
| 2026-02-11 | 13F | Franklin Resources Inc | 15 742 | −0,54 | 552 | 13,61 | ||||
| 2026-01-30 | 13F | Archer Investment Corp | 11 | 0,00 | 0 | |||||
| 2026-02-03 | 13F | Strengthening Families & Communities, LLC | 1 563 | 55 | ||||||
| 2026-02-13 | 13F | Integrity Investment Advisors, LLC | 8 218 | 1,72 | 288 | 15,73 | ||||
| 2026-02-10 | 13F | Quantbot Technologies LP | 42 247 | −15,24 | 1 480 | −3,27 | ||||
| 2026-04-14 | 13F | Seven Mile Advisory | 5 372 | 200 | ||||||
| 2026-02-13 | 13F | SRS Capital Advisors, Inc. | 308 | 0,00 | 11 | 11,11 | ||||
| 2026-04-15 | 13F | Capital Advisory Group Advisory Services, LLC | 0 | −100,00 | 0 | |||||
| 2026-01-29 | 13F | IMC-Chicago, LLC | Call | 19 100 | 78,50 | 669 | 103,96 | |||
| 2025-11-14 | 13F | Corton Capital Inc. | 7 126 | −34,90 | 219 | −24,31 | ||||
| 2026-02-17 | 13F | Lonestar Capital Management LLC | 160 000 | −44,44 | 5 606 | −36,59 | ||||
| 2026-02-17 | 13F | Lazard Asset Management Llc | 178 068 | −9,36 | 6 240 | 3,45 | ||||
| 2026-02-17 | 13F | Russell Investments Group, Ltd. | 1 673 | 73,91 | 59 | 100,00 | ||||
| 2026-02-17 | 13F | Schonfeld Strategic Advisors LLC | 0 | −100,00 | 0 | |||||
| 2026-01-29 | 13F | Nbc Securities, Inc. | Call | 0 | −100,00 | 0 | ||||
| 2026-02-17 | 13F | Public Employees Retirement System Of Ohio | 92 091 | −0,13 | 3 227 | 13,99 | ||||
| 2026-04-23 | 13F | Oppenheimer & Co Inc | 10 735 | 7,09 | 400 | 13,68 | ||||
| 2026-02-03 | 13F | Ballentine Partners, LLC | 0 | −100,00 | 0 | |||||
| 2026-04-22 | 13F | Samalin Investment Counsel, LLC | 23 664 | 2,32 | 881 | 8,64 | ||||
| 2026-04-20 | 13F | Ronald Blue Trust, Inc. | 2 221 | −0,94 | 83 | 5,13 | ||||
| 2026-02-17 | 13F | Aquatic Capital Management LLC | 4 063 | 142 | ||||||
| 2026-02-17 | 13F | Boothbay Fund Management, Llc | 10 927 | 383 | ||||||
| 2026-02-18 | 13F | GWM Advisors LLC | 20 973 | 4,85 | 735 | 19,54 | ||||
| 2026-02-13 | 13F | JustInvest LLC | 11 269 | −1,97 | 395 | 11,93 | ||||
| 2026-02-17 | 13F | TCG Advisory Services, LLC | 11 558 | 405 | ||||||
| 2026-02-09 | 13F | Royal Palms Capital LLC | 104 595 | 3 665 | ||||||
| 2026-02-13 | 13F | Mariner, LLC | 0 | −100,00 | 0 | |||||
| 2026-02-17 | 13F | Credit Agricole S A | 34 291 | 1 202 | ||||||
| 2026-04-24 | 13F | UMA Financial Services, Inc. | 27 | 0,00 | 1 | |||||
| 2026-01-27 | 13F | Evergreen Capital Management Llc | 7 885 | 14,51 | 276 | 30,81 | ||||
| 2026-02-10 | 13F | Acadian Asset Management Llc | 1 472 519 | 2,60 | 52 | 15,91 | ||||
| 2026-02-17 | 13F | Engineers Gate Manager LP | 18 817 | −2,21 | 659 | 11,69 | ||||
| 2026-02-17 | 13F | Parvin Asset Management, LLC | 17 870 | 626 | ||||||
| 2026-04-20 | 13F | Kestra Private Wealth Services, Llc | 23 866 | −17,43 | 889 | −12,25 | ||||
| 2026-02-13 | 13F | Sei Investments Co | 132 271 | 56,14 | 4 635 | 78,23 | ||||
| 2026-04-23 | 13F | Intrua Financial, LLC | 8 300 | 0,00 | 309 | 6,55 | ||||
| 2026-02-13 | 13F | Morgan Stanley | 422 760 | 9,71 | 14 814 | 25,23 | ||||
| 2026-02-27 | 13F | Strategic Investment Solutions, Inc. /IL | 100 | 0,00 | 4 | 0,00 | ||||
| 2026-02-06 | 13F | Pnc Financial Services Group, Inc. | 256 | 9 | ||||||
| 2026-02-13 | 13F | Citigroup Inc | 3 982 | −9,02 | 140 | 3,73 | ||||
| 2026-04-16 | 13F | SG Americas Securities, LLC | 185 168 | 225,90 | 7 | 500,00 | ||||
| 2026-02-13 | 13F | Smartleaf Asset Management LLC | 341 | 12 | ||||||
| 2026-04-22 | 13F | BluePath Capital Management, LLC | 30 973 | −13,67 | 1 153 | −8,27 | ||||
| 2026-02-12 | 13F | Pinnacle Holdings, LLC | 2 512 | −1,84 | 88 | 12,82 | ||||
| 2026-02-09 | 13F | Harbour Investments, Inc. | 73 | 69,77 | 3 | 100,00 | ||||
| 2026-02-17 | 13F | Tower Research Capital LLC (TRC) | 0 | −100,00 | 0 | |||||
| 2026-02-12 | 13F | Hrt Financial Lp | 30 773 | −25,42 | 1 | 0,00 | ||||
| 2026-01-30 | 13F | Us Bancorp \de\ | 2 637 | 0,00 | 92 | 15,00 | ||||
| 2026-02-17 | 13F | Raymond James Financial Inc | 27 364 | 140,22 | 959 | 174,50 | ||||
| 2026-02-13 | 13F | Parkside Financial Bank & Trust | 431 | 1 336,67 | 15 | |||||
| 2026-02-06 | 13F | Larson Financial Group LLC | 226 | 8 | ||||||
| 2026-02-17 | 13F | Mercer Global Advisors Inc /adv | 10 238 | 0,00 | 359 | 14,01 | ||||
| 2026-04-24 | 13F | Root Financial Partners, LLC | 300 | 0,00 | 11 | 10,00 | ||||
| 2026-02-17 | 13F | Advisory Services Network, LLC | 6 241 | 0,52 | 219 | 14,74 | ||||
| 2026-02-20 | 13F | Sunbelt Securities, Inc. | 79 | 0,00 | 3 | 0,00 | ||||
| 2026-02-17 | 13F | XTX Topco Ltd | 0 | −100,00 | 0 | |||||
| 2026-02-24 | 13F | DGS Capital Management, LLC | 46 459 | 19,13 | 1 628 | 35,92 | ||||
| 2026-02-10 | 13F | Goldman Sachs Group Inc | 170 769 | 407,40 | 5 984 | 479,19 | ||||
| 2026-02-11 | 13F | LPL Financial LLC | 244 741 | −3,30 | 8 576 | 10,37 | ||||
| 2026-04-07 | 13F | Farther Finance Advisors, LLC | 2 884 | 4,49 | 109 | 12,50 | ||||
| 2026-02-12 | 13F | Commonwealth Equity Services, Llc | 30 317 | −37,64 | 1 062 | 106 100,00 | ||||
| 2026-03-04 | 13F | SHP Wealth Management | 1 000 | 35 | ||||||
| 2025-11-12 | 13F | Huntington National Bank | 0 | −100,00 | 0 | |||||
| 2026-02-13 | 13F | Charles Schwab Investment Management Inc | 236 994 | 25,30 | 8 304 | 43,02 | ||||
| 2026-02-10 | 13F | Crescent Grove Advisors, LLC | 149 471 | 12,49 | 5 237 | 28,39 | ||||
| 2026-02-17 | 13F | Qube Research & Technologies Ltd | 604 604 | 6,55 | 21 185 | 21,61 | ||||
| 2026-02-13 | 13F | State Street Corp | 331 619 | 4,80 | 11 620 | 19,61 | ||||
| 2026-03-25 | 13F/A | Lifetime Wealth Management P.C. | 20 623 | 723 | ||||||
| 2026-02-17 | 13F | Fairscale Capital, LLC | 5 749 | 54,54 | 201 | 76,32 | ||||
| 2026-02-04 | 13F | Ameritas Advisory Services, LLC | 0 | −100,00 | 0 | |||||
| 2026-02-06 | 13F | Vestmark Advisory Solutions, Inc. | 7 169 | 251 | ||||||
| 2026-01-29 | 13F | UBS Group AG | 49 544 | −3,55 | 1 736 | 10,15 | ||||
| 2026-01-23 | 13F | LOM Asset Management Ltd | 1 400 | 49 | ||||||
| 2025-11-14 | 13F | Whitefort Capital Management, LP | 0 | −100,00 | 0 | −100,00 | ||||
| 2025-11-14 | 13F | Wolverine Trading, Llc | 21 089 | 652 | ||||||
| 2026-02-19 | 13F | CI Private Wealth, LLC | 16 606 | 11,49 | 525 | 14,66 | ||||
| 2025-11-14 | 13F | Wolverine Trading, Llc | Call | 21 700 | 671 | |||||
| 2025-11-14 | 13F | Wolverine Trading, Llc | Put | 24 600 | 761 | |||||
| 2026-02-13 | 13F | Walleye Trading LLC | Put | 900 | 50,00 | 32 | 72,22 | |||
| 2026-02-13 | 13F | Walleye Trading LLC | Call | 12 000 | 1 400,00 | 420 | 1 650,00 | |||
| 2026-02-12 | 13F | Principal Securities, Inc. | 0 | −100,00 | 0 | |||||
| 2026-01-30 | 13F | State of New Jersey Common Pension Fund D | 14 844 | 0,00 | 520 | 14,29 | ||||
| 2026-02-10 | 13F | Tidemark, LLC | 584 | 0,00 | 20 | 17,65 | ||||
| 2026-02-17 | 13F | Royal Bank Of Canada | 26 633 | 2,76 | 933 | 17,36 | ||||
| 2026-02-13 | 13F | Resources Investment Advisors, LLC. | 0 | −100,00 | 0 | |||||
| 2026-04-22 | 13F | Janney Montgomery Scott LLC | 92 692 | −2,85 | 3 | 0,00 | ||||
| 2026-02-05 | 13F | Leuthold Group, Llc | 7 473 | 0,08 | 262 | 13,97 | ||||
| 2026-04-17 | 13F | AdvisorNet Financial, Inc | 245 | −36,36 | 9 | −30,77 | ||||
| 2026-02-17 | 13F | Advisor Group Holdings, Inc. | 52 183 | −10,71 | 1 829 | 1,67 | ||||
| 2026-04-22 | 13F | Apollon Wealth Management, LLC | 7 932 | 295 | ||||||
| 2026-01-27 | 13F | WealthCollab, LLC | 1 240 | 0,00 | 43 | 13,16 | ||||
| 2026-01-20 | 13F | Harbor Capital Advisors, Inc. | 122 702 | −15,53 | 4 | 0,00 | ||||
| 2026-02-14 | 13F | Rockefeller Capital Management L.P. | 2 810 | −46,27 | 98 | −38,75 | ||||
| 2026-02-13 | 13F | Transamerica Financial Advisors, Inc. | 13 | 0 | ||||||
| 2026-02-19 | 13F | Invesco Ltd. | 52 687 | −10,80 | 1 846 | 1,82 | ||||
| 2026-02-17 | 13F | Jump Financial, LLC | 108 371 | 188,99 | 3 797 | 229,89 | ||||
| 2025-11-17 | 13F | PharVision Advisers, LLC | 0 | −100,00 | 0 | −100,00 | ||||
| 2026-04-27 | 13F | New England Capital Financial Advisors LLC | 436 | −17,42 | 16 | −11,11 | ||||
| 2026-02-13 | 13F | Virtus ETF Advisers LLC | 5 437 | 46,95 | 191 | 68,14 | ||||
| 2026-02-13 | 13F | Aigen Investment Management, Lp | 6 425 | 225 | ||||||
| 2026-02-17 | 13F | Tudor Investment Corp Et Al | Call | 6 100 | 214 | |||||
| 2026-02-17 | 13F | Tudor Investment Corp Et Al | 212 680 | −2,41 | 7 452 | 11,39 | ||||
| 2026-04-15 | 13F | Valley National Advisers Inc | 103 | 0,00 | 0 | |||||
| 2026-02-12 | 13F | Renaissance Technologies Llc | 693 350 | −17,32 | 24 295 | −5,63 | ||||
| 2026-02-12 | 13F | EntryPoint Capital, LLC | 6 607 | 0,00 | 232 | 14,36 | ||||
| 2026-01-30 | 13F | Sigma Planning Corp | 18 892 | −1,35 | 662 | 12,61 | ||||
| 2026-04-15 | 13F | Redhawk Wealth Advisors, Inc. | 44 427 | −8,16 | 1 654 | −2,36 | ||||
| 2026-04-21 | 13F | Founders Capital Management | 1 000 | 0,00 | 37 | 5,71 | ||||
| 2026-02-17 | 13F | Bank Of America Corp /de/ | 27 265 | 11,00 | 955 | 26,66 | ||||
| 2026-04-27 | 13F | Y-Intercept (Hong Kong) Ltd | 89 933 | 35,82 | 3 348 | 44,31 | ||||
| 2026-02-05 | 13F | Isthmus Partners, Llc | 116 609 | −0,13 | 4 086 | 136 066,67 | ||||
| 2026-01-23 | 13F | Assetmark, Inc | 1 804 | 8,61 | 63 | 26,00 | ||||
| 2026-02-12 | 13F | Marex Group plc | 105 139 | 505,57 | 3 684 | 591,18 | ||||
| 2026-04-27 | 13F | Counterpoint Mutual Funds LLC | 0 | −100,00 | 0 | |||||
| 2026-01-28 | 13F | CAPROCK Group, Inc. | 7 226 | −0,15 | 253 | 14,48 | ||||
| 2026-02-18 | 13F | Vident Advisory, LLC | 32 016 | −10,49 | 1 122 | 2,09 | ||||
| 2026-04-15 | 13F | DAVENPORT & Co LLC | 6 380 | 238 | ||||||
| 2026-02-13 | 13F | Verition Fund Management LLC | 48 854 | −31,95 | 1 712 | −22,37 | ||||
| 2026-01-12 | 13F | CVA Family Office, LLC | 103 | 0,00 | 4 | 0,00 | ||||
| 2026-02-13 | 13F | Squarepoint Ops LLC | 9 702 | −29,57 | 340 | −19,67 | ||||
| 2026-02-13 | 13F | Wells Fargo & Company/mn | 12 522 | 12,30 | 439 | 28,07 | ||||
| 2025-10-28 | 13F | BRYN MAWR TRUST Co | 596 | 0,00 | 18 | 20,00 | ||||
| 2026-04-13 | 13F | IFP Advisors, Inc | 400 | 15 | ||||||
| 2026-02-17 | 13F | Two Sigma Advisers, Lp | 631 200 | −11,52 | 22 117 | 0,99 | ||||
| 2026-02-10 | 13F | Envestnet Asset Management Inc | 9 992 | −18,00 | 350 | −6,42 | ||||
| 2026-04-20 | 13F | Hilton Head Capital Partners, LLC | 1 205 | 20,50 | 45 | 25,71 | ||||
| 2026-04-20 | 13F | Ritholtz Wealth Management | 5 456 | 203 | ||||||
| 2026-01-05 | 13F | Commons Capital, Llc | 86 000 | 0,00 | 3 013 | 14,13 | ||||
| 2026-01-29 | 13F | IMC-Chicago, LLC | Put | 0 | −100,00 | 0 | −100,00 | |||
| 2026-02-13 | 13F | Quarry LP | 138 | −45,02 | 5 | −42,86 | ||||
| 2026-01-27 | 13F | TD Waterhouse Canada Inc. | 2 000 | −38,46 | 70 | −29,29 | ||||
| 2026-02-13 | 13F | Caitong International Asset Management Co., Ltd | 383 | 61,60 | 13 | 85,71 | ||||
| 2026-02-11 | 13F | CSM Advisors, LLC | 446 060 | 3,04 | 16 | 15,38 | ||||
| 2026-02-13 | 13F | Visionary Wealth Advisors | 13 432 | 471 | ||||||
| 2026-02-17 | 13F | Millennium Management Llc | 315 841 | 42,59 | 11 067 | 62,75 | ||||
| 2026-02-06 | 13F | Global Retirement Partners, LLC | 1 153 | 0,00 | 40 | 14,29 | ||||
| 2026-02-11 | 13F | Fox Run Management, L.l.c. | 8 206 | 288 | ||||||
| 2026-02-17 | 13F | Trexquant Investment LP | 114 593 | 125,95 | 4 015 | 157,87 | ||||
| 2026-04-10 | 13F | Quaker Wealth Management, LLC | 250 | 0,00 | 9 | 12,50 | ||||
| 2025-11-12 | 13F | Barclays Plc | 0 | −100,00 | 0 | −100,00 | ||||
| 2026-02-10 | 13F | State of Wyoming | 18 856 | −25,69 | 661 | −15,17 | ||||
| 2026-02-10 | 13F | Bnp Paribas Arbitrage, Sa | 1 | 0,00 | 0 | |||||
| 2026-02-17 | 13F | Punch & Associates Investment Management, Inc. | 971 790 | −11,45 | 34 052 | 1,07 | ||||
| 2026-02-18 | 13F | Garton & Associates Financial Advisors LLC | 5 993 | 210 | ||||||
| 2026-01-29 | 13F | Sanctuary Advisors, LLC | 0 | −100,00 | 0 | −100,00 | ||||
| 2026-02-10 | 13F | Moors & Cabot, Inc. | 82 250 | −1,67 | 2 882 | 12,23 | ||||
| 2026-02-11 | 13F | Jpmorgan Chase & Co | 90 712 | −46,11 | 3 179 | −38,49 | ||||
| 2026-03-04 | 13F | Leonteq Securities AG | 0 | −100,00 | 0 | |||||
| 2026-02-17 | 13F | Point72 Asset Management, L.P. | 218 076 | 1 374,38 | 7 641 | 1 583,04 | ||||
| 2026-01-30 | 13F | ARGA Investment Management, LP | 53 602 | 0,00 | 1 878 | 14,16 | ||||
| 2026-01-28 | 13F | Kingswood Wealth Advisors, Llc | 7 774 | 272 | ||||||
| 2026-02-12 | 13F | Wealthspire Advisors, LLC | 0 | −100,00 | 0 | |||||
| 2026-02-13 | 13F | Marshall Wace, Llp | 0 | −100,00 | 0 | −100,00 | ||||
| 2026-01-21 | 13F | Flagship Harbor Advisors, Llc | 77 | 3 | ||||||
| 2026-02-17 | 13F | MIRAE ASSET GLOBAL ETFS HOLDINGS Ltd. | 616 262 | 1,46 | 21 594 | 15,80 | ||||
| 2026-02-13 | 13F | Toroso Investments, LLC | 14 365 | −18,08 | 503 | −6,51 | ||||
| 2026-01-23 | 13F | Avion Wealth | 700 | −46,15 | 0 | |||||
| 2026-01-13 | 13F | Kathmere Capital Management, LLC | 7 892 | 15,28 | 277 | 31,43 | ||||
| 2026-02-06 | 13F | Gsa Capital Partners Llp | 50 016 | 39,70 | 2 | 0,00 | ||||
| 2026-02-13 | 13F | MAI Capital Management | 1 545 | 0,00 | 54 | 14,89 | ||||
| 2026-02-17 | 13F | Verdad Advisers, LP | 24 533 | 860 | ||||||
| 2025-11-13 | 13F | Total Investment Management Inc | 0 | −100,00 | 0 | |||||
| 2026-01-28 | 13F | U S Global Investors Inc | 5 834 | −1,22 | 204 | 12,71 | ||||
| 2025-11-14 | 13F | Cubist Systematic Strategies, LLC | 153 465 | 4 711 | ||||||
| 2026-02-12 | 13F | Jane Street Group, Llc | 16 566 | −47,68 | 580 | −40,33 | ||||
| 2026-02-12 | 13F | Jane Street Group, Llc | Put | 12 100 | 424 | |||||
| 2026-02-13 | 13F | Walleye Capital LLC | Put | 2 100 | −74,07 | 74 | −70,56 | |||
| 2026-02-11 | 13F | Deutsche Bank Ag\ | 77 350 | 2 710 | ||||||
| 2026-02-12 | 13F | Jane Street Group, Llc | Call | 49 800 | 33,16 | 1 745 | 51,92 | |||
| 2026-02-13 | 13F | Walleye Capital LLC | 4 063 | 1 983,59 | 142 | 2 740,00 | ||||
| 2026-02-13 | 13F | Walleye Capital LLC | Call | 8 600 | 115,00 | 301 | 146,72 | |||
| 2025-11-14 | 13F | Point72 Europe (London) LLP | 361 | 11 | ||||||
| 2026-02-09 | 13F | Jefferies Financial Group Inc. | 13 787 | 0,00 | 483 | 14,18 | ||||
| 2026-04-21 | 13F | Robeco Institutional Asset Management B.V. | 11 714 | 436 | ||||||
| 2026-02-12 | 13F | Steward Partners Investment Advisory, Llc | 2 124 | 0,00 | 74 | 13,85 | ||||
| 2026-02-13 | 13F | Rhumbline Advisers | 70 | −57,83 | 2 | −60,00 | ||||
| 2026-02-17 | 13F | Two Sigma Investments, Lp | 686 135 | 9,47 | 24 042 | 24,95 | ||||
| 2026-02-17 | 13F | Citadel Advisors Llc | Put | 111 800 | 128,63 | 3 917 | 160,96 | |||
| 2026-02-17 | 13F | Voloridge Investment Management, Llc | 207 092 | 17,99 | 7 257 | 34,67 | ||||
| 2026-04-27 | 13F | Td Private Client Wealth Llc | 605 | −0,66 | 23 | 4,76 | ||||
| 2026-02-10 | 13F | JTC Employer Solutions Trusteee Ltd | 363 258 | 0,00 | 13 | 9,09 | ||||
| 2026-02-11 | 13F | O'shaughnessy Asset Management, Llc | 74 335 | −14,03 | 2 605 | −1,88 | ||||
| 2026-02-17 | 13F | Susquehanna International Group, Llp | Call | 124 200 | 45,77 | 4 352 | 66,39 | |||
| 2026-02-03 | 13F | Wulff, Hansen & Co. | 6 805 | 238 | ||||||
| 2026-02-11 | 13F | Strategic Advocates LLC | 650 | 0,00 | 23 | 15,79 | ||||
| 2026-02-17 | 13F | Citadel Advisors Llc | Call | 90 100 | −39,24 | 3 157 | −30,65 | |||
| 2026-02-13 | 13F | Marnell Management LLC | 6 515 | 228 | ||||||
| 2026-02-17 | 13F | Citadel Advisors Llc | 86 746 | −55,94 | 3 040 | −49,72 | ||||
| 2026-02-17 | 13F | Balyasny Asset Management Llc | 28 506 | 82,88 | 999 | 108,79 | ||||
| 2026-02-17 | 13F | Susquehanna International Group, Llp | Put | 40 200 | −59,68 | 1 409 | −53,99 | |||
| 2026-02-06 | 13F | GPS Wealth Strategies Group, LLC | 0 | −100,00 | 0 | |||||
| 2026-04-27 | 13F | Wealthstar Advisors, Llc | 16 732 | 623 | ||||||
| 2026-02-05 | 13F | Allworth Financial LP | 2 470 | −0,20 | 87 | 14,67 | ||||
| 2026-02-12 | 13F | New York State Common Retirement Fund | 50 122 | 0,00 | 1 756 | 14,17 | ||||
| 2026-02-12 | 13F | CIBC Private Wealth Group, LLC | 1 | 0 | ||||||
| 2026-04-07 | 13F | Signaturefd, Llc | 2 146 | 24,91 | 80 | 31,67 | ||||
| 2026-02-11 | 13F | Simplex Trading, Llc | 8 005 | −47,46 | 280 | |||||
| 2026-02-11 | 13F | Simplex Trading, Llc | Call | 7 900 | −21,00 | 277 | ||||
| 2026-02-11 | 13F | Simplex Trading, Llc | Put | 29 800 | −9,70 | 1 044 | 104 300,00 | |||
| 2026-02-06 | 13F | EverSource Wealth Advisors, LLC | 1 057 | 6,88 | 37 | 23,33 | ||||
| 2025-11-10 | 13F | Novem Group | 0 | −100,00 | 0 | −100,00 | ||||
| 2026-02-12 | 13F | Brown Brothers Harriman & Co | 0 | −100,00 | 0 | |||||
| 2026-04-23 | 13F | American National Bank | 1 583 | 59 | ||||||
| 2026-02-13 | 13F | Kestra Advisory Services, LLC | 0 | −100,00 | 0 | |||||
| 2026-04-15 | 13F | Exchange Traded Concepts, Llc | 6 025 | −18,44 | 224 | −13,18 | ||||
| 2026-02-05 | 13F | Cambridge Investment Research Advisors, Inc. | 8 073 | −5,06 | 0 | |||||
| 2026-02-12 | 13F | Quadrant Capital Group Llc | 13 223 | 21,26 | 463 | 38,62 | ||||
| 2026-02-17 | 13F | Man Group plc | 90 020 | 7,71 | 3 154 | 22,96 | ||||
| 2026-02-11 | 13F | Donald Smith & Co., Inc. | 2 088 499 | 73 181 | ||||||
| 2026-02-11 | 13F | Metis Global Partners, LLC | 21 377 | 0,00 | 749 | 14,18 | ||||
| 2025-11-14 | 13F/A | Skopos Labs, Inc. | 0 | −100,00 | 0 | −100,00 | ||||
| 2026-02-11 | 13F | Allianz Asset Management GmbH | 339 777 | 3,69 | 11 906 | 18,34 | ||||
| 2026-03-12 | 13F/A | Peak6 Llc | Call | 76 900 | 45,09 | 2 695 | 65,58 | |||
| 2025-11-13 | 13F | Hsbc Holdings Plc | 0 | −100,00 | 0 | |||||
| 2026-04-20 | 13F | Provenance Wealth Advisors, LLC | 9 040 | 0,00 | 337 | 6,33 | ||||
| 2026-03-12 | 13F/A | Peak6 Llc | Put | 1 100 | 39 | |||||
| 2026-01-20 | 13F | Ethos Financial Group, LLC | 14 807 | 0,00 | 519 | 14,10 | ||||
| 2026-02-17 | 13F/A | RBF Capital, LLC | 437 463 | 0,00 | 15 329 | 14,13 | ||||
| 2025-11-21 | 13F | Nebula Research & Development LLC | 0 | −100,00 | 0 | −100,00 | ||||
| 2026-01-26 | 13F | Lansing Street Advisors | 6 669 | 1,72 | 234 | 15,92 | ||||
| 2026-02-11 | 13F | Parallel Advisors, LLC | 9 850 | 0,23 | 345 | 14,62 | ||||
| 2026-02-17 | 13F | Quantedge Capital Pte Ltd | 0 | −100,00 | 0 | |||||
| 2026-04-06 | 13F | Highline Wealth Partners Llc | 6 700 | −1,47 | 249 | 4,62 | ||||
| 2026-02-04 | 13F | D'Orazio & Associates, Inc. | 6 951 | −0,17 | 244 | 14,08 | ||||
| 2026-04-17 | 13F | Vermillion Wealth Management, Inc. | 380 | 0,00 | 14 | 7,69 | ||||
| 2026-04-14 | 13F | Prospera Financial Services Inc | 11 174 | 0,44 | 416 | 6,94 | ||||
| 2025-11-14 | 13F | ExodusPoint Capital Management, LP | 20 137 | 618 | ||||||
| 2026-02-17 | 13F | Cantor Fitzgerald, L. P. | 0 | −100,00 | 0 | −100,00 |
Other Listings
| US:GSL | 39,15 US$ |