Grundläggande statistik
| Institutionella ägare | 115 total, 115 long only, 0 short only, 0 long/short - change of −4,13% MRQ |
| Genomsnittlig portföljallokering | 0.1871 % - change of −9,68% MRQ |
| Institutionella aktier (lång) | 2 846 934 (ex 13D/G) - change of 0,09MM shares 3,10% MRQ |
| Institutionellt värde (lång) | $ 122 018 USD ($1000) |
Institutionellt ägande och aktieägare
Invesco Exchange-Traded Fund Trust II - Invesco S&P SmallCap Low Volatility ETF (US:XSLV) har 115 Institutionella ägare och aktieägare som har lämnat in 13D/G- eller 13F-formulär till Securities Exchange Commission (SEC). Dessa institut innehar totalt 2,846,934 aktier. Största aktieägare inkluderar Venturi Wealth Management, LLC, LPL Financial LLC, Armbruster Capital Management, Inc., UBS Group AG, Bank Of America Corp /de/, Brookstone Capital Management, Morgan Stanley, Commonwealth Equity Services, Llc, Wells Fargo & Company/mn, and Eagle Bluffs Wealth Management LLC .
Invesco Exchange-Traded Fund Trust II - Invesco S&P SmallCap Low Volatility ETF (ARCA:XSLV) Institutionell ägarstruktur visar institutioners och fonders nuvarande positioner i företaget, samt de senaste förändringarna i positionernas storlek. Större aktieägare kan vara enskilda investerare, fonder, hedgefonder eller institutioner. Bilaga 13D visar att investeraren äger (eller ägde) mer än 5% av företaget och avser (eller avsåg) att aktivt eftersträva en förändring av affärsstrategin. Schedule 13G indikerar en passiv investering på över 5%.
The share price as of September 11, 2025 is 47,77 / share. Previously, on September 11, 2024, the share price was 46,21 / share. This represents an increase of 3,38% over that period.

Fondsentimentets poäng
Fondsentimentet poängen(fka Ägarackumulation-poäng) visar vilka aktier som är mest köpta av fonder. Det är resultatet av en sofistikerad kvantitativ flerfaktormodell som identifierar företag med de högsta nivåerna av institutionell ackumulering. Poängsättningsmodellen använder en kombination av den totala ökningen av redovisade ägare, förändringarna i portföljallokeringarna för dessa ägare och andra mått. Siffran sträcker sig från 0 till 100, där högre siffror indikerar en högre nivå av ackumulering i förhållande till sina konkurrenter, och 50 är genomsnittet.
Uppdateringsfrekvens: Dagligen
Se Ownership Explorer, som innehåller en lista över de högst rankade företagen.
Institutionell sälj/köp-kvot
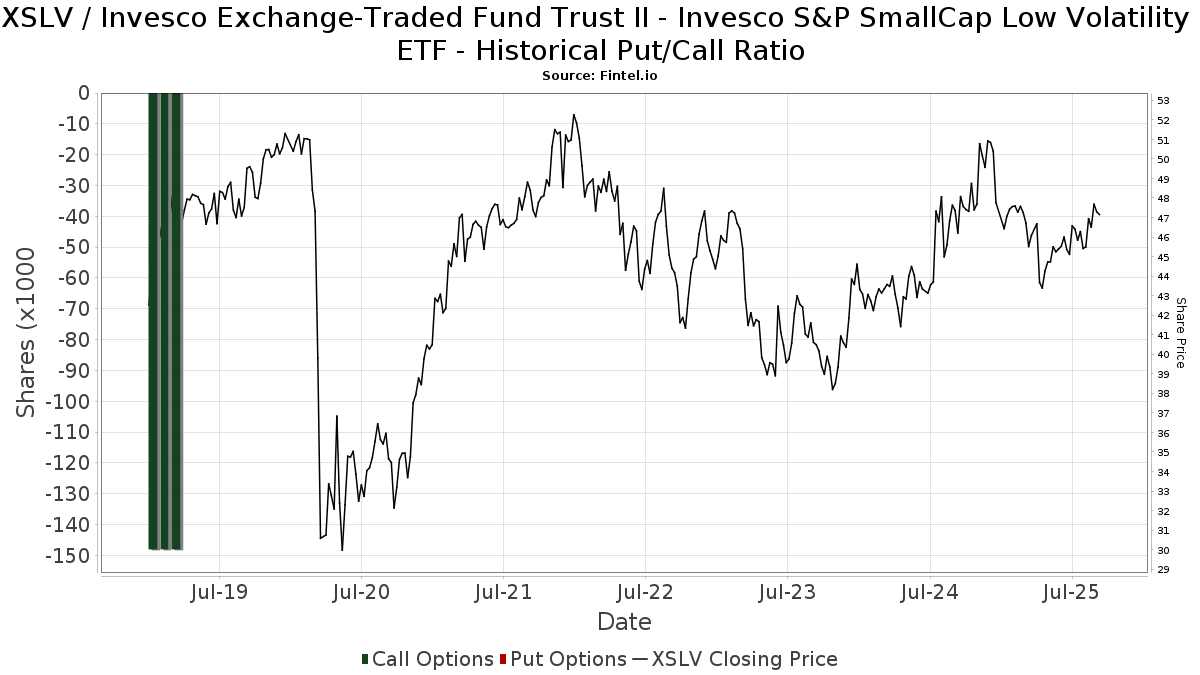
Förutom att rapportera vanliga eget kapital- och skuldemissioner måste institutioner med mer än 100MM tillgångar under förvaltning också avslöja sina innehav av sälj- och köpoptioner. Eftersom säljoptioner i allmänhet indikerar ett negativt sentiment och köpoptioner indikerar ett positivt sentiment, kan vi få en uppfattning om det övergripande institutionella sentimentet genom att plotta förhållandet mellan säljoptioner och köpoptioner. Diagrammet till höger visar det historiska förhållandet mellan sälj- och köpoptioner för detta instrument.
Genom att använda sälj/köp-kvoten som en indikator på aktieägarnas sentiment undviker man en av de största bristerna med att använda det totala institutionella ägandet, nämligen att en betydande del av de förvaltade tillgångarna investeras passivt för att följa index. Passivt förvaltade fonder köper vanligtvis inte optioner, så indikatorn för sälj/köp-kvoten ger en bättre bild av stämningen i aktivt förvaltade fonder.
13F- och NPORT-arkiveringar
Detaljer om 13F-arkiveringar är gratis. Detaljer om NP-arkiveringar kräver ett premiummedlemskap. Gröna rader indikerar nya positioner. Röda rader indikerar stängda positioner. Klicka på länk symbolen för att se hela transaktionshistoriken.
Uppgradera
för att låsa upp premiumdata och exportera till Excel ![]() .
.
| Fil Datum | Källa | Investerare | Typ | Genomsnittligt pris (beräknat) |
Aktier | Δ Aktier (%) |
Rapporterat värde (1000 USD) |
Δ Värde (%) |
Portföljallokering (%) |
|
|---|---|---|---|---|---|---|---|---|---|---|
| 2025-07-22 | 13F | Legacy Trust | 0 | −100,00 | 0 | |||||
| 2025-08-14 | 13F | Harwood Advisory Group, LLC | 121 | −47,84 | 6 | −50,00 | ||||
| 2025-07-18 | 13F | Truist Financial Corp | 17 412 | 0,95 | 793 | −0,38 | ||||
| 2025-07-24 | 13F | Baldwin Brothers Inc/ma | 16 586 | 0,01 | 755 | −1,31 | ||||
| 2025-08-14 | 13F | Goldman Sachs Group Inc | 12 841 | 48,55 | 585 | 46,37 | ||||
| 2025-07-17 | 13F | Janney Montgomery Scott LLC | 6 833 | −1,71 | 0 | |||||
| 2025-08-14 | 13F | Citadel Advisors Llc | 16 808 | 16,88 | 766 | 15,21 | ||||
| 2025-05-14 | 13F | Flow Traders U.s. Llc | 0 | −100,00 | 0 | |||||
| 2025-08-06 | 13F | Commonwealth Equity Services, Llc | 116 830 | −4,28 | 5 | 0,00 | ||||
| 2025-05-08 | 13F | Endeavor Private Wealth, Inc. | 0 | −100,00 | 0 | |||||
| 2025-08-14 | 13F | Qube Research & Technologies Ltd | 90 | 0,00 | 4 | 0,00 | ||||
| 2025-07-23 | 13F | Eagle Strategies LLC | 13 128 | 7,71 | 598 | 6,23 | ||||
| 2025-07-21 | 13F | Ameritas Advisory Services, LLC | 113 | 5 | ||||||
| 2025-07-25 | 13F | Hazlett, Burt & Watson, Inc. | 415 | −68,30 | 0 | |||||
| 2025-07-24 | 13F | Jfs Wealth Advisors, Llc | 158 | 0,00 | 7 | 0,00 | ||||
| 2025-08-14 | 13F | Warren Averett Asset Management, LLC | 4 881 | −2,01 | 222 | −3,06 | ||||
| 2025-08-08 | 13F | Capital Investment Advisory Services, LLC | 270 | 0,00 | 12 | 0,00 | ||||
| 2025-08-01 | 13F | Gwn Securities Inc. | 0 | −100,00 | 0 | |||||
| 2025-07-10 | 13F | Wealth Enhancement Advisory Services, Llc | 45 455 | −5,61 | 2 128 | −4,32 | ||||
| 2025-07-22 | 13F | Accel Wealth Management | 6 678 | 0,77 | 304 | −0,33 | ||||
| 2025-06-24 | NP | TNQIX - 1290 Retirement 2055 Fund Class I | 2 033 | 0,00 | 91 | −6,25 | ||||
| 2025-05-15 | 13F | Harvest Investment Services, LLC | 0 | −100,00 | 0 | |||||
| 2025-07-23 | 13F | Steel Peak Wealth Management LLC | 14 608 | 9,10 | 665 | 7,61 | ||||
| 2025-07-14 | 13F | Painted Porch Advisors LLC | 2 004 | −9,32 | 91 | −10,78 | ||||
| 2025-07-21 | 13F | Future Financial Wealth Managment LLC | 228 | 0,00 | 10 | 0,00 | ||||
| 2025-07-10 | 13F | American Financial Advisors, LLC | 9 447 | −4,62 | 430 | −5,91 | ||||
| 2025-04-11 | 13F | Procyon Private Wealth Partners, LLC | 0 | −100,00 | 0 | |||||
| 2025-08-14 | 13F | Raymond James Financial Inc | 27 028 | 2,68 | 1 231 | 1,32 | ||||
| 2025-07-24 | 13F | Blair William & Co/il | 42 | 0,00 | 2 | 0,00 | ||||
| 2025-07-30 | 13F | IMG Wealth Management, Inc. | 832 | 0,00 | 38 | −2,63 | ||||
| 2025-08-14 | 13F | Fmr Llc | 46 | −93,64 | 2 | −93,94 | ||||
| 2025-07-28 | 13F | Harbour Investments, Inc. | 58 431 | 1,74 | 2 662 | 0,38 | ||||
| 2025-08-05 | 13F | GHP Investment Advisors, Inc. | 200 | 0,00 | 9 | 0,00 | ||||
| 2025-09-04 | 13F/A | Advisor Group Holdings, Inc. | 21 925 | −10,39 | 999 | −11,59 | ||||
| 2025-08-07 | 13F | Allworth Financial LP | 19 | 0,00 | 1 | |||||
| 2025-06-24 | NP | TNWIX - 1290 Retirement 2050 Fund Class I | 1 982 | 0,00 | 89 | −6,38 | ||||
| 2025-05-01 | 13F | Quest 10 Wealth Builders, Inc. | 0 | −100,00 | 0 | |||||
| 2025-08-12 | 13F | Jpmorgan Chase & Co | 0 | −100,00 | 0 | |||||
| 2025-08-12 | 13F | AlphaCore Capital LLC | 150 | 7 | ||||||
| 2025-08-14 | 13F | Sunbelt Securities, Inc. | 5 | 0,00 | 0 | |||||
| 2025-08-14 | 13F | GWM Advisors LLC | 7 841 | 0,19 | 357 | −1,11 | ||||
| 2025-04-17 | 13F | Pacific Sun Financial Corp | 0 | −100,00 | 0 | |||||
| 2025-07-07 | 13F | Roxbury Financial LLC | 164 | 0,61 | 7 | 0,00 | ||||
| 2025-08-18 | 13F | Geneos Wealth Management Inc. | 6 026 | −1,16 | 274 | −2,49 | ||||
| 2025-08-15 | 13F | Kestra Advisory Services, LLC | 6 036 | −20,25 | 275 | −21,49 | ||||
| 2025-08-15 | 13F | Equitable Holdings, Inc. | 0 | −100,00 | 0 | |||||
| 2025-08-14 | 13F | Comerica Bank | 2 719 | 0,00 | 124 | −1,60 | ||||
| 2025-08-08 | 13F | Pnc Financial Services Group, Inc. | 761 | −72,78 | 35 | −73,64 | ||||
| 2025-08-12 | 13F | SRS Capital Advisors, Inc. | 473 | 0,42 | 22 | 0,00 | ||||
| 2025-08-14 | 13F | 10Elms LLP | 708 | −30,31 | 32 | −30,43 | ||||
| 2025-07-31 | 13F | Sage Mountain Advisors LLC | 6 750 | 0,00 | 307 | −1,29 | ||||
| 2025-08-11 | 13F | Wbi Investments, Inc. | 8 492 | 18,72 | 387 | 16,97 | ||||
| 2025-05-15 | 13F | Two Sigma Securities, Llc | 0 | −100,00 | 0 | |||||
| 2025-06-24 | NP | TNIIX - 1290 Retirement 2020 Fund Class I | 231 | 0,00 | 10 | −9,09 | ||||
| 2025-08-04 | 13F | HBK Sorce Advisory LLC | 6 675 | −30,76 | 304 | −31,69 | ||||
| 2025-07-10 | 13F | Sovran Advisors, LLC | 5 314 | 246 | ||||||
| 2025-06-24 | NP | TNLIX - 1290 Retirement 2035 Fund Class I | 757 | 0,00 | 34 | −8,33 | ||||
| 2025-08-12 | 13F | Global Retirement Partners, LLC | 4 540 | 0,73 | 207 | −2,83 | ||||
| 2025-05-16 | 13F/A | Kestra Investment Management, LLC | 0 | −100,00 | 0 | |||||
| 2025-08-12 | 13F | Steward Partners Investment Advisory, Llc | 1 685 | −5,60 | 77 | −7,32 | ||||
| 2025-08-14 | 13F | Mercer Global Advisors Inc /adv | 42 623 | −9,07 | 1 941 | −10,30 | ||||
| 2025-07-22 | 13F | McNaughton Wealth Management, LLC | 6 569 | 0,00 | 299 | −1,32 | ||||
| 2025-07-30 | 13F | Brookstone Capital Management | 201 484 | −5,40 | 9 178 | −6,68 | ||||
| 2025-08-13 | 13F | Rsm Us Wealth Management Llc | 5 463 | −17,20 | 249 | −18,42 | ||||
| 2025-08-14 | 13F | Snowden Capital Advisors LLC | 24 143 | 3,14 | 1 100 | 1,76 | ||||
| 2025-08-14 | 13F | Avant Capital LLC | 5 669 | −0,79 | 258 | −1,90 | ||||
| 2025-08-14 | 13F | Bank Of America Corp /de/ | 202 000 | 86,61 | 9 201 | 84,09 | ||||
| 2025-04-22 | 13F/A | NorthRock Partners, LLC | 0 | −100,00 | 0 | −100,00 | ||||
| 2025-08-12 | 13F | LPL Financial LLC | 239 598 | 4,32 | 10 914 | 2,90 | ||||
| 2025-08-13 | 13F | Russell Investments Group, Ltd. | 28 | 1 | ||||||
| 2025-08-14 | 13F | Mariner, LLC | 7 684 | 1,04 | 350 | −0,57 | ||||
| 2025-08-06 | 13F | AE Wealth Management LLC | 71 | 208,70 | 3 | 200,00 | ||||
| 2025-05-16 | 13F | Laidlaw Wealth Management LLC | 0 | −100,00 | 0 | |||||
| 2025-07-17 | 13F | Eagle Bluffs Wealth Management LLC | 86 617 | 0,99 | 3 945 | −0,38 | ||||
| 2025-07-11 | 13F | Farther Finance Advisors, LLC | 1 543 | 1,45 | 70 | 0,00 | ||||
| 2025-08-06 | 13F | Destiny Capital Corp/CO | 5 476 | 0,00 | 249 | −1,19 | ||||
| 2025-08-13 | 13F | Transce3nd, LLC | 825 | −4,73 | 38 | −5,13 | ||||
| 2025-07-14 | 13F | Southland Equity Partners LLC | 0 | −100,00 | 0 | |||||
| 2025-08-12 | 13F | SlateStone Wealth, LLC | 7 196 | −3,18 | 0 | |||||
| 2025-08-13 | 13F | SageView Advisory Group, LLC | 4 606 | −0,90 | 210 | −2,34 | ||||
| 2025-07-25 | 13F | Sequoia Financial Advisors, LLC | 30 985 | −66,46 | 1 411 | −66,92 | ||||
| 2025-08-12 | 13F | Jaffetilchin Investment Partners, LLC | 4 646 | 0,67 | 212 | −0,94 | ||||
| 2025-07-25 | 13F | Cwm, Llc | 2 574 | −12,75 | 0 | |||||
| 2025-08-14 | 13F | Wells Fargo & Company/mn | 109 954 | −4,58 | 5 008 | −5,86 | ||||
| 2025-08-13 | 13F | Jones Financial Companies Lllp | 44 536 | 32,74 | 2 031 | 32,16 | ||||
| 2025-05-08 | 13F | BRYN MAWR TRUST Co | 0 | −100,00 | 0 | |||||
| 2025-08-13 | 13F | Northwestern Mutual Wealth Management Co | 15 005 | 18,09 | 683 | 16,55 | ||||
| 2025-08-12 | 13F | Virtu Financial LLC | 21 747 | 1 | ||||||
| 2025-06-24 | NP | TNJIX - 1290 Retirement 2025 Fund Class I | 49 | −14,04 | 2 | 0,00 | ||||
| 2025-07-23 | 13F | Armbruster Capital Management, Inc. | 223 270 | 5,97 | 10 170 | 4,53 | ||||
| 2025-08-14 | 13F | Ameriprise Financial Inc | 21 411 | 12,40 | 975 | 10,92 | ||||
| 2025-07-17 | 13F | Symmetry Partners, LLC | 7 380 | 36,44 | 336 | 34,94 | ||||
| 2025-08-14 | 13F | Stifel Financial Corp | 5 022 | 13,47 | 229 | 11,76 | ||||
| 2025-07-17 | 13F | Sound Income Strategies, LLC | 12 | −72,73 | 1 | −100,00 | ||||
| 2025-08-11 | 13F | Citigroup Inc | 0 | −100,00 | 0 | |||||
| 2025-06-24 | NP | TNKIX - 1290 Retirement 2030 Fund Class I | 620 | 0,00 | 28 | −6,90 | ||||
| 2025-05-06 | 13F | Assetmark, Inc | 0 | −100,00 | 0 | |||||
| 2025-07-24 | 13F | Ronald Blue Trust, Inc. | 37 | 0,00 | 2 | 0,00 | ||||
| 2025-08-08 | 13F | Sculati Wealth Management, LLC | 64 571 | −67,44 | 2 941 | −67,88 | ||||
| 2025-08-14 | 13F | Royal Bank Of Canada | 67 496 | −1,24 | 3 074 | −2,60 | ||||
| 2025-08-14 | 13F | Susquehanna International Group, Llp | 22 028 | 1 003 | ||||||
| 2025-07-31 | 13F | Cambridge Investment Research Advisors, Inc. | 11 873 | −0,53 | 1 | |||||
| 2025-08-06 | 13F | Adviser Investments LLC | 0 | −100,00 | 0 | |||||
| 2025-06-24 | NP | TNOIX - 1290 Retirement 2045 Fund Class I | 1 785 | 0,00 | 80 | −7,06 | ||||
| 2025-08-12 | 13F | PSI Advisors, LLC | 0 | −100,00 | 0 | |||||
| 2025-07-17 | 13F | Vermillion Wealth Management, Inc. | 36 | 0,00 | 2 | 0,00 | ||||
| 2025-08-01 | 13F | Envestnet Asset Management Inc | 56 910 | 1,53 | 2 592 | 0,15 | ||||
| 2025-08-08 | 13F | Larson Financial Group LLC | 21 | 0,00 | 1 | |||||
| 2025-08-06 | 13F | Golden State Wealth Management, LLC | 180 | −20,35 | 8 | −20,00 | ||||
| 2025-07-16 | 13F/A | CX Institutional | 316 | 0,00 | 0 | |||||
| 2025-07-31 | 13F | Jackson Hole Capital Partners, LLC | 1 922 | 0,00 | 88 | −1,14 | ||||
| 2025-08-12 | 13F | O'shaughnessy Asset Management, Llc | 1 | 0,00 | 0 | |||||
| 2025-05-16 | 13F | Coppell Advisory Solutions LLC | 0 | −100,00 | 0 | |||||
| 2025-07-23 | 13F | Venturi Wealth Management, LLC | 245 703 | 11 192 | ||||||
| 2025-08-08 | 13F | Cetera Investment Advisers | 35 384 | 1,91 | 1 612 | 0,50 | ||||
| 2025-08-12 | 13F | Proequities, Inc. | 0 | 0 | ||||||
| 2025-08-18 | 13F | Front Row Advisors LLC | 225 | 0,00 | 10 | 0,00 | ||||
| 2025-07-07 | 13F | RDA Financial Network | 5 803 | −19,41 | 264 | −20,48 | ||||
| 2025-07-21 | 13F | DHJJ Financial Advisors, Ltd. | 36 | 0,00 | 2 | 0,00 | ||||
| 2025-08-13 | 13F | Invesco Ltd. | 6 782 | 14,25 | 309 | 12,41 | ||||
| 2025-08-14 | 13F | Hrt Financial Lp | 0 | −100,00 | 0 | |||||
| 2025-05-20 | 13F | Belpointe Asset Management LLC | 0 | −100,00 | 0 | −100,00 | ||||
| 2025-07-11 | 13F | Pinnacle Bancorp, Inc. | 0 | −100,00 | 0 | |||||
| 2025-08-11 | 13F | Private Advisor Group, LLC | 29 657 | −2,79 | 1 351 | −4,12 | ||||
| 2025-08-14 | 13F | Two Sigma Investments, Lp | 61 300 | 68,87 | 2 792 | 66,59 | ||||
| 2025-07-14 | 13F | Ridgewood Investments LLC | 2 866 | 0,00 | 131 | −1,52 | ||||
| 2025-07-14 | 13F | U.S. Capital Wealth Advisors, LLC | 45 387 | 26,31 | 2 067 | 24,59 | ||||
| 2025-08-04 | 13F | Spire Wealth Management | 0 | −100,00 | 0 | |||||
| 2025-08-14 | 13F | UBS Group AG | 222 473 | 4,23 | 10 134 | 2,82 | ||||
| 2025-08-04 | 13F | Arkadios Wealth Advisors | 12 063 | −1,55 | 549 | −2,83 | ||||
| 2025-06-24 | NP | TNNIX - 1290 Retirement 2040 Fund Class I | 1 577 | 0,00 | 71 | −6,67 | ||||
| 2025-07-31 | 13F | City State Bank | 426 | 0,00 | 19 | 0,00 | ||||
| 2025-08-05 | 13F | Huntington National Bank | 0 | |||||||
| 2025-05-05 | 13F | Lindbrook Capital, Llc | 167 | 0,00 | 8 | 0,00 | ||||
| 2025-07-29 | 13F | Private Trust Co Na | 2 709 | 0,00 | 123 | −1,60 | ||||
| 2025-08-12 | 13F | Laurel Wealth Advisors LLC | 593 | 4 461,54 | 0 | |||||
| 2025-08-15 | 13F | Morgan Stanley | 131 701 | −2,47 | 5 999 | −3,79 | ||||
| 2025-04-14 | 13F | Miracle Mile Advisors, LLC | 0 | −100,00 | 0 | −100,00 | ||||
| 2025-08-12 | 13F | MAI Capital Management | 377 | 0,00 | 17 | 0,00 | ||||
| 2025-08-14 | 13F | Mml Investors Services, Llc | 0 | −100,00 | 0 | |||||
| 2025-08-08 | 13F | Avantax Advisory Services, Inc. | 18 576 | 0,56 | 846 | −0,82 | ||||
| 2025-08-14 | 13F | Jane Street Group, Llc | 0 | −100,00 | 0 | |||||
| 2025-07-30 | 13F | Bogart Wealth, LLC | 73 | 1,39 | 3 | 0,00 | ||||
| 2025-04-28 | 13F | Strategic Financial Concepts, LLC | 0 | −100,00 | 0 | −100,00 | ||||
| 2025-08-08 | 13F | Kingsview Wealth Management, LLC | 10 136 | −2,65 | 462 | −3,96 | ||||
| 2025-08-08 | 13F | Cedar Wealth Management, LLC | 167 | 0,00 | 8 | 0,00 |