Grundläggande statistik
| Institutionella ägare | 78 total, 78 long only, 0 short only, 0 long/short - change of −5,95% MRQ |
| Genomsnittlig portföljallokering | 0.1693 % - change of −1,87% MRQ |
| Institutionella aktier (lång) | 4 027 517 (ex 13D/G) - change of −0,33MM shares −7,47% MRQ |
| Institutionellt värde (lång) | $ 91 582 USD ($1000) |
Institutionellt ägande och aktieägare
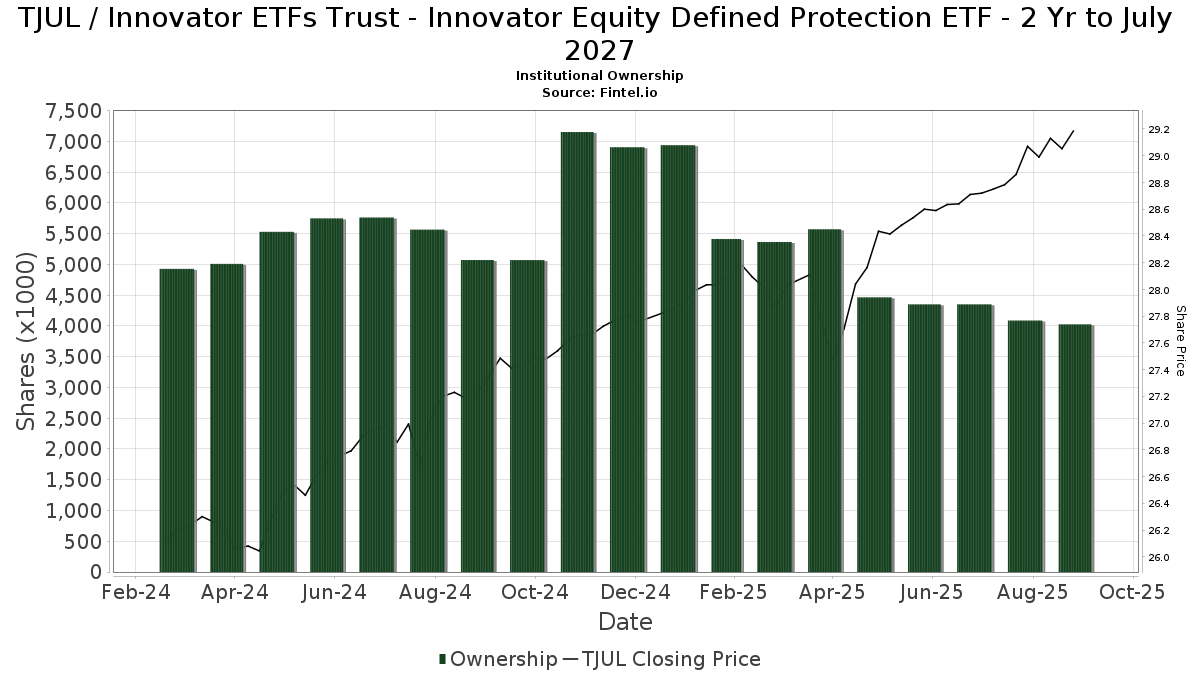
Innovator ETFs Trust - Innovator Equity Defined Protection ETF - 2 Yr to July 2027 (US:TJUL) har 78 Institutionella ägare och aktieägare som har lämnat in 13D/G- eller 13F-formulär till Securities Exchange Commission (SEC). Dessa institut innehar totalt 4,027,517 aktier. Största aktieägare inkluderar Gradient Investments LLC, Commonwealth Equity Services, Llc, Vishria Bird Financial Group, LLC, Bullseye Investment Management, LLC, Mattson Financial Services, LLC, Brown Financial Advisors, Kfg Wealth Management, Llc, Advisor Group Holdings, Inc., Cambridge Investment Research Advisors, Inc., and Kestra Advisory Services, LLC .
Innovator ETFs Trust - Innovator Equity Defined Protection ETF - 2 Yr to July 2027 (BATS:TJUL) Institutionell ägarstruktur visar institutioners och fonders nuvarande positioner i företaget, samt de senaste förändringarna i positionernas storlek. Större aktieägare kan vara enskilda investerare, fonder, hedgefonder eller institutioner. Bilaga 13D visar att investeraren äger (eller ägde) mer än 5% av företaget och avser (eller avsåg) att aktivt eftersträva en förändring av affärsstrategin. Schedule 13G indikerar en passiv investering på över 5%.
The share price as of September 12, 2025 is 29,29 / share. Previously, on September 16, 2024, the share price was 27,34 / share. This represents an increase of 7,13% over that period.
Fondsentimentets poäng
Fondsentimentet poängen(fka Ägarackumulation-poäng) visar vilka aktier som är mest köpta av fonder. Det är resultatet av en sofistikerad kvantitativ flerfaktormodell som identifierar företag med de högsta nivåerna av institutionell ackumulering. Poängsättningsmodellen använder en kombination av den totala ökningen av redovisade ägare, förändringarna i portföljallokeringarna för dessa ägare och andra mått. Siffran sträcker sig från 0 till 100, där högre siffror indikerar en högre nivå av ackumulering i förhållande till sina konkurrenter, och 50 är genomsnittet.
Uppdateringsfrekvens: Dagligen
Se Ownership Explorer, som innehåller en lista över de högst rankade företagen.
Institutionell sälj/köp-kvot
Förutom att rapportera vanliga eget kapital- och skuldemissioner måste institutioner med mer än 100MM tillgångar under förvaltning också avslöja sina innehav av sälj- och köpoptioner. Eftersom säljoptioner i allmänhet indikerar ett negativt sentiment och köpoptioner indikerar ett positivt sentiment, kan vi få en uppfattning om det övergripande institutionella sentimentet genom att plotta förhållandet mellan säljoptioner och köpoptioner. Diagrammet till höger visar det historiska förhållandet mellan sälj- och köpoptioner för detta instrument.
Genom att använda sälj/köp-kvoten som en indikator på aktieägarnas sentiment undviker man en av de största bristerna med att använda det totala institutionella ägandet, nämligen att en betydande del av de förvaltade tillgångarna investeras passivt för att följa index. Passivt förvaltade fonder köper vanligtvis inte optioner, så indikatorn för sälj/köp-kvoten ger en bättre bild av stämningen i aktivt förvaltade fonder.
13F- och NPORT-arkiveringar
Detaljer om 13F-arkiveringar är gratis. Detaljer om NP-arkiveringar kräver ett premiummedlemskap. Gröna rader indikerar nya positioner. Röda rader indikerar stängda positioner. Klicka på länk symbolen för att se hela transaktionshistoriken.
Uppgradera
för att låsa upp premiumdata och exportera till Excel ![]() .
.
| Fil Datum | Källa | Investerare | Typ | Genomsnittligt pris (beräknat) |
Aktier | Δ Aktier (%) |
Rapporterat värde (1000 USD) |
Δ Värde (%) |
Portföljallokering (%) |
|
|---|---|---|---|---|---|---|---|---|---|---|
| 2025-08-08 | 13F | Cetera Investment Advisers | 44 128 | −5,80 | 1 266 | −3,65 | ||||
| 2025-08-06 | 13F | AE Wealth Management LLC | 15 560 | 3,33 | 446 | 5,69 | ||||
| 2025-05-15 | 13F | Captrust Financial Advisors | 0 | −100,00 | 0 | |||||
| 2025-08-01 | 13F | Envestnet Asset Management Inc | 34 617 | 1,01 | 993 | 3,33 | ||||
| 2025-05-09 | 13F | Atria Wealth Solutions, Inc. | 0 | −100,00 | 0 | |||||
| 2025-08-08 | 13F | Foundations Investment Advisors, LLC | 0 | −100,00 | 0 | |||||
| 2025-07-08 | 13F | Gradient Investments LLC | 933 296 | −1,10 | 26 776 | 1,12 | ||||
| 2025-08-11 | 13F | Plotkin Financial Advisors, LLC | 10 987 | −22,39 | 315 | −20,65 | ||||
| 2025-07-21 | 13F | Patriot Financial Group Insurance Agency, LLC | 7 300 | 0,00 | 209 | 2,45 | ||||
| 2025-08-11 | 13F | Atlantic Private Wealth, LLC | 0 | −100,00 | 0 | |||||
| 2025-08-14 | 13F | Citadel Advisors Llc | 0 | −100,00 | 0 | |||||
| 2025-08-14 | 13F | Colony Group, LLC | 16 866 | 0,00 | 484 | 2,11 | ||||
| 2025-08-13 | 13F | Maia Wealth LLC | 13 763 | −0,95 | 395 | 2,60 | ||||
| 2025-08-13 | 13F | BCJ Capital Management, LLC | 28 469 | −1,31 | 817 | 0,87 | ||||
| 2025-07-31 | 13F | Cambridge Investment Research Advisors, Inc. | 95 760 | 0,75 | 3 | 0,00 | ||||
| 2025-08-14 | 13F | Raymond James Financial Inc | 5 488 | 157 | ||||||
| 2025-07-15 | 13F | Armis Advisers, LLC | 32 783 | 1,99 | 941 | 4,33 | ||||
| 2025-08-11 | 13F | Principal Securities, Inc. | 445 | −21,52 | 13 | −20,00 | ||||
| 2025-07-25 | 13F | We Are One Seven, LLC | 64 263 | −3,02 | 1 844 | −0,86 | ||||
| 2025-07-29 | 13F | Mattson Financial Services, LLC | 107 093 | −0,36 | 3 072 | 1,89 | ||||
| 2025-08-04 | 13F | Spire Wealth Management | 24 283 | −7,08 | 697 | −5,05 | ||||
| 2025-08-14 | 13F | CoreCap Advisors, LLC | 3 340 | 0,00 | 96 | 2,15 | ||||
| 2025-07-09 | 13F | Triumph Capital Management | 10 214 | 9,97 | 293 | 12,69 | ||||
| 2025-07-15 | 13F | Financial Management Professionals, Inc. | 17 | 0 | ||||||
| 2025-08-05 | 13F | Sigma Planning Corp | 8 337 | 0,00 | 239 | 2,58 | ||||
| 2025-05-12 | 13F | C2P Capital Advisory Group, LLC d.b.a. Prosperity Capital Advisors | 0 | −100,00 | 0 | |||||
| 2025-08-12 | 13F | Wood Tarver Financial Group, LLC | 4 988 | 0,00 | 0 | −100,00 | ||||
| 2025-07-08 | 13F | Parallel Advisors, LLC | 500 | 0,00 | 14 | 0,00 | ||||
| 2025-08-14 | 13F | Main Street Financial Solutions, LLC | 27 508 | 0,00 | 789 | 2,33 | ||||
| 2025-08-14 | 13F | Mml Investors Services, Llc | 24 490 | −15,99 | 1 | |||||
| 2025-08-12 | 13F | MAI Capital Management | 203 | 0,00 | 6 | 0,00 | ||||
| 2025-08-14 | 13F | Susquehanna International Group, Llp | 18 101 | −76,08 | 519 | −75,55 | ||||
| 2025-04-10 | 13F | Garrett Investment Advisors LLC | 0 | −100,00 | 0 | |||||
| 2025-07-23 | 13F | Kingswood Wealth Advisors, Llc | 35 548 | −1,26 | 1 020 | 0,89 | ||||
| 2025-08-08 | 13F/A | Sterling Capital Management LLC | 123 | 0,00 | 4 | 0,00 | ||||
| 2025-08-14 | 13F | Old Mission Capital Llc | 59 697 | 1 713 | ||||||
| 2025-08-06 | 13F | Vantage Financial Partners, LLC | 20 638 | 0,00 | 592 | 2,25 | ||||
| 2025-08-07 | 13F | Investment Management Corp /va/ /adv | 2 317 | 0,00 | 66 | 1,54 | ||||
| 2025-08-05 | 13F | Bank Of Montreal /can/ | 1 500 | 43 | ||||||
| 2025-08-06 | 13F | Commonwealth Equity Services, Llc | 683 501 | −1,46 | 20 | 0,00 | ||||
| 2025-08-11 | 13F | HighTower Advisors, LLC | 35 672 | −0,65 | 1 023 | 1,59 | ||||
| 2025-07-23 | 13F | Castle Rock Wealth Management, LLC | 10 625 | 0,00 | 306 | 2,35 | ||||
| 2025-08-04 | 13F | Amplius Wealth Advisors, LLC | 8 432 | 0,00 | 242 | 2,12 | ||||
| 2025-08-14 | 13F | Sunbelt Securities, Inc. | 14 490 | 1,15 | 402 | 0,25 | ||||
| 2025-04-11 | 13F | Pinnacle Wealth Management Group, Inc. | 0 | −100,00 | 0 | |||||
| 2025-08-14 | 13F | Jane Street Group, Llc | 23 117 | 663 | ||||||
| 2025-05-13 | 13F | Heck Capital Advisors, LLC | 0 | −100,00 | 0 | −100,00 | ||||
| 2025-08-08 | 13F | Kingsview Wealth Management, LLC | 11 089 | 0,00 | 318 | 2,25 | ||||
| 2025-05-14 | 13F | Change Path, LLC | 0 | −100,00 | 0 | |||||
| 2025-07-10 | 13F | Three Seasons Wealth, LLC | 10 452 | 0,00 | 300 | 2,05 | ||||
| 2025-07-07 | 13F | Vishria Bird Financial Group, LLC | 382 436 | −1,90 | 10 972 | 0,31 | ||||
| 2025-07-30 | 13F | Syntegra Private Wealth Group, LLC | 61 311 | 0,00 | 1 759 | 2,27 | ||||
| 2025-08-01 | 13F | FSA Advisors, Inc. | 0 | −100,00 | 0 | |||||
| 2025-08-11 | 13F | Lake Street Financial Llc | 32 515 | −10,44 | 933 | −8,45 | ||||
| 2025-08-29 | 13F | Centaurus Financial, Inc. | 3 900 | −91,00 | 0 | −100,00 | ||||
| 2025-07-09 | 13F | Fermata Advisors, LLC | 0 | −100,00 | 0 | |||||
| 2025-07-14 | 13F | AdvisorNet Financial, Inc | 4 020 | 0,00 | 115 | 2,68 | ||||
| 2025-05-14 | 13F | Huntington National Bank | 33 | 0,00 | ||||||
| 2025-08-15 | 13F | Brown Financial Advisors | 100 743 | −3,09 | 2 890 | −0,89 | ||||
| 2025-07-11 | 13F | Farther Finance Advisors, LLC | 29 370 | −0,01 | 843 | 2,43 | ||||
| 2025-07-25 | 13F | Prostatis Group LLC | 0 | −100,00 | 0 | |||||
| 2025-07-28 | 13F | Harbour Investments, Inc. | 13 850 | −43,35 | 397 | −42,13 | ||||
| 2025-07-29 | 13F | Stratos Wealth Advisors, LLC | 0 | −100,00 | 0 | |||||
| 2025-08-12 | 13F | Steward Partners Investment Advisory, Llc | 0 | −100,00 | 0 | |||||
| 2025-08-14 | 13F | Pine Harbor Wealth Management, LLC | 0 | −100,00 | 0 | |||||
| 2025-08-12 | 13F | Proequities, Inc. | 0 | 0 | ||||||
| 2025-08-13 | 13F | Capital Analysts, Inc. | 523 | 0,00 | 0 | |||||
| 2025-07-17 | 13F | Janney Montgomery Scott LLC | 9 794 | 0,00 | 0 | |||||
| 2025-07-14 | 13F | Kfg Wealth Management, Llc | 98 007 | −5,45 | 2 812 | −3,34 | ||||
| 2025-08-11 | 13F | Brass Tax Wealth Management, Inc | 32 900 | −0,06 | 944 | 2,17 | ||||
| 2025-08-04 | 13F | IFG Advisory, LLC | 10 160 | 291 | ||||||
| 2025-07-22 | 13F | Diligent Investors, LLC | 57 415 | 0,00 | 1 647 | 2,23 | ||||
| 2025-07-25 | 13F | Lion Street Advisors, LLC | 13 435 | 0,00 | 385 | 2,39 | ||||
| 2025-07-08 | 13F | Paladin Wealth, LLC | 19 100 | −2,43 | 548 | −0,36 | ||||
| 2025-08-12 | 13F | LPL Financial LLC | 59 119 | 13,57 | 1 696 | 16,16 | ||||
| 2025-04-15 | 13F | Noble Wealth Management PBC | 15 892 | −2,78 | 446 | −1,77 | ||||
| 2025-07-29 | 13F | AssuredPartners Investment Advisors, LLC | 0 | −100,00 | 0 | |||||
| 2025-07-30 | 13F | Strategic Blueprint, LLC | 11 350 | −93,27 | 326 | −93,14 | ||||
| 2025-07-24 | 13F | IFP Advisors, Inc | 4 645 | −17,05 | 133 | −15,29 | ||||
| 2025-08-12 | 13F | Global Retirement Partners, LLC | 100 | 0,00 | 3 | 0,00 | ||||
| 2025-09-04 | 13F/A | Advisor Group Holdings, Inc. | 96 123 | −5,94 | 2 758 | −3,84 | ||||
| 2025-07-10 | 13F | Wealth Enhancement Advisory Services, Llc | 24 400 | 0,00 | 701 | 2,34 | ||||
| 2025-07-30 | 13F | Brookstone Capital Management | 89 526 | −0,36 | 2 569 | 1,86 | ||||
| 2025-08-14 | 13F | UBS Group AG | 30 392 | 54,34 | 872 | 57,79 | ||||
| 2025-05-15 | 13F | SRS Capital Advisors, Inc. | 0 | −100,00 | 0 | |||||
| 2025-08-07 | 13F | Allworth Financial LP | 450 | 13 | ||||||
| 2025-08-04 | 13F | Assetmark, Inc | 38 | 0,00 | 1 | 0,00 | ||||
| 2025-08-08 | 13F | Capital Investment Advisory Services, LLC | 4 000 | 0,00 | 115 | 1,79 | ||||
| 2025-08-12 | 13F | Jpmorgan Chase & Co | 9 391 | −6,22 | 269 | −3,93 | ||||
| 2025-08-14 | 13F | Financial Network Wealth Advisors LLC | 1 331 | −6,99 | 38 | −5,00 | ||||
| 2025-08-14 | 13F | GWM Advisors LLC | 17 753 | −9,23 | 509 | −7,12 | ||||
| 2025-08-01 | 13F | Gwn Securities Inc. | 14 435 | −0,02 | 414 | 2,22 | ||||
| 2025-07-09 | 13F | Central Valley Advisors, Llc | 21 658 | 0,00 | 621 | 2,31 | ||||
| 2025-08-13 | 13F | Cerity Partners LLC | 0 | −100,00 | 0 | |||||
| 2025-08-06 | 13F | Bullseye Investment Management, LLC | 196 880 | 0,00 | 5 524 | 0,00 | ||||
| 2025-08-15 | 13F | Morgan Stanley | 1 548 | 0,00 | 44 | 2,33 | ||||
| 2025-08-15 | 13F | Kestra Advisory Services, LLC | 90 177 | 20,74 | 2 587 | 23,48 | ||||
| 2025-07-22 | 13F | Beacon Financial Advisory LLC | 11 930 | 0,00 | 342 | 2,40 | ||||
| 2025-07-15 | 13F | Accurate Wealth Management, LLC | 0 | −100,00 | 0 | |||||
| 2025-04-22 | 13F | Bright Futures Wealth Management, LLC. | 0 | −100,00 | 0 | |||||
| 2025-08-14 | 13F/A | Barclays Plc | 6 900 | −3,67 | 0 |