Grundläggande statistik
| Institutionella ägare | 126 total, 118 long only, 1 short only, 7 long/short - change of 1,59% MRQ |
| Genomsnittlig portföljallokering | 0.2338 % - change of 21,64% MRQ |
| Institutionella aktier (lång) | 35 380 157 (ex 13D/G) - change of 19,50MM shares 122,73% MRQ |
| Institutionellt värde (lång) | $ 870 611 USD ($1000) |
Institutionellt ägande och aktieägare
Direxion Shares ETF Trust - Direxion Daily Semiconductor Bull 3X Shares (US:SOXL) har 126 Institutionella ägare och aktieägare som har lämnat in 13D/G- eller 13F-formulär till Securities Exchange Commission (SEC). Dessa institut innehar totalt 35,380,157 aktier. Största aktieägare inkluderar Jane Street Group, Llc, Jane Street Group, Llc, Susquehanna International Group, Llp, Jane Street Group, Llc, Susquehanna International Group, Llp, Citadel Advisors Llc, Citadel Advisors Llc, UBS Group AG, Wolverine Trading, Llc, and Citadel Advisors Llc .
Direxion Shares ETF Trust - Direxion Daily Semiconductor Bull 3X Shares (ARCA:SOXL) Institutionell ägarstruktur visar institutioners och fonders nuvarande positioner i företaget, samt de senaste förändringarna i positionernas storlek. Större aktieägare kan vara enskilda investerare, fonder, hedgefonder eller institutioner. Bilaga 13D visar att investeraren äger (eller ägde) mer än 5% av företaget och avser (eller avsåg) att aktivt eftersträva en förändring av affärsstrategin. Schedule 13G indikerar en passiv investering på över 5%.
The share price as of September 11, 2025 is 29,17 / share. Previously, on September 12, 2024, the share price was 31,81 / share. This represents a decline of 8,30% over that period.

Fondsentimentets poäng
Fondsentimentet poängen(fka Ägarackumulation-poäng) visar vilka aktier som är mest köpta av fonder. Det är resultatet av en sofistikerad kvantitativ flerfaktormodell som identifierar företag med de högsta nivåerna av institutionell ackumulering. Poängsättningsmodellen använder en kombination av den totala ökningen av redovisade ägare, förändringarna i portföljallokeringarna för dessa ägare och andra mått. Siffran sträcker sig från 0 till 100, där högre siffror indikerar en högre nivå av ackumulering i förhållande till sina konkurrenter, och 50 är genomsnittet.
Uppdateringsfrekvens: Dagligen
Se Ownership Explorer, som innehåller en lista över de högst rankade företagen.
Institutionell sälj/köp-kvot
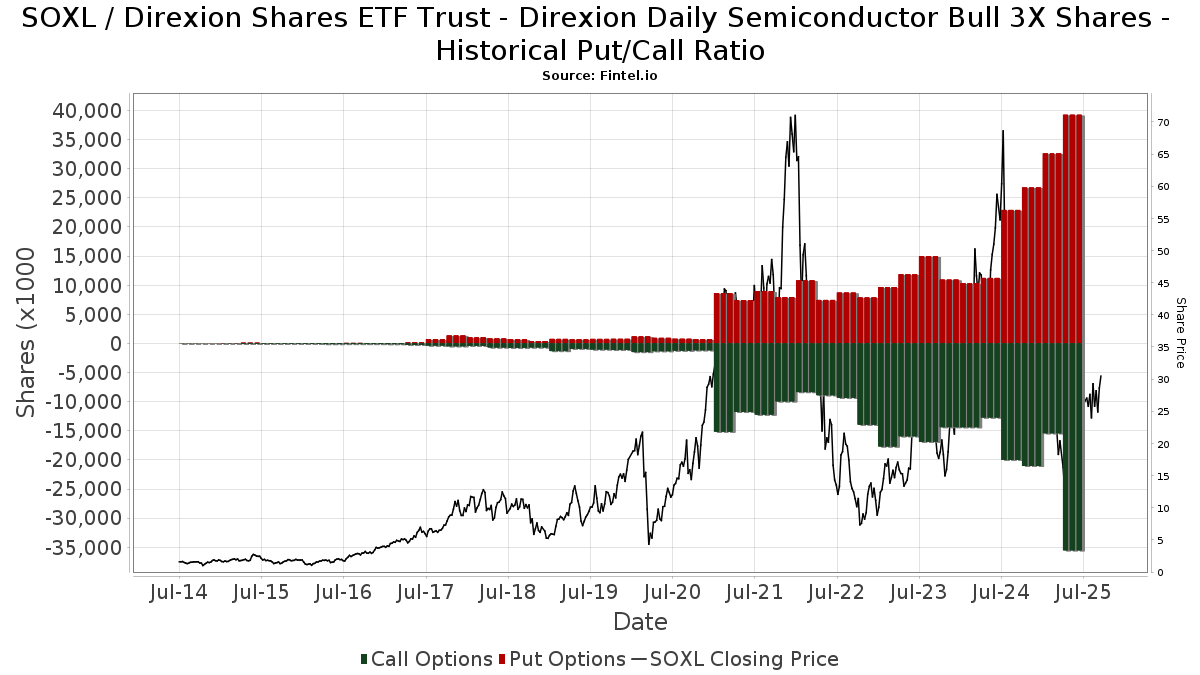
Förutom att rapportera vanliga eget kapital- och skuldemissioner måste institutioner med mer än 100MM tillgångar under förvaltning också avslöja sina innehav av sälj- och köpoptioner. Eftersom säljoptioner i allmänhet indikerar ett negativt sentiment och köpoptioner indikerar ett positivt sentiment, kan vi få en uppfattning om det övergripande institutionella sentimentet genom att plotta förhållandet mellan säljoptioner och köpoptioner. Diagrammet till höger visar det historiska förhållandet mellan sälj- och köpoptioner för detta instrument.
Genom att använda sälj/köp-kvoten som en indikator på aktieägarnas sentiment undviker man en av de största bristerna med att använda det totala institutionella ägandet, nämligen att en betydande del av de förvaltade tillgångarna investeras passivt för att följa index. Passivt förvaltade fonder köper vanligtvis inte optioner, så indikatorn för sälj/köp-kvoten ger en bättre bild av stämningen i aktivt förvaltade fonder.
13F- och NPORT-arkiveringar
Detaljer om 13F-arkiveringar är gratis. Detaljer om NP-arkiveringar kräver ett premiummedlemskap. Gröna rader indikerar nya positioner. Röda rader indikerar stängda positioner. Klicka på länk symbolen för att se hela transaktionshistoriken.
Uppgradera
för att låsa upp premiumdata och exportera till Excel ![]() .
.
| Fil Datum | Källa | Investerare | Typ | Genomsnittligt pris (beräknat) |
Aktier | Δ Aktier (%) |
Rapporterat värde (1000 USD) |
Δ Värde (%) |
Portföljallokering (%) |
|
|---|---|---|---|---|---|---|---|---|---|---|
| 2025-08-14 | 13F | Jane Street Group, Llc | Put | 18 951 400 | 85,23 | 475 870 | 191,61 | |||
| 2025-08-14 | 13F | Jane Street Group, Llc | Call | 10 139 600 | 144,05 | 254 605 | 284,21 | |||
| 2025-08-11 | 13F | HighTower Advisors, LLC | Call | 0 | −100,00 | 0 | ||||
| 2025-07-14 | 13F | Toth Financial Advisory Corp | 13 639 | −56,27 | 342 | −31,19 | ||||
| 2025-05-12 | 13F | Sandy Spring Bank | 120 | 2 | ||||||
| 2025-07-23 | 13F | Prime Capital Investment Advisors, LLC | 20 686 | 49,08 | 519 | 134,84 | ||||
| 2025-08-07 | 13F | Rathbone Brothers plc | 12 700 | −4,51 | 319 | 50,00 | ||||
| 2025-08-14 | 13F | Goldman Sachs Group Inc | 476 298 | 1 636,98 | 11 960 | 2 636,61 | ||||
| 2025-08-18 | 13F | 1248 Management, LLC | 600 | 100,00 | 15 | 275,00 | ||||
| 2025-08-01 | 13F | Stuart Chaussee & Associates, Inc. | 0 | −100,00 | 0 | |||||
| 2025-07-17 | 13F | Beacon Capital Management, LLC | 5 369 | 0,26 | 135 | 57,65 | ||||
| 2025-08-12 | 13F | Proequities, Inc. | 0 | 0 | ||||||
| 2025-07-22 | 13F | IMC-Chicago, LLC | 180 838 | 23,42 | 4 541 | 94,27 | ||||
| 2025-08-14 | 13F | Goldman Sachs Group Inc | Call | 151 700 | 3 809 | |||||
| 2025-07-11 | 13F | Farther Finance Advisors, LLC | 12 220 | 772,86 | 307 | 1 290,91 | ||||
| 2025-08-01 | 13F | Belvedere Trading LLC | 23 831 | −81,37 | 598 | −70,67 | ||||
| 2025-08-05 | 13F | Westwood Wealth Management | 304 070 | 31,49 | 7 635 | 107,02 | ||||
| 2025-08-12 | 13F | CIBC Private Wealth Group, LLC | 2 000 | −95,57 | 50 | −86,56 | ||||
| 2025-08-07 | 13F | Traynor Capital Management, Inc. | Call | 0 | −100,00 | 0 | −100,00 | |||
| 2025-08-11 | 13F | Gr Financial Group, Llc | 8 436 | 212 | ||||||
| 2025-04-22 | 13F/A | NorthRock Partners, LLC | 0 | −100,00 | 0 | |||||
| 2025-07-24 | 13F | PayPay Securities Corp | 4 136 | 8,87 | 104 | 71,67 | ||||
| 2025-08-14 | 13F | Elevatus Welath Management | 379 012 | 9 517 | ||||||
| 2025-07-30 | 13F | Drive Wealth Management, Llc | 0 | −100,00 | 0 | |||||
| 2025-05-16 | 13F | Coppell Advisory Solutions LLC | 0 | −100,00 | 0 | |||||
| 2025-08-04 | 13F | REDW Wealth LLC | 20 000 | 0,00 | 502 | 57,37 | ||||
| 2025-08-04 | 13F | Creative Financial Designs Inc /adv | 403 | 0,50 | 10 | 66,67 | ||||
| 2025-08-08 | 13F | Foundations Investment Advisors, LLC | 10 037 | 252 | ||||||
| 2025-07-24 | 13F | Us Bancorp \de\ | 245 | 0,00 | 6 | 100,00 | ||||
| 2025-08-11 | 13F | Citigroup Inc | 1 141 | −64,95 | 29 | −45,10 | ||||
| 2025-07-24 | 13F | Ronald Blue Trust, Inc. | 30 | 0,00 | 1 | |||||
| 2025-08-08 | 13F | Hartland & Co., LLC | 0 | −100,00 | 0 | −100,00 | ||||
| 2025-08-08 | 13F | Meridian Wealth Management, LLC | 26 601 | 164,48 | 668 | 316,88 | ||||
| 2025-07-14 | 13F | Westend Capital Management LLC | 86 | −43,42 | 2 | 0,00 | ||||
| 2025-08-13 | 13F | HAP Trading, LLC | 0 | −100,00 | 0 | −100,00 | ||||
| 2025-08-14 | 13F | Cantor Fitzgerald, L. P. | 13 112 | −14,96 | 329 | 34,29 | ||||
| 2025-07-30 | NP | DRAI - Draco Evolution AI ETF | 21 458 | 347 | ||||||
| 2025-08-14 | 13F | Snowden Capital Advisors LLC | 10 845 | 0,00 | 273 | 57,80 | ||||
| 2025-08-18 | 13F | Wolverine Trading, Llc | Call | 2 009 700 | 90,51 | 50 464 | 198,42 | |||
| 2025-08-18 | 13F | Wolverine Trading, Llc | 201 692 | −62,80 | 5 064 | −41,74 | ||||
| 2025-08-18 | 13F | Wolverine Trading, Llc | Put | 974 800 | 19,11 | 24 477 | 86,59 | |||
| 2025-05-12 | 13F | Addison Advisors LLC | 0 | −100,00 | 0 | |||||
| 2025-07-28 | 13F | Harbour Investments, Inc. | 8 132 | 0,00 | 204 | 58,14 | ||||
| 2025-07-07 | 13F | Versant Capital Management, Inc | 80 | 2 | ||||||
| 2025-08-14 | 13F | Qube Research & Technologies Ltd | 0 | −100,00 | 0 | |||||
| 2025-08-14 | 13F | Millennium Management Llc | Call | 83 700 | −26,39 | 2 102 | 15,89 | |||
| 2025-07-21 | 13F | Quent Capital, LLC | 0 | −100,00 | 0 | |||||
| 2025-07-17 | 13F | KG&L Capital Management,LLC | 0 | −100,00 | 0 | |||||
| 2025-08-14 | 13F | Millennium Management Llc | 71 435 | −76,51 | 1 794 | −63,04 | ||||
| 2025-05-22 | 13F/A | Rollins Financial Advisors, LLC | 0 | −100,00 | 0 | −100,00 | ||||
| 2025-05-12 | 13F | Virtu Financial LLC | 0 | −100,00 | 0 | |||||
| 2025-08-13 | 13F | Bank Of Nova Scotia | 12 780 | −51,02 | 322 | −22,41 | ||||
| 2025-08-14 | 13F | Jane Street Group, Llc | 19 254 061 | 15 753,49 | 483 469 | 24 859,68 | ||||
| 2025-04-17 | 13F | Variant Private Wealth, LLC | 0 | −100,00 | 0 | |||||
| 2025-08-11 | 13F | October Effect Ltd | 138 990 | 3 490 | ||||||
| 2025-07-29 | 13F | Stratos Wealth Advisors, LLC | 30 793 | 38,62 | 773 | 118,36 | ||||
| 2025-08-25 | 13F | BLVD Private Wealth, LLC | 9 856 | 247 | ||||||
| 2025-08-12 | 13F | Retirement Planning Co of New England, Inc. | 8 150 | 205 | ||||||
| 2025-07-30 | 13F | Bogart Wealth, LLC | 8 500 | 88,89 | 213 | 200,00 | ||||
| 2025-07-29 | 13F | Activest Wealth Management | 963 | 0,00 | 24 | 60,00 | ||||
| 2025-07-14 | 13F | Hoey Investments, Inc | 8 202 | −67,73 | 206 | −49,38 | ||||
| 2025-08-01 | 13F | Chilton Capital Management Llc | 750 | 0,00 | 19 | 63,64 | ||||
| 2025-08-14 | 13F | Torno Capital, Llc | Put | 1 168 100 | −36,49 | 29 331 | −0,02 | |||
| 2025-08-14 | 13F | Wells Fargo & Company/mn | 0 | 0 | ||||||
| 2025-07-15 | 13F | StoneCrest Wealth Management, Inc. | 10 417 | −12,52 | 262 | 38,10 | ||||
| 2025-08-14 | 13F | Bank Of America Corp /de/ | 174 241 | 75,25 | 4 375 | 176,03 | ||||
| 2025-08-13 | 13F | Avestar Capital, LLC | 264 996 | 232,86 | 6 654 | 424,35 | ||||
| 2025-08-13 | 13F | Summit Financial, LLC | 16 279 | 410 | ||||||
| 2025-08-18 | 13F | Hollencrest Capital Management | 200 | −82,65 | 5 | −72,22 | ||||
| 2025-08-14 | 13F | Torno Capital, Llc | 0 | −100,00 | 0 | −100,00 | ||||
| 2025-08-14 | 13F | Parallax Volatility Advisers, L.P. | 0 | −100,00 | 0 | |||||
| 2025-07-22 | 13F | Global Assets Advisory, LLC | 0 | −100,00 | 0 | −100,00 | ||||
| 2025-08-14 | 13F | Federation des caisses Desjardins du Quebec | 5 500 | 53,20 | 138 | 142,11 | ||||
| 2025-08-27 | 13F/A | Brinker Capital Investments, LLC | 65 992 | 1 657 | ||||||
| 2025-08-13 | 13F | Northwestern Mutual Wealth Management Co | 685 | 1,48 | 17 | 70,00 | ||||
| 2025-05-13 | 13F | Intrepid Financial Planning Group LLC | 0 | −100,00 | 0 | −100,00 | ||||
| 2025-05-05 | 13F | Lindbrook Capital, Llc | 9 500 | 555,17 | 152 | 287,18 | ||||
| 2025-08-14 | 13F | Raymond James Financial Inc | 1 000 | 25 | ||||||
| 2025-08-05 | 13F | Simplex Trading, Llc | 515 960 | −41,55 | 13 | −14,29 | ||||
| 2025-08-04 | 13F | Spire Wealth Management | 1 924 | −99,02 | 48 | −98,47 | ||||
| 2025-08-13 | 13F | Jump Financial, LLC | 417 726 | 10 489 | ||||||
| 2025-08-12 | 13F | Jpmorgan Chase & Co | 59 | −52,03 | 1 | 0,00 | ||||
| 2025-08-11 | 13F | HighTower Advisors, LLC | 26 358 | −66,37 | 662 | −47,12 | ||||
| 2025-07-28 | 13F | Copia Wealth Management | 2 054 | 0,00 | 52 | 59,38 | ||||
| 2025-07-22 | 13F | Merit Financial Group, LLC | 94 260 | −9,40 | 2 367 | 42,62 | ||||
| 2025-07-16 | 13F | Signaturefd, Llc | 3 650 | −18,89 | 92 | 28,17 | ||||
| 2025-05-15 | 13F | Prelude Capital Management, Llc | 0 | −100,00 | 0 | −100,00 | ||||
| 2025-08-12 | 13F | BlackRock, Inc. | 1 | 0 | ||||||
| 2025-08-14 | 13F | Hrt Financial Lp | 0 | −100,00 | 0 | |||||
| 2025-08-05 | 13F | Burney Co/ | Call | 20 000 | 3 | |||||
| 2025-08-06 | 13F | Prospera Financial Services Inc | 29 280 | 735 | ||||||
| 2025-08-05 | 13F | Burney Co/ | 9 653 | 242 | ||||||
| 2025-08-14 | 13F | Group One Trading, L.p. | 803 753 | 65,94 | 20 182 | 161,26 | ||||
| 2025-08-06 | 13F | CloudAlpha Capital Management Limited/Hong Kong | 903 100 | 22 677 | ||||||
| 2025-08-15 | 13F | CI Private Wealth, LLC | 31 601 | 1,47 | 794 | 59,88 | ||||
| 2025-07-08 | 13F | Parallel Advisors, LLC | 16 257 | 194,94 | 408 | 368,97 | ||||
| 2025-07-22 | 13F | Merit Financial Group, LLC | Call | 17 600 | 0,00 | 163 | 121,92 | |||
| 2025-08-14 | 13F | TCG Advisory Services, LLC | 13 000 | 326 | ||||||
| 2025-08-11 | 13F | Empowered Funds, LLC | 21 458 | 539 | ||||||
| 2025-08-11 | 13F | Rothschild Investment Llc | 0 | −100,00 | 0 | |||||
| 2025-08-14 | 13F | Gordian Capital Singapore Pte Ltd | 0 | −100,00 | 0 | |||||
| 2025-08-14 | 13F | Citadel Advisors Llc | Call | 5 800 400 | 194,84 | 145 648 | 364,17 | |||
| 2025-08-05 | 13F | Bank Of Montreal /can/ | 5 933 | 26,69 | 149 | 100,00 | ||||
| 2025-08-01 | 13F | May Hill Capital, LLC | 8 345 | 210 | ||||||
| 2025-08-14 | 13F | Royal Bank Of Canada | 0 | −100,00 | 0 | |||||
| 2025-08-08 | 13F | Capital Investment Counsel, Inc | 0 | −100,00 | 0 | |||||
| 2025-07-28 | 13F | Triton Wealth Management, PLLC | 51 806 | 1 327 | ||||||
| 2025-07-30 | 13F | Blume Capital Management, Inc. | 48 | 1 | ||||||
| 2025-08-13 | 13F/A | StoneX Group Inc. | 0 | −100,00 | 0 | −100,00 | ||||
| 2025-08-06 | 13F | Commonwealth Equity Services, Llc | 62 842 | 84,57 | 2 | |||||
| 2025-08-15 | 13F | Morgan Stanley | 223 780 | −57,49 | 5 619 | −33,08 | ||||
| 2025-08-13 | 13F | EverSource Wealth Advisors, LLC | 0 | −100,00 | 0 | |||||
| 2025-08-14 | 13F | Harwood Advisory Group, LLC | 77 | 108,11 | 2 | 0,00 | ||||
| 2025-08-05 | 13F | Optivise Advisory Services LLC | 17 956 | 36,07 | 451 | 114,29 | ||||
| 2025-08-14 | 13F | Citadel Advisors Llc | 1 995 633 | −40,85 | 50 110 | −6,88 | ||||
| 2025-08-14 | 13F | Citadel Advisors Llc | Put | 8 002 900 | −0,57 | 200 953 | 56,53 | |||
| 2025-08-08 | 13F | Larson Financial Group LLC | 242 | 6 | ||||||
| 2025-05-08 | 13F | Geneos Wealth Management Inc. | 0 | −100,00 | 0 | |||||
| 2025-08-08 | 13F | Pnc Financial Services Group, Inc. | 0 | −100,00 | 0 | |||||
| 2025-07-15 | 13F | Surience Private Wealth Llc | 52 217 | 1 311 | ||||||
| 2025-08-11 | 13F | Covestor Ltd | 5 385 | 200,84 | 0 | |||||
| 2025-08-12 | 13F | Steward Partners Investment Advisory, Llc | 0 | −100,00 | 0 | |||||
| 2025-04-22 | 13F | Cambridge Investment Research Advisors, Inc. | 0 | −100,00 | 0 | |||||
| 2025-07-07 | 13F | Thurston, Springer, Miller, Herd & Titak, Inc. | 34 538 | 1 626,90 | 867 | 2 696,77 | ||||
| 2025-08-14 | 13F | Summit Trail Advisors, Llc | 0 | −100,00 | 0 | |||||
| 2025-08-14 | 13F | Two Sigma Securities, Llc | 89 724 | 667,92 | 2 253 | 1 110,75 | ||||
| 2025-08-12 | 13F | Gladstone Institutional Advisory LLC | 15 071 | 378 | ||||||
| 2025-08-14 | 13F | GWM Advisors LLC | 10 755 | 270 | ||||||
| 2025-08-14 | 13F | Clarity Asset Management, Inc. | 73 | 0,00 | 2 | 0,00 | ||||
| 2025-08-14 | 13F | Banque Transatlantique SA | 0 | −100,00 | 0 | −100,00 | ||||
| 2025-07-31 | 13F | Optimum Investment Advisors | 1 300 | 550,00 | 33 | 966,67 | ||||
| 2025-04-29 | 13F | Raleigh Capital Management Inc. | 0 | −100,00 | 0 | |||||
| 2025-08-08 | 13F | SBI Securities Co., Ltd. | 1 669 259 | 46,06 | 41 915 | 129,95 | ||||
| 2025-08-14 | 13F/A | Barclays Plc | 17 701 | −70,40 | 0 | |||||
| 2025-08-19 | 13F | Anchor Investment Management, LLC | 1 030 | −24,54 | 26 | 19,05 | ||||
| 2025-08-12 | 13F | XTX Topco Ltd | 18 256 | −82,42 | 458 | −72,34 | ||||
| 2025-08-12 | 13F | Vestor Capital, Llc | 11 263 | 3 | ||||||
| 2025-08-14 | 13F | Integrated Wealth Concepts LLC | 60 286 | 1 514 | ||||||
| 2025-05-14 | 13F | Toroso Investments, LLC | Put | 0 | −100,00 | 0 | −100,00 | |||
| 2025-08-14 | 13F | Optiver Holding B.V. | 98 414 | −71,24 | 2 463 | −54,64 | ||||
| 2025-08-14 | 13F | Susquehanna International Group, Llp | 1 366 798 | 1 785,94 | 34 320 | 2 871,43 | ||||
| 2025-08-14 | 13F | Susquehanna International Group, Llp | Call | 15 697 300 | 134,18 | 394 159 | 268,66 | |||
| 2025-08-13 | 13F | Legacy Capital Wealth Partners, LLC | 0 | −100,00 | 0 | |||||
| 2025-08-14 | 13F | Susquehanna International Group, Llp | Put | 9 720 800 | −8,28 | 244 089 | 44,39 | |||
| 2025-08-14 | 13F | Parallax Volatility Advisers, L.P. | Put | 0 | −100,00 | 0 | ||||
| 2025-08-14 | 13F | Mariner, LLC | 78 979 | 48,84 | 1 983 | 134,40 | ||||
| 2025-08-27 | 13F/A | Squarepoint Ops LLC | 473 519 | 283,17 | 11 890 | 503,25 | ||||
| 2025-08-12 | 13F | Global Retirement Partners, LLC | 6 463 | 15 288,10 | 162 | 16 100,00 | ||||
| 2025-08-06 | 13F | Adviser Investments LLC | 10 365 | 0,00 | 260 | 57,58 | ||||
| 2025-04-14 | 13F | TB Alternative Assets Ltd. | 0 | −100,00 | 0 | |||||
| 2025-05-15 | 13F | Bank Of America Corp /de/ | Call | 0 | −100,00 | 0 | −100,00 | |||
| 2025-07-14 | 13F | Abound Wealth Management | 5 400 | 136 | ||||||
| 2025-08-27 | 13F/A | Squarepoint Ops LLC | Call | 29 700 | 0,00 | 746 | 57,51 | |||
| 2025-08-14 | 13F | Parallax Volatility Advisers, L.P. | Call | 0 | −100,00 | 0 | ||||
| 2025-08-27 | 13F/A | Squarepoint Ops LLC | Put | 165 400 | −5,05 | 4 153 | 49,50 | |||
| 2025-08-13 | 13F | Flow Traders U.s. Llc | 10 290 | 0 | ||||||
| 2025-05-12 | 13F | Fmr Llc | 0 | −100,00 | 0 | |||||
| 2025-07-15 | 13F | Main Street Group, LTD | 59 | 0,00 | 1 | |||||
| 2025-07-30 | 13F | Crewe Advisors LLC | 3 850 | 0,52 | 97 | 57,38 | ||||
| 2025-08-07 | 13F | Traynor Capital Management, Inc. | 1 092 236 | 25,93 | 26 989 | 95,09 | ||||
| 2025-08-07 | 13F | Allworth Financial LP | 301 | 0,00 | 8 | 133,33 | ||||
| 2025-08-14 | 13F | LMR Partners LLP | Call | 1 000 000 | 0,00 | 25 110 | 57,43 | |||
| 2025-05-13 | 13F | Quadrature Capital Ltd | 0 | −100,00 | 0 | |||||
| 2025-07-30 | 13F | St. Johns Investment Management Company, LLC | 4 468 | 55,14 | 112 | 148,89 | ||||
| 2025-07-23 | 13F | Vontobel Holding Ltd. | 0 | −100,00 | 0 | −100,00 | ||||
| 2025-08-14 | 13F | LM Advisors LLC | 20 000 | 0,00 | 1 | |||||
| 2025-08-14 | 13F | SIH Partners, LLLP | 10 792 | 271 | ||||||
| 2025-08-14 | 13F | UBS Group AG | 2 098 563 | −13,29 | 52 695 | 36,50 | ||||
| 2025-08-14 | 13F | DRW Securities, LLC | 14 096 | −60,59 | 354 | −38,07 | ||||
| 2025-08-13 | 13F | HAP Trading, LLC | Put | 81 000 | 153,92 | 103 | −37,20 | |||
| 2025-08-13 | 13F | HAP Trading, LLC | Call | 304 500 | 155,88 | 2 121 | 2 155,32 | |||
| 2025-05-07 | 13F | HB Wealth Management, LLC | 0 | −100,00 | 0 | |||||
| 2025-08-14 | 13F | EP Wealth Advisors, Inc. | 29 789 | 1,41 | 748 | 59,83 | ||||
| 2025-08-01 | 13F | Howard Capital Management Inc. | 197 439 | 98,83 | 4 964 | 213,58 | ||||
| 2025-08-15 | 13F | Morse Asset Management, Inc | 47 970 | 26,14 | 1 205 | 98,68 | ||||
| 2025-08-08 | 13F | Creative Planning | 33 622 | 25,02 | 844 | 97,20 | ||||
| 2025-05-13 | 13F | Claudia M.p. Batlle, Crp (r) Llc | 0 | −100,00 | 0 | |||||
| 2025-08-05 | 13F | X-Square Capital, LLC | 0 | −100,00 | 0 | |||||
| 2025-08-13 | 13F | M Holdings Securities, Inc. | 35 866 | 54,29 | 1 | |||||
| 2025-07-24 | 13F | IFP Advisors, Inc | 696 | 17 | ||||||
| 2025-08-08 | 13F | Smithfield Trust Co | 0 | −100,00 | 0 | |||||
| 2025-07-18 | 13F | NRI Wealth Management LC | 39 074 | 981 | ||||||
| 2025-08-14 | 13F | Visionary Wealth Advisors | 8 712 | −15,01 | 219 | 33,74 | ||||
| 2025-05-14 | 13F | Toroso Investments, LLC | 0 | −100,00 | 0 | −100,00 | ||||
| 2025-08-13 | 13F | Walleye Trading LLC | 0 | −100,00 | 0 | −100,00 | ||||
| 2025-08-13 | 13F | Walleye Trading LLC | Put | 202 700 | 10,46 | 5 090 | 73,92 | |||
| 2025-05-14 | 13F | Caitlin John, LLC | 0 | −100,00 | 0 | |||||
| 2025-08-14 | 13F | Headlands Technologies LLC | 0 | −100,00 | 0 | −100,00 | ||||
| 2025-06-27 | NP | ULTY - YieldMax Ultra Option Income Strategy ETF | 0 | −100,00 | 0 | −100,00 | ||||
| 2025-08-13 | 13F | Walleye Trading LLC | Call | 247 700 | 126,21 | 6 220 | 256,19 | |||
| 2025-08-15 | 13F | Tower Research Capital LLC (TRC) | 570 966 | −32,73 | 14 337 | 6,91 | ||||
| 2025-07-03 | 13F | Garde Capital, Inc. | 1 | 0,00 | 0 | |||||
| 2025-08-07 | 13F | Verus Capital Partners, Llc | 15 130 | −0,63 | 380 | 56,61 | ||||
| 2025-07-17 | 13F | Archford Capital Strategies, LLC | 8 436 | −58,53 | 212 | −34,88 | ||||
| 2025-08-12 | 13F | Integrated Advisors Network LLC | 0 | −100,00 | 0 | |||||
| 2025-09-04 | 13F/A | Advisor Group Holdings, Inc. | 1 950 | −10,84 | 49 | 41,18 | ||||
| 2025-08-13 | 13F | Edgestream Partners, L.P. | 0 | −100,00 | 0 | |||||
| 2025-08-14 | 13F | Bnp Paribas Arbitrage, Sa | 0 | −100,00 | 0 | |||||
| 2025-05-05 | 13F | Hollencrest Capital Management | Call | 0 | −100,00 | 0 | −100,00 | |||
| 2025-08-06 | 13F | AE Wealth Management LLC | 1 192 | 15,50 | 30 | 81,25 | ||||
| 2025-05-09 | 13F | Taika Capital, LP | 0 | −100,00 | 0 |