Grundläggande statistik
| Institutionella ägare | 168 total, 168 long only, 0 short only, 0 long/short - change of −11,05% MRQ |
| Genomsnittlig portföljallokering | 0.1253 % - change of −16,27% MRQ |
| Institutionella aktier (lång) | 10 435 096 (ex 13D/G) - change of −0,80MM shares −7,13% MRQ |
| Institutionellt värde (lång) | $ 297 531 USD ($1000) |
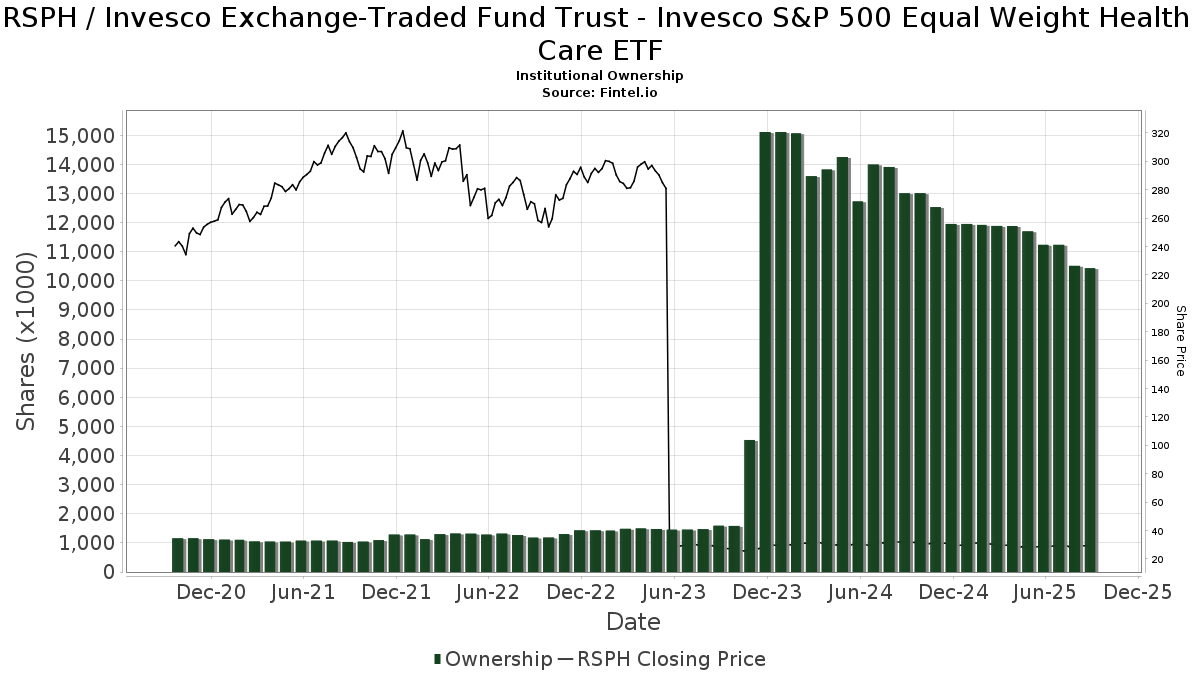
Institutionellt ägande och aktieägare
Invesco Exchange-Traded Fund Trust - Invesco S&P 500 Equal Weight Health Care ETF (US:RSPH) har 168 Institutionella ägare och aktieägare som har lämnat in 13D/G- eller 13F-formulär till Securities Exchange Commission (SEC). Dessa institut innehar totalt 10,435,096 aktier. Största aktieägare inkluderar HighTower Advisors, LLC, Morgan Stanley, LPL Financial LLC, Walled Lake Planning & Wealth Management, Llc, Bank Of America Corp /de/, Royal Bank Of Canada, Raymond James Financial Inc, MAI Capital Management, Jpmorgan Chase & Co, and Federation des caisses Desjardins du Quebec .
Invesco Exchange-Traded Fund Trust - Invesco S&P 500 Equal Weight Health Care ETF (ARCA:RSPH) Institutionell ägarstruktur visar institutioners och fonders nuvarande positioner i företaget, samt de senaste förändringarna i positionernas storlek. Större aktieägare kan vara enskilda investerare, fonder, hedgefonder eller institutioner. Bilaga 13D visar att investeraren äger (eller ägde) mer än 5% av företaget och avser (eller avsåg) att aktivt eftersträva en förändring av affärsstrategin. Schedule 13G indikerar en passiv investering på över 5%.
The share price as of September 10, 2025 is 29,04 / share. Previously, on September 11, 2024, the share price was 31,88 / share. This represents a decline of 8,91% over that period.
Fondsentimentets poäng
Fondsentimentet poängen(fka Ägarackumulation-poäng) visar vilka aktier som är mest köpta av fonder. Det är resultatet av en sofistikerad kvantitativ flerfaktormodell som identifierar företag med de högsta nivåerna av institutionell ackumulering. Poängsättningsmodellen använder en kombination av den totala ökningen av redovisade ägare, förändringarna i portföljallokeringarna för dessa ägare och andra mått. Siffran sträcker sig från 0 till 100, där högre siffror indikerar en högre nivå av ackumulering i förhållande till sina konkurrenter, och 50 är genomsnittet.
Uppdateringsfrekvens: Dagligen
Se Ownership Explorer, som innehåller en lista över de högst rankade företagen.
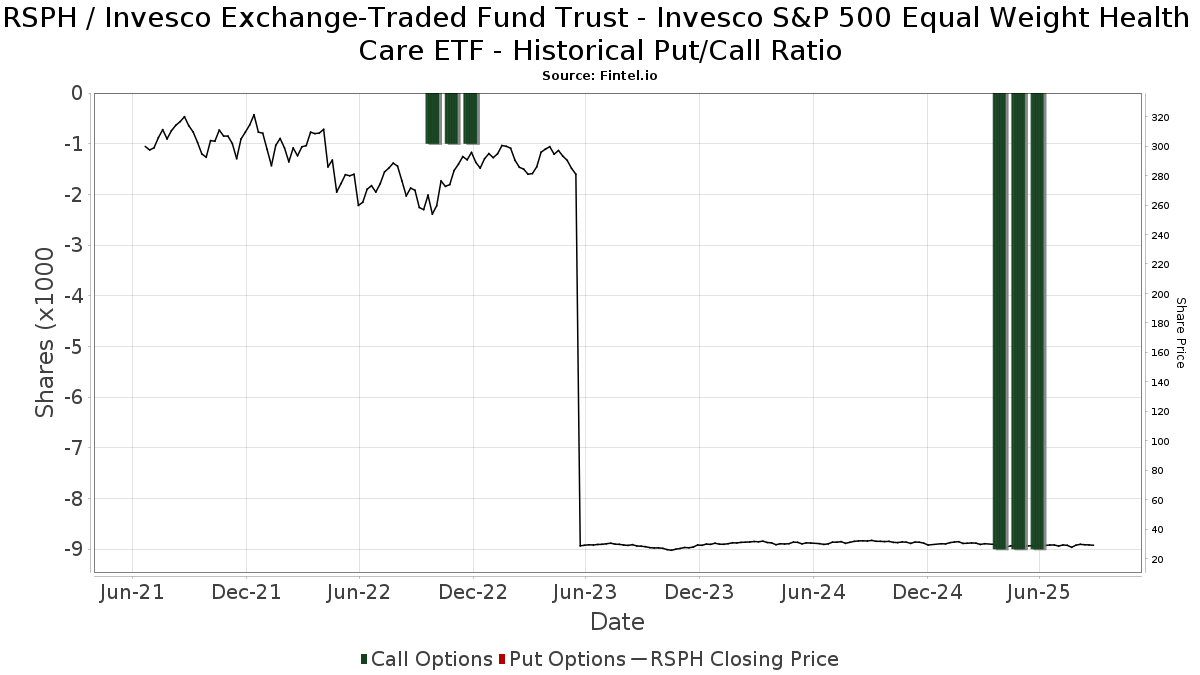
Institutionell sälj/köp-kvot
Förutom att rapportera vanliga eget kapital- och skuldemissioner måste institutioner med mer än 100MM tillgångar under förvaltning också avslöja sina innehav av sälj- och köpoptioner. Eftersom säljoptioner i allmänhet indikerar ett negativt sentiment och köpoptioner indikerar ett positivt sentiment, kan vi få en uppfattning om det övergripande institutionella sentimentet genom att plotta förhållandet mellan säljoptioner och köpoptioner. Diagrammet till höger visar det historiska förhållandet mellan sälj- och köpoptioner för detta instrument.
Genom att använda sälj/köp-kvoten som en indikator på aktieägarnas sentiment undviker man en av de största bristerna med att använda det totala institutionella ägandet, nämligen att en betydande del av de förvaltade tillgångarna investeras passivt för att följa index. Passivt förvaltade fonder köper vanligtvis inte optioner, så indikatorn för sälj/köp-kvoten ger en bättre bild av stämningen i aktivt förvaltade fonder.
13F- och NPORT-arkiveringar
Detaljer om 13F-arkiveringar är gratis. Detaljer om NP-arkiveringar kräver ett premiummedlemskap. Gröna rader indikerar nya positioner. Röda rader indikerar stängda positioner. Klicka på länk symbolen för att se hela transaktionshistoriken.
Uppgradera
för att låsa upp premiumdata och exportera till Excel ![]() .
.
| Fil Datum | Källa | Investerare | Typ | Genomsnittligt pris (beräknat) |
Aktier | Δ Aktier (%) |
Rapporterat värde (1000 USD) |
Δ Värde (%) |
Portföljallokering (%) |
|
|---|---|---|---|---|---|---|---|---|---|---|
| 2025-08-11 | 13F | HighTower Advisors, LLC | 2 246 103 | −7,13 | 65 541 | −8,91 | ||||
| 2025-07-23 | 13F | Country Club Bank /gfn | 7 500 | 0,00 | 218 | −1,81 | ||||
| 2025-08-14 | 13F | Boston Private Wealth Llc | 0 | −100,00 | 0 | |||||
| 2025-07-14 | 13F | CRA Financial Services, LLC | 17 106 | −8,65 | 499 | −10,41 | ||||
| 2025-08-11 | 13F | Aptus Capital Advisors, LLC | 104 | −38,46 | 3 | −40,00 | ||||
| 2025-05-15 | 13F | Hrt Financial Lp | 0 | −100,00 | 0 | |||||
| 2025-08-12 | 13F | Fca Corp /tx | 139 979 | 2,51 | 4 085 | 0,54 | ||||
| 2025-07-23 | 13F | Optas, LLC | 30 398 | −3,10 | 887 | −4,93 | ||||
| 2025-08-12 | 13F | Franklin Resources Inc | 900 | 0,00 | 26 | 0,00 | ||||
| 2025-08-12 | 13F | LPL Financial LLC | 450 503 | −2,93 | 13 146 | −4,79 | ||||
| 2025-08-14 | 13F | Comerica Bank | 2 100 | −39,85 | 61 | −40,78 | ||||
| 2025-07-10 | 13F | Exchange Traded Concepts, Llc | 1 001 | 29 | ||||||
| 2025-07-24 | 13F | Blair William & Co/il | 7 000 | 0,00 | 204 | −1,92 | ||||
| 2025-05-15 | 13F | Graham Capital Management, L.P. | 0 | −100,00 | 0 | |||||
| 2025-07-14 | 13F | AdvisorNet Financial, Inc | 3 660 | 0,00 | 107 | −1,85 | ||||
| 2025-08-12 | 13F | Financial Advocates Investment Management | 0 | −100,00 | 0 | −100,00 | ||||
| 2025-08-14 | 13F | Guardian Wealth Management, Inc. | 0 | −100,00 | 0 | |||||
| 2025-08-12 | 13F | Global Retirement Partners, LLC | 163 | 0,62 | 5 | 0,00 | ||||
| 2025-08-12 | 13F | O'shaughnessy Asset Management, Llc | 1 037 | 0,19 | 30 | 0,00 | ||||
| 2025-08-14 | 13F | Ausdal Financial Partners, Inc. | 59 345 | −3,14 | 1 732 | −4,99 | ||||
| 2025-08-12 | 13F | Stelac Advisory Services LLC | 70 061 | −1,49 | 2 045 | −3,31 | ||||
| 2025-07-22 | 13F | Valley National Advisers Inc | 3 020 | 0,00 | 0 | |||||
| 2025-08-14 | 13F | EP Wealth Advisors, Inc. | 6 400 | 15,94 | 187 | 13,41 | ||||
| 2025-08-04 | 13F | Crescent Sterling, Ltd. | 0 | −100,00 | 0 | |||||
| 2025-08-12 | 13F | MAI Capital Management | 329 368 | −1,99 | 9 611 | −3,87 | ||||
| 2025-08-14 | 13F | Wiley Bros.-aintree Capital, Llc | 26 357 | 0,73 | 769 | −0,52 | ||||
| 2025-08-15 | 13F | Equitable Holdings, Inc. | 8 550 | −29,80 | 249 | −31,22 | ||||
| 2025-05-09 | 13F | Comprehensive Financial Planning, Inc./PA | 0 | −100,00 | 0 | |||||
| 2025-08-13 | 13F | Beacon Pointe Advisors, LLC | 30 050 | 0,00 | 877 | −1,90 | ||||
| 2025-07-11 | 13F | SILVER OAK SECURITIES, Inc | 354 | 10 | ||||||
| 2025-07-31 | 13F | Hartford Financial Management Inc. | 62 366 | −3,36 | 1 820 | −5,21 | ||||
| 2025-08-08 | 13F | Hartland & Co., LLC | 17 945 | −38,86 | 524 | −40,09 | ||||
| 2025-08-14 | 13F | Fmr Llc | 17 112 | −21,40 | 499 | −22,87 | ||||
| 2025-08-11 | 13F | Citigroup Inc | 1 936 | 56 | ||||||
| 2025-08-12 | 13F | Walled Lake Planning & Wealth Management, Llc | 407 726 | 5,29 | 11 897 | 3,27 | ||||
| 2025-08-06 | 13F | Legacy Bridge, LLC | 5 210 | 0,00 | 152 | −1,30 | ||||
| 2025-08-07 | 13F | Runnymede Capital Advisors, Inc. | 0 | −100,00 | 0 | |||||
| 2025-07-15 | 13F | North Star Investment Management Corp. | 0 | −100,00 | 0 | |||||
| 2025-04-30 | 13F | Sofos Investments, Inc. | 266 | 322,22 | 8 | 600,00 | ||||
| 2025-08-12 | 13F | Atlas Capital Advisors Llc | 14 567 | 0,01 | 425 | −1,85 | ||||
| 2025-04-29 | 13F | Lee Danner & Bass Inc | 0 | −100,00 | 0 | |||||
| 2025-08-13 | 13F | Gateway Wealth Partners, LLC | 7 529 | 0,03 | 220 | −1,79 | ||||
| 2025-08-18 | 13F | Hollencrest Capital Management | 1 420 | 0,00 | 41 | −2,38 | ||||
| 2025-08-12 | 13F | Proequities, Inc. | 0 | 0 | ||||||
| 2025-07-24 | 13F | IFP Advisors, Inc | 3 250 | 0,00 | 95 | −2,08 | ||||
| 2025-08-05 | 13F | Wakefield Asset Management LLLP | 0 | −100,00 | 0 | |||||
| 2025-07-18 | 13F | Cooper Financial Group | 11 492 | 0,00 | 335 | −1,76 | ||||
| 2025-07-29 | 13F | Empirical Asset Management, LLC | 29 780 | −3,56 | 869 | −5,45 | ||||
| 2025-07-22 | 13F | Yoder Wealth Management, Inc. | 66 595 | 9,83 | 1 943 | 7,76 | ||||
| 2025-08-14 | 13F | Bank Of America Corp /de/ | 401 689 | −11,13 | 11 721 | −12,84 | ||||
| 2025-07-21 | 13F | Kennebec Savings Bank | 0 | −100,00 | 0 | |||||
| 2025-08-18 | 13F/A | National Bank Of Canada /fi/ | 5 295 | 0,00 | 155 | −1,91 | ||||
| 2025-08-13 | 13F | Northwestern Mutual Wealth Management Co | 5 032 | −4,46 | 147 | −6,41 | ||||
| 2025-08-11 | 13F | Principal Securities, Inc. | 13 998 | −2,96 | 408 | −3,32 | ||||
| 2025-08-13 | 13F | Continuum Advisory, LLC | 0 | −100,00 | 0 | |||||
| 2025-08-14 | 13F | Quantinno Capital Management LP | 15 200 | −4,81 | 444 | −6,74 | ||||
| 2025-08-08 | 13F | Cetera Investment Advisers | 110 709 | 12,18 | 3 230 | 10,05 | ||||
| 2025-08-13 | 13F | Cerity Partners LLC | 9 124 | −0,86 | 266 | −2,56 | ||||
| 2025-08-14 | 13F | Federation des caisses Desjardins du Quebec | 295 294 | 7,46 | 8 617 | 5,39 | ||||
| 2025-08-08 | 13F | Avalon Trust Co | 1 000 | 0,00 | 29 | 0,00 | ||||
| 2025-08-15 | 13F | First Heartland Consultants, Inc. | 25 025 | −2,82 | 730 | −4,70 | ||||
| 2025-05-15 | 13F | TFG Advisers LLC | 0 | −100,00 | 0 | |||||
| 2025-04-29 | 13F | Financial Network Wealth Management LLC | 840 | 0 | ||||||
| 2025-07-11 | 13F | Farther Finance Advisors, LLC | 123 776 | 1,71 | 3 612 | 0,98 | ||||
| 2025-08-14 | 13F | Susquehanna International Group, Llp | 20 052 | 50,63 | 585 | 47,73 | ||||
| 2025-07-15 | 13F | McAdam, LLC | 57 520 | −4,06 | 1 678 | −5,89 | ||||
| 2025-07-24 | 13F | Live Oak Investment Partners | 8 241 | 0,00 | 240 | −2,04 | ||||
| 2025-08-13 | 13F | Lido Advisors, LLC | 32 002 | −4,41 | 934 | −6,33 | ||||
| 2025-07-28 | 13F | Pettinga Financial Advisors, LLC | 53 129 | 88,17 | 1 550 | 84,74 | ||||
| 2025-08-12 | 13F | CIBC Private Wealth Group, LLC | 713 | 0,00 | 21 | 5,26 | ||||
| 2025-07-08 | 13F | Nbc Securities, Inc. | 500 | 0,00 | 0 | |||||
| 2025-04-23 | 13F | Sylvest Advisors, LLC | 0 | −100,00 | 0 | |||||
| 2025-08-11 | 13F | Rothschild Investment Llc | 700 | 0,00 | 20 | 0,00 | ||||
| 2025-08-11 | 13F | Pin Oak Investment Advisors Inc | 500 | 0,00 | 0 | |||||
| 2025-08-08 | 13F | Atlantic Trust, LLC | 1 250 | 0,00 | 36 | −2,70 | ||||
| 2025-07-25 | 13F | Envestnet Portfolio Solutions, Inc. | 0 | −100,00 | 0 | |||||
| 2025-08-01 | 13F | Envestnet Asset Management Inc | 41 637 | 6,89 | 1 215 | 4,84 | ||||
| 2025-05-08 | 13F | Empirical Financial Services, LLC d.b.a. Empirical Wealth Management | 0 | −100,00 | 0 | |||||
| 2025-08-12 | 13F | Jpmorgan Chase & Co | 327 886 | 98,99 | 9 568 | 95,17 | ||||
| 2025-08-04 | 13F | Kovack Advisors, Inc. | 17 954 | −2,02 | 524 | −4,04 | ||||
| 2025-07-29 | 13F | Private Trust Co Na | 5 183 | −70,13 | 151 | −70,74 | ||||
| 2025-07-18 | 13F | Truist Financial Corp | 0 | −100,00 | 0 | |||||
| 2025-08-06 | 13F | AE Wealth Management LLC | 977 | 3,83 | 29 | 3,70 | ||||
| 2025-07-21 | 13F | DHJJ Financial Advisors, Ltd. | 14 816 | 0,01 | 432 | −1,82 | ||||
| 2025-07-31 | 13F | Blue Sky Capital Consultants Group, Inc. | 25 725 | −5,36 | 751 | −7,18 | ||||
| 2025-07-10 | 13F | Focus Financial Network, Inc. | 122 087 | 2,15 | 3 562 | 0,20 | ||||
| 2025-08-13 | 13F | Jones Financial Companies Lllp | 43 100 | 25,13 | 1 252 | 22,99 | ||||
| 2025-08-15 | 13F | Kestra Advisory Services, LLC | 13 786 | −9,36 | 402 | −11,06 | ||||
| 2025-08-15 | 13F | CI Private Wealth, LLC | 23 743 | 0,06 | 693 | −1,84 | ||||
| 2025-08-08 | 13F | Avantax Advisory Services, Inc. | 12 508 | 8,93 | 365 | 6,74 | ||||
| 2025-07-15 | 13F | Mather Group, Llc. | 0 | −100,00 | 0 | |||||
| 2025-08-13 | 13F | Measured Wealth Private Client Group, LLC | 0 | −100,00 | 0 | |||||
| 2025-05-14 | 13F | Jane Street Group, Llc | 0 | −100,00 | 0 | |||||
| 2025-05-15 | 13F | Two Sigma Investments, Lp | 0 | −100,00 | 0 | |||||
| 2025-05-15 | 13F | Blue Chip Partners, Inc. | 0 | −100,00 | 0 | −100,00 | ||||
| 2025-08-28 | 13F/A | Lavaca Capital Llc | 1 100 | 0,00 | 32 | 0,00 | ||||
| 2025-08-01 | 13F | Belvedere Trading LLC | Call | 9 100 | 266 | |||||
| 2025-07-30 | 13F | Cornerstone Advisory, LLC | 78 813 | −1,12 | 2 300 | 3,23 | ||||
| 2025-08-19 | 13F | Asset Dedication, LLC | 17 685 | 0,00 | 516 | −1,90 | ||||
| 2025-07-29 | 13F | Koshinski Asset Management, Inc. | 12 705 | 0,01 | 371 | −1,86 | ||||
| 2025-08-12 | 13F | Howe & Rusling Inc | 125 | 0,00 | 4 | 0,00 | ||||
| 2025-08-13 | 13F | Rsm Us Wealth Management Llc | 22 780 | 0,00 | 665 | −1,92 | ||||
| 2025-08-14 | 13F | Great Valley Advisor Group, Inc. | 29 187 | −1,31 | 852 | −3,30 | ||||
| 2025-05-16 | 13F | Laidlaw Wealth Management LLC | 0 | −100,00 | 0 | |||||
| 2025-08-14 | 13F | GWM Advisors LLC | 5 285 | −30,71 | 154 | −31,86 | ||||
| 2025-05-13 | 13F | Shorepoint Capital Partners LLC | 10 200 | 0,00 | 303 | 1,68 | ||||
| 2025-07-29 | 13F | Harbor Asset Planning, Inc. | 19 251 | 562 | ||||||
| 2025-08-05 | 13F | Dunhill Financial, LLC | 34 | 0,00 | 1 | −100,00 | ||||
| 2025-08-07 | 13F | Cahill Financial Advisors Inc | 75 175 | 0,14 | 2 194 | −1,79 | ||||
| 2025-07-10 | 13F | Wealth Enhancement Advisory Services, Llc | 44 831 | −19,46 | 1 310 | −20,89 | ||||
| 2025-07-15 | 13F | Yarbrough Capital, LLC | 0 | −100,00 | 0 | |||||
| 2025-08-11 | 13F | Private Advisor Group, LLC | 28 414 | −61,82 | 829 | −62,56 | ||||
| 2025-08-07 | 13F | Flagship Wealth Advisors, Llc | 150 | 0,00 | 4 | 0,00 | ||||
| 2025-08-14 | 13F | Bnp Paribas Arbitrage, Sa | 2 422 | 0,00 | 71 | −2,78 | ||||
| 2025-08-14 | 13F/A | Rockefeller Capital Management L.P. | 15 198 | −42,56 | 443 | −43,71 | ||||
| 2025-08-05 | 13F | Scarborough Advisors, LLC | 323 | 9 | ||||||
| 2025-07-23 | 13F | Peak Financial Management, Inc. | 68 031 | −7,40 | 1 985 | −9,15 | ||||
| 2025-05-19 | 13F/A | Trinity Financial Advisors LLC | 0 | −100,00 | 0 | −100,00 | ||||
| 2025-07-23 | 13F | Friedenthal Financial | 109 934 | 5,34 | 3 208 | 3,32 | ||||
| 2025-07-21 | 13F | Ameriflex Group, Inc. | 0 | −100,00 | 0 | |||||
| 2025-07-16 | 13F | Fortune Financial Advisors, LLC | 0 | −100,00 | 0 | |||||
| 2025-08-08 | 13F | Creative Planning | 118 098 | 23,77 | 3 446 | 21,42 | ||||
| 2025-08-14 | 13F | Goldman Sachs Group Inc | 39 781 | 110,56 | 1 161 | 106,41 | ||||
| 2025-05-28 | 13F | Silicon Valley Capital Partners | 101 | 0,00 | 3 | 0,00 | ||||
| 2025-08-01 | 13F | Zhang Financial LLC | 0 | −100,00 | 0 | |||||
| 2025-08-12 | 13F | Steward Partners Investment Advisory, Llc | 1 650 | −78,29 | 48 | −78,76 | ||||
| 2025-08-07 | 13F/A | Joseph Group Capital Management | 3 269 | 0,28 | 95 | −1,04 | ||||
| 2025-08-14 | 13F | UBS Group AG | 136 569 | 35,81 | 3 985 | 33,23 | ||||
| 2025-08-06 | 13F | Commonwealth Equity Services, Llc | 114 840 | −7,52 | 3 | 0,00 | ||||
| 2025-08-12 | 13F | One Charles Private Wealth Services, LLC | 8 980 | 0,00 | 262 | −1,87 | ||||
| 2025-08-07 | 13F | Resources Investment Advisors, LLC. | 10 568 | −2,13 | 308 | −4,05 | ||||
| 2025-08-07 | 13F | Montag A & Associates Inc | 1 662 | −39,08 | 48 | −40,74 | ||||
| 2025-07-01 | 13F | Harbor Investment Advisory, Llc | 5 300 | 0,00 | 155 | −1,91 | ||||
| 2025-08-14 | 13F | Financial Advisory Service, Inc. | 0 | −100,00 | 0 | |||||
| 2025-07-22 | 13F | Berger Financial Group, Inc | 75 710 | −19,60 | 2 209 | −21,14 | ||||
| 2025-08-15 | 13F | Morgan Stanley | 785 996 | 11,16 | 22 935 | 9,03 | ||||
| 2025-08-12 | 13F | AlphaCore Capital LLC | 1 049 | 486,03 | 31 | 500,00 | ||||
| 2025-08-05 | 13F | Sensible Money, LLC | 21 825 | 0,00 | 637 | −2,00 | ||||
| 2025-08-14 | 13F | Wells Fargo & Company/mn | 217 128 | −16,15 | 6 336 | −17,76 | ||||
| 2025-08-14 | 13F | CoreCap Advisors, LLC | 1 540 | 0,00 | 45 | −2,22 | ||||
| 2025-08-18 | 13F | Pacific Center for Financial Services | 701 | 0,29 | 20 | 0,00 | ||||
| 2025-07-17 | 13F | Wagner Wealth Management, Llc | 8 337 | 0,19 | 243 | −1,62 | ||||
| 2025-08-14 | 13F | Acorn Wealth Advisors, LLC | 39 855 | −37,86 | 1 163 | −39,10 | ||||
| 2025-08-07 | 13F | Parkside Financial Bank & Trust | 4 930 | 0,00 | 144 | −2,05 | ||||
| 2025-04-17 | 13F | Pacific Sun Financial Corp | 0 | −100,00 | 0 | |||||
| 2025-08-04 | 13F | Assetmark, Inc | 1 080 | 0,00 | 32 | −3,12 | ||||
| 2025-07-31 | 13F | Cambridge Investment Research Advisors, Inc. | 44 819 | −5,65 | 1 | 0,00 | ||||
| 2025-07-21 | 13F | Rainey & Randall Investment Management Inc. | 102 175 | −85,69 | 2 981 | −85,97 | ||||
| 2025-04-22 | 13F | Jfs Wealth Advisors, Llc | 0 | −100,00 | 0 | −100,00 | ||||
| 2025-07-14 | 13F | UMA Financial Services, Inc. | 130 | 0,00 | 4 | 0,00 | ||||
| 2025-08-14 | 13F | IHT Wealth Management, LLC | 10 446 | −22,66 | 305 | −24,19 | ||||
| 2025-08-05 | 13F | GPS Wealth Strategies Group, LLC | 720 | 0,00 | 21 | 0,00 | ||||
| 2025-08-07 | 13F | PCG Wealth Advisors, LLC | 0 | −100,00 | 0 | |||||
| 2025-07-16 | 13F | Signaturefd, Llc | 1 087 | 0,00 | 32 | −3,12 | ||||
| 2025-08-14 | 13F | LM Advisors LLC | 34 471 | 0,00 | 1 | 0,00 | ||||
| 2025-08-14 | 13F | Raymond James Financial Inc | 347 520 | −2,23 | 10 141 | −4,10 | ||||
| 2025-08-05 | 13F | Bank Of Montreal /can/ | 176 582 | 0,47 | 5 153 | −1,45 | ||||
| 2025-07-30 | 13F | Bogart Wealth, LLC | 5 727 | 0,16 | 167 | −1,76 | ||||
| 2025-08-14 | 13F | Hilltop Holdings Inc. | 13 350 | −1,29 | 390 | −3,23 | ||||
| 2025-05-06 | 13F | Proficio Capital Partners LLC | 0 | −100,00 | 0 | −100,00 | ||||
| 2025-08-07 | 13F | Allworth Financial LP | 24 001 | 0,16 | 700 | 3,55 | ||||
| 2025-08-11 | 13F | United Capital Financial Advisers, Llc | 8 000 | 0,00 | 233 | −2,10 | ||||
| 2025-07-30 | 13F | Avidian Wealth Solutions, LLC | 15 640 | 0,00 | 456 | −1,94 | ||||
| 2025-07-18 | 13F | Eagle Capital Management, LLC | 0 | −100,00 | 0 | |||||
| 2025-07-22 | 13F/A | Red Mountain Financial, LLC | 32 029 | −12,24 | 935 | −13,92 | ||||
| 2025-08-14 | 13F | Mercer Global Advisors Inc /adv | 53 713 | 308,71 | 1 567 | 301,79 | ||||
| 2025-08-19 | 13F | Advisory Services Network, LLC | 10 854 | 10,17 | 303 | 3,41 | ||||
| 2025-07-17 | 13F | Walker Asset Management, LLC | 41 282 | 2,34 | 1 205 | 0,33 | ||||
| 2025-07-22 | 13F | DAVENPORT & Co LLC | 14 669 | −2,82 | 428 | −4,68 | ||||
| 2025-07-24 | 13F | Us Bancorp \de\ | 920 | 0,00 | 27 | −3,70 | ||||
| 2025-09-04 | 13F/A | Advisor Group Holdings, Inc. | 137 564 | 4,27 | 4 014 | 2,27 | ||||
| 2025-08-11 | 13F | Ironsides Asset Advisors, LLC | 37 628 | −0,99 | 1 098 | −2,92 | ||||
| 2025-08-12 | 13F | Bank OZK | 7 800 | 0,00 | 228 | −2,16 | ||||
| 2025-07-07 | 13F | Global Wealth Strategies & Associates | 0 | −100,00 | 0 | |||||
| 2025-08-14 | 13F | Mariner, LLC | 21 523 | 9,23 | 628 | 7,17 | ||||
| 2025-08-04 | 13F | Joseph P. Lucia & Associates, LLC | 117 495 | −3,65 | 3 429 | −5,49 | ||||
| 2025-08-14 | 13F | Allred Capital Management, LLC | 0 | −100,00 | 0 | |||||
| 2025-07-11 | 13F | Kapstone Financial Advisors LLC | 0 | −100,00 | 0 | |||||
| 2025-07-31 | 13F | Oppenheimer & Co Inc | 34 642 | −4,02 | 1 011 | −5,87 | ||||
| 2025-07-29 | 13F | Socha Financial Group, LLC | 8 020 | −53,45 | 234 | −54,30 | ||||
| 2025-07-30 | 13F | Eqis Capital Management, Inc. | 16 522 | −1,54 | 482 | −3,41 | ||||
| 2025-07-11 | 13F | Seacrest Wealth Management, Llc | 0 | −100,00 | 0 | |||||
| 2025-08-11 | 13F | Cascade Wealth Advisors, Inc | 0 | −100,00 | 0 | |||||
| 2025-07-18 | 13F | SOA Wealth Advisors, LLC. | 4 555 | 0,20 | 133 | −2,22 | ||||
| 2025-08-18 | 13F | Geneos Wealth Management Inc. | 13 269 | −7,16 | 387 | −8,94 | ||||
| 2025-08-01 | 13F | Biltmore Family Office, LLC | 37 200 | 0,00 | 1 085 | −1,90 | ||||
| 2025-08-11 | 13F | HHM Wealth Advisors, LLC | 21 645 | 0,00 | 632 | −1,87 | ||||
| 2025-08-14 | 13F | Seven Mile Advisory | 7 000 | 0,00 | 204 | −1,92 | ||||
| 2025-04-29 | 13F | Hm Payson & Co | 0 | −100,00 | 0 | |||||
| 2025-08-13 | 13F | StoneX Group Inc. | 10 119 | 1,18 | 295 | −0,67 | ||||
| 2025-08-14 | 13F | D. E. Shaw & Co., Inc. | 0 | −100,00 | 0 | |||||
| 2025-08-18 | 13F | Front Row Advisors LLC | 550 | 0,00 | 16 | 0,00 | ||||
| 2025-07-16 | 13F/A | CX Institutional | 534 | −79,35 | 0 | |||||
| 2025-08-06 | 13F | North Capital, Inc. | 1 080 | 0,00 | 32 | −3,12 | ||||
| 2025-08-08 | 13F | Financial Gravity Companies, Inc. | 93 | −65,43 | 3 | −71,43 | ||||
| 2025-08-13 | 13F | Green Harvest Asset Management LLC | 129 776 | −1,50 | 3 787 | −3,39 | ||||
| 2025-07-30 | 13F | LGT Financial Advisors LLC | 0 | −100,00 | 0 | |||||
| 2025-08-14 | 13F | Mml Investors Services, Llc | 7 249 | −0,43 | 0 | |||||
| 2025-08-14 | 13F | Citadel Advisors Llc | 69 916 | 584,04 | 2 040 | 571,05 | ||||
| 2025-07-14 | 13F | U.S. Capital Wealth Advisors, LLC | 40 020 | 0,00 | 1 168 | −1,93 | ||||
| 2025-08-14 | 13F | Ameriprise Financial Inc | 124 805 | −12,04 | 3 642 | −13,74 | ||||
| 2025-07-11 | 13F/A | Umb Bank N A/mo | 29 000 | 0,00 | 846 | −1,86 | ||||
| 2025-08-14 | 13F | Royal Bank Of Canada | 355 421 | 2,52 | 10 371 | 0,56 | ||||
| 2025-07-25 | 13F | Cwm, Llc | 2 210 | −12,30 | 0 | |||||
| 2025-07-08 | 13F | Parallel Advisors, LLC | 190 | 0,00 | 6 | 0,00 | ||||
| 2025-07-29 | 13F | Ballast, Inc. | 117 495 | 3 429 | ||||||
| 2025-07-31 | 13F | Perissos Private Wealth Management, LLC | 12 477 | 0,02 | 364 | −1,89 | ||||
| 2025-07-14 | 13F | Occidental Asset Management, LLC | 6 898 | −6,76 | 201 | −8,64 | ||||
| 2025-08-14 | 13F | Stifel Financial Corp | 14 115 | −5,24 | 412 | −7,22 | ||||
| 2025-07-28 | 13F | Harbour Investments, Inc. | 3 412 | 0,09 | 100 | −1,98 | ||||
| 2025-05-08 | 13F | Natixis Advisors, L.p. | 0 | −100,00 | 0 | |||||
| 2025-08-05 | 13F | Huntington National Bank | 314 | −15,82 | ||||||
| 2025-08-14 | 13F | Coastal Bridge Advisors, LLC | 20 035 | −1,77 | 585 | −3,63 | ||||
| 2025-07-17 | 13F | Janney Montgomery Scott LLC | 26 847 | 0,22 | 1 |