Grundläggande statistik
| Institutionella ägare | 127 total, 127 long only, 0 short only, 0 long/short - change of −11,81% MRQ |
| Genomsnittlig portföljallokering | 0.1643 % - change of −19,58% MRQ |
| Institutionella aktier (lång) | 3 095 451 (ex 13D/G) - change of −0,61MM shares −16,55% MRQ |
| Institutionellt värde (lång) | $ 221 679 USD ($1000) |
Institutionellt ägande och aktieägare
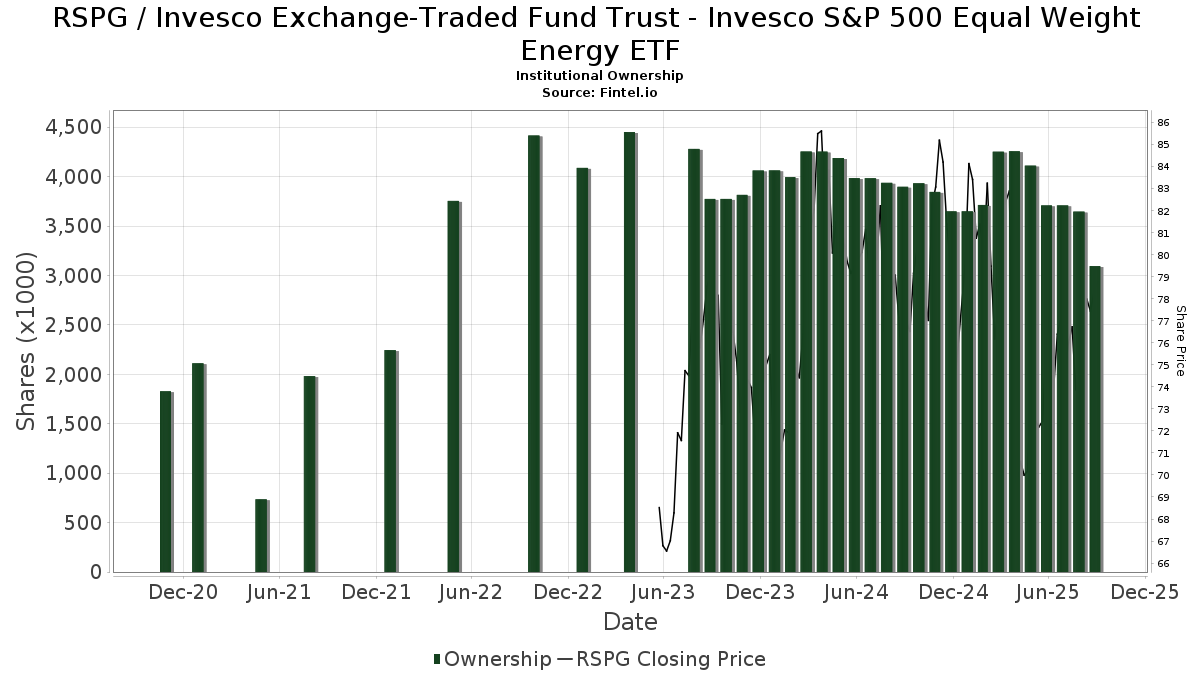
Invesco Exchange-Traded Fund Trust - Invesco S&P 500 Equal Weight Energy ETF (US:RSPG) har 127 Institutionella ägare och aktieägare som har lämnat in 13D/G- eller 13F-formulär till Securities Exchange Commission (SEC). Dessa institut innehar totalt 3,095,451 aktier. Största aktieägare inkluderar Bank Of America Corp /de/, UBS Group AG, Morgan Stanley, Matauro, Llc, LPL Financial LLC, Raymond James Financial Inc, Arkfeld Wealth Strategies, L.L.C., HighTower Advisors, LLC, Wells Fargo & Company/mn, and Commonwealth Equity Services, Llc .
Invesco Exchange-Traded Fund Trust - Invesco S&P 500 Equal Weight Energy ETF (ARCA:RSPG) Institutionell ägarstruktur visar institutioners och fonders nuvarande positioner i företaget, samt de senaste förändringarna i positionernas storlek. Större aktieägare kan vara enskilda investerare, fonder, hedgefonder eller institutioner. Bilaga 13D visar att investeraren äger (eller ägde) mer än 5% av företaget och avser (eller avsåg) att aktivt eftersträva en förändring av affärsstrategin. Schedule 13G indikerar en passiv investering på över 5%.
The share price as of September 18, 2025 is 78,73 / share. Previously, on September 19, 2024, the share price was 78,05 / share. This represents an increase of 0,87% over that period.
Fondsentimentets poäng
Fondsentimentet poängen(fka Ägarackumulation-poäng) visar vilka aktier som är mest köpta av fonder. Det är resultatet av en sofistikerad kvantitativ flerfaktormodell som identifierar företag med de högsta nivåerna av institutionell ackumulering. Poängsättningsmodellen använder en kombination av den totala ökningen av redovisade ägare, förändringarna i portföljallokeringarna för dessa ägare och andra mått. Siffran sträcker sig från 0 till 100, där högre siffror indikerar en högre nivå av ackumulering i förhållande till sina konkurrenter, och 50 är genomsnittet.
Uppdateringsfrekvens: Dagligen
Se Ownership Explorer, som innehåller en lista över de högst rankade företagen.
AI+ Ask Fintel’s AI assistant about Invesco Exchange-Traded Fund Trust - Invesco S&P 500 Equal Weight Energy ETF.
Thinking of good questions…
Institutionell sälj/köp-kvot
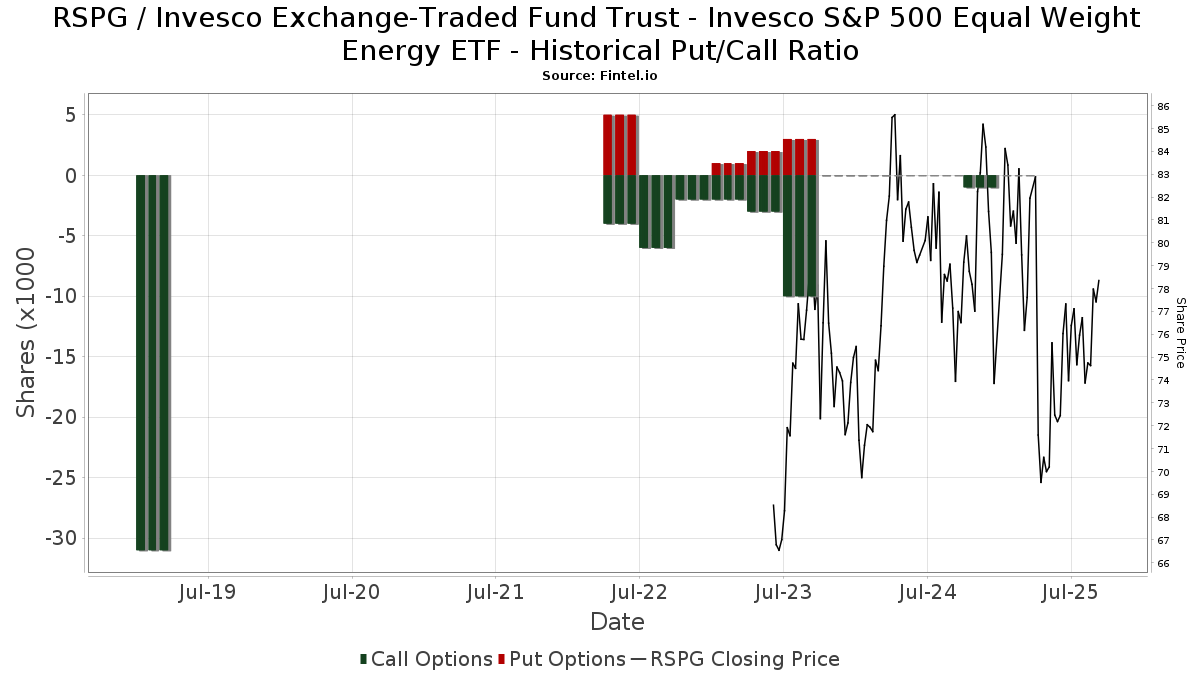
Förutom att rapportera vanliga eget kapital- och skuldemissioner måste institutioner med mer än 100MM tillgångar under förvaltning också avslöja sina innehav av sälj- och köpoptioner. Eftersom säljoptioner i allmänhet indikerar ett negativt sentiment och köpoptioner indikerar ett positivt sentiment, kan vi få en uppfattning om det övergripande institutionella sentimentet genom att plotta förhållandet mellan säljoptioner och köpoptioner. Diagrammet till höger visar det historiska förhållandet mellan sälj- och köpoptioner för detta instrument.
Genom att använda sälj/köp-kvoten som en indikator på aktieägarnas sentiment undviker man en av de största bristerna med att använda det totala institutionella ägandet, nämligen att en betydande del av de förvaltade tillgångarna investeras passivt för att följa index. Passivt förvaltade fonder köper vanligtvis inte optioner, så indikatorn för sälj/köp-kvoten ger en bättre bild av stämningen i aktivt förvaltade fonder.
13F- och NPORT-arkiveringar
Detaljer om 13F-arkiveringar är gratis. Detaljer om NP-arkiveringar kräver ett premiummedlemskap. Gröna rader indikerar nya positioner. Röda rader indikerar stängda positioner. Klicka på länk symbolen för att se hela transaktionshistoriken.
Uppgradera
för att låsa upp premiumdata och exportera till Excel ![]() .
.
| Fil Datum | Källa | Investerare | Typ | Genomsnittligt pris (beräknat) |
Aktier | Δ Aktier (%) |
Rapporterat värde (1000 USD) |
Δ Värde (%) |
Portföljallokering (%) |
|
|---|---|---|---|---|---|---|---|---|---|---|
| 2025-08-11 | 13F | HighTower Advisors, LLC | 81 407 | −5,50 | 6 063 | −14,02 | ||||
| 2025-08-12 | 13F | Founders Financial Alliance, LLC | 662 | 0,61 | 49 | −7,55 | ||||
| 2025-07-29 | 13F | Stratos Wealth Partners, LTD. | 0 | −100,00 | 0 | |||||
| 2025-08-14 | 13F | Great Valley Advisor Group, Inc. | 14 876 | −7,68 | 1 108 | −16,07 | ||||
| 2025-05-21 | 13F | MBL Wealth, LLC | 0 | −100,00 | 0 | |||||
| 2025-08-14 | 13F | GWM Advisors LLC | 372 | 0,27 | 28 | −10,00 | ||||
| 2025-05-01 | 13F | Steel Peak Wealth Management LLC | 0 | −100,00 | 0 | |||||
| 2025-07-24 | 13F | McKinley Carter Wealth Services, Inc. | 7 814 | 582 | ||||||
| 2025-07-30 | 13F | Eqis Capital Management, Inc. | 0 | −100,00 | 0 | |||||
| 2025-08-11 | 13F | Aptus Capital Advisors, LLC | 23 169 | 1 726 | ||||||
| 2025-07-02 | 13F | Howard Financial Services, Ltd. | 3 336 | −13,03 | 248 | −21,02 | ||||
| 2025-08-19 | 13F | Advisory Services Network, LLC | 4 035 | 36,64 | 308 | 27,39 | ||||
| 2025-07-28 | 13F | Eq Wealth Advisors, Llc | 10 205 | −19,54 | 760 | −26,78 | ||||
| 2025-08-12 | 13F | TCTC Holdings, LLC | 4 | 0,00 | 0 | |||||
| 2025-05-29 | NP | Northern Lights Fund Trust - Sierra Tactical Risk Spectrum 50 Fund Investor Class | 18 200 | 1 490 | ||||||
| 2025-07-10 | 13F | Wealth Enhancement Advisory Services, Llc | 11 757 | −0,42 | 898 | −7,14 | ||||
| 2025-08-08 | 13F | Capital Investment Advisory Services, LLC | 508 | 0,59 | 38 | −9,76 | ||||
| 2025-08-14 | 13F | Comerica Bank | 4 235 | −5,60 | 315 | −14,17 | ||||
| 2025-08-14 | 13F | Bnp Paribas Arbitrage, Sa | 50 256 | 402,56 | 3 743 | 357,58 | ||||
| 2025-07-07 | 13F | Somerset Trust Co | 5 905 | −1,91 | 440 | −10,77 | ||||
| 2025-07-31 | 13F | Wright Fund Managment, LLC | 34 954 | 0,00 | 2 862 | 0,00 | ||||
| 2025-08-14 | 13F | Gotham Asset Management, LLC | 8 258 | 0,00 | 615 | −9,02 | ||||
| 2025-07-24 | 13F | Blair William & Co/il | 1 350 | −43,11 | 101 | −48,45 | ||||
| 2025-08-12 | 13F | LPL Financial LLC | 180 603 | −10,03 | 13 451 | −18,15 | ||||
| 2025-07-15 | 13F | Financial Partners Group, Inc | 0 | −100,00 | 0 | |||||
| 2025-08-11 | 13F | Private Advisor Group, LLC | 5 627 | −76,87 | 419 | −78,96 | ||||
| 2025-07-10 | 13F | Worth Asset Management, LLC | 3 000 | −22,52 | 223 | −29,65 | ||||
| 2025-08-14 | 13F | Wiley Bros.-aintree Capital, Llc | 6 797 | 8,75 | 506 | 0,00 | ||||
| 2025-08-15 | 13F | Kestra Advisory Services, LLC | 17 692 | −2,46 | 1 318 | −11,25 | ||||
| 2025-08-04 | 13F | Atria Investments Llc | 0 | −100,00 | 0 | |||||
| 2025-08-12 | 13F | Archer Investment Corp | 90 | 0,00 | 7 | −14,29 | ||||
| 2025-07-23 | 13F | Friedenthal Financial | 7 144 | 2,31 | 532 | −6,83 | ||||
| 2025-05-20 | 13F/A | Colony Group, LLC | 0 | −100,00 | 0 | −100,00 | ||||
| 2025-08-12 | 13F | Steward Partners Investment Advisory, Llc | 2 028 | −5,89 | 151 | −14,20 | ||||
| 2025-05-29 | NP | Northern Lights Fund Trust - Sierra Tactical Risk Spectrum 70 Fund Investor Class | 5 400 | 442 | ||||||
| 2025-08-08 | 13F | Financial Gravity Companies, Inc. | 8 | −71,43 | 1 | −100,00 | ||||
| 2025-08-14 | 13F | UBS Group AG | 291 300 | −9,98 | 21 696 | −18,11 | ||||
| 2025-08-12 | 13F | Sfmg, Llc | 5 208 | −4,98 | 388 | −13,62 | ||||
| 2025-08-13 | 13F | Providence Capital Advisors, LLC | 75 | 6 | ||||||
| 2025-08-12 | 13F | Coldstream Capital Management Inc | 0 | −100,00 | 0 | |||||
| 2025-07-30 | 13F | Whittier Trust Co | 1 000 | 0,00 | 74 | −8,64 | ||||
| 2025-08-12 | 13F | Howe & Rusling Inc | 659 | 0,00 | 49 | −7,55 | ||||
| 2025-08-14 | 13F | Synovus Financial Corp | 5 016 | 8,90 | 374 | −1,06 | ||||
| 2025-03-21 | 13F | Prostatis Group LLC | 0 | −100,00 | 0 | −100,00 | ||||
| 2025-08-08 | 13F | Pnc Financial Services Group, Inc. | 1 | 0 | ||||||
| 2025-08-19 | 13F | Cape Investment Advisory, Inc. | 1 317 | 0,00 | 98 | −8,41 | ||||
| 2025-08-06 | 13F | Commonwealth Equity Services, Llc | 66 079 | −13,31 | 5 | −33,33 | ||||
| 2025-08-13 | 13F | Beutel, Goodman & Co Ltd. | 175 | 0,00 | 0 | |||||
| 2025-08-14 | 13F | Susquehanna International Group, Llp | 0 | −100,00 | 0 | |||||
| 2025-08-13 | 13F | Flow Traders U.s. Llc | 0 | −100,00 | 0 | |||||
| 2025-08-14 | 13F | Vista Investment Management | 5 383 | 0,00 | 401 | −9,09 | ||||
| 2025-08-14 | 13F | Jane Street Group, Llc | 4 246 | −11,41 | 316 | −19,39 | ||||
| 2025-07-21 | 13F | Ameritas Advisory Services, LLC | 353 | 26 | ||||||
| 2025-07-25 | 13F | Envestnet Portfolio Solutions, Inc. | 0 | −100,00 | 0 | |||||
| 2025-07-23 | 13F | Kingswood Wealth Advisors, Llc | 3 800 | 0,00 | 283 | −9,58 | ||||
| 2025-08-12 | 13F | Proequities, Inc. | 0 | 0 | ||||||
| 2025-05-12 | 13F | National Bank Of Canada /fi/ | 0 | −100,00 | 0 | |||||
| 2025-08-12 | 13F | AlphaCore Capital LLC | 30 | 0,00 | 2 | 0,00 | ||||
| 2025-07-24 | 13F | IFP Advisors, Inc | 348 | 0,00 | 26 | −10,71 | ||||
| 2025-08-15 | 13F | Blue Chip Partners, Inc. | 0 | −100,00 | 0 | |||||
| 2025-08-08 | 13F | Hartland & Co., LLC | 0 | −100,00 | 0 | |||||
| 2025-07-08 | 13F | Davis Investment Partners, LLC | 40 327 | −5,50 | 3 028 | 3,03 | ||||
| 2025-07-17 | 13F | SeaBridge Investment Advisors LLC | 0 | −100,00 | 0 | |||||
| 2025-08-14 | 13F | Wells Fargo & Company/mn | 69 305 | −56,41 | 5 162 | −60,35 | ||||
| 2025-08-12 | 13F | Global Retirement Partners, LLC | 422 | −2,09 | 31 | −3,12 | ||||
| 2025-07-23 | 13F | Raub Brock Capital Management LP | 0 | −100,00 | 0 | |||||
| 2025-07-23 | 13F | Fortis Advisors, LLC | 38 421 | −0,89 | 2 862 | −9,83 | ||||
| 2025-08-13 | 13F | Northwestern Mutual Wealth Management Co | 3 300 | 100,49 | 246 | 82,84 | ||||
| 2025-08-14 | 13F | Bank Of America Corp /de/ | 487 942 | −0,98 | 36 342 | −9,92 | ||||
| 2025-08-11 | 13F | Principal Securities, Inc. | 259 | 149,04 | 19 | 171,43 | ||||
| 2025-08-12 | 13F | Tradition Wealth Management, LLC | 0 | −100,00 | 0 | |||||
| 2025-07-09 | 13F | Fermata Advisors, LLC | 0 | −100,00 | 0 | |||||
| 2025-08-06 | 13F | AE Wealth Management LLC | 1 414 | 0,71 | 105 | −7,89 | ||||
| 2025-08-25 | 13F/A | Promus Capital, LLC | 234 | 0,00 | 17 | −10,53 | ||||
| 2025-08-08 | 13F | Cetera Investment Advisers | 21 035 | −2,84 | 1 567 | −11,63 | ||||
| 2025-04-30 | 13F | Sofos Investments, Inc. | 24 | −65,22 | 2 | −80,00 | ||||
| 2025-07-11 | 13F | Farther Finance Advisors, LLC | 20 368 | 4,82 | 1 517 | −5,36 | ||||
| 2025-07-22 | 13F | Wealthcare Advisory Partners LLC | 4 645 | −10,81 | 346 | −19,01 | ||||
| 2025-07-21 | 13F | Hilltop National Bank | 354 | −47,32 | 26 | −49,02 | ||||
| 2025-07-16 | 13F | Sylvest Advisors, LLC | 5 656 | 9,32 | 421 | −0,47 | ||||
| 2025-07-31 | 13F | Cambridge Investment Research Advisors, Inc. | 19 451 | 18,00 | 1 | 0,00 | ||||
| 2025-08-26 | 13F | Claris Financial LLC | 10 915 | 813 | ||||||
| 2025-05-15 | 13F | Ameriflex Group, Inc. | 0 | −100,00 | 0 | |||||
| 2025-07-24 | 13F | Stonebridge Financial Group, LLC | 53 706 | 4,80 | 4 000 | −4,67 | ||||
| 2025-08-15 | 13F | Tower Research Capital LLC (TRC) | 3 910 | −52,70 | 291 | −56,95 | ||||
| 2025-08-04 | 13F | Arkadios Wealth Advisors | 7 307 | 544 | ||||||
| 2025-07-21 | 13F | Matauro, Llc | 244 243 | −13,30 | 18 191 | −21,13 | ||||
| 2025-04-29 | 13F | Brookstone Capital Management | 0 | −100,00 | 0 | |||||
| 2025-08-14 | 13F | Mml Investors Services, Llc | 3 423 | 2,82 | 0 | |||||
| 2025-07-16 | 13F | Essex Financial Services, Inc. | 3 016 | −2,58 | 225 | −11,46 | ||||
| 2025-07-18 | 13F | Requisite Capital Management, LLC | 0 | −100,00 | 0 | |||||
| 2025-05-09 | 13F | Tidemark, LLC | 0 | −100,00 | 0 | |||||
| 2025-08-12 | 13F | CIBC Private Wealth Group, LLC | 3 000 | 0,00 | 223 | 13,78 | ||||
| 2025-08-14 | 13F | Hrt Financial Lp | 19 258 | 1 | ||||||
| 2025-08-14 | 13F | IHT Wealth Management, LLC | 19 911 | 0,38 | 1 483 | −8,69 | ||||
| 2025-07-28 | 13F | Evernest Financial Advisors, LLC | 0 | −100,00 | 0 | |||||
| 2025-05-05 | 13F | Nwam Llc | 0 | −100,00 | 0 | |||||
| 2025-08-07 | 13F | Allworth Financial LP | 103 | 19,77 | 8 | 16,67 | ||||
| 2025-08-12 | 13F | BlackRock, Inc. | 0 | −100,00 | 0 | |||||
| 2025-08-14 | 13F | Raymond James Financial Inc | 121 003 | −1,70 | 9 012 | −10,57 | ||||
| 2025-08-14 | 13F | LM Advisors LLC | 3 066 | 0 | ||||||
| 2025-07-29 | 13F | Ballast, Inc. | 27 645 | 2 059 | ||||||
| 2025-07-01 | 13F | Harbor Investment Advisory, Llc | 250 | 0,00 | 19 | −10,00 | ||||
| 2025-08-14 | 13F | Fmr Llc | 6 605 | 0,43 | 492 | −8,74 | ||||
| 2025-08-05 | 13F | Bank Of Montreal /can/ | 4 172 | −9,93 | 311 | −18,21 | ||||
| 2025-08-14 | 13F | Win Advisors, Inc | 36 405 | 2 711 | ||||||
| 2025-07-16 | 13F | Highline Wealth Partners Llc | 0 | −100,00 | 0 | |||||
| 2025-08-14 | 13F | Citadel Advisors Llc | Call | 0 | −100,00 | 0 | ||||
| 2025-08-01 | 13F | Envestnet Asset Management Inc | 15 475 | 19,00 | 1 153 | 8,27 | ||||
| 2025-08-14 | 13F | Beck Capital Management, Llc | 0 | −100,00 | 0 | |||||
| 2025-08-14 | 13F | Mariner, LLC | 2 948 | −1,73 | 220 | −10,61 | ||||
| 2025-09-04 | 13F/A | Advisor Group Holdings, Inc. | 22 815 | −11,40 | 1 700 | −19,40 | ||||
| 2025-07-29 | 13F | Stephens Inc /ar/ | 9 939 | −0,22 | 740 | −9,20 | ||||
| 2025-08-04 | 13F | Kovack Advisors, Inc. | 0 | −100,00 | 0 | |||||
| 2025-08-08 | 13F | Flaharty Asset Management, LLC | 0 | −100,00 | 0 | |||||
| 2025-07-30 | 13F | Capital Wealth Alliance, LLC | 5 690 | −4,58 | 424 | −13,32 | ||||
| 2025-08-06 | 13F | Ethos Financial Group, LLC | 50 682 | −10,10 | 3 775 | −18,22 | ||||
| 2025-08-13 | 13F | CMC Financial Group | 0 | −100,00 | 0 | |||||
| 2025-07-24 | 13F | Us Bancorp \de\ | 201 | 0,00 | 15 | −12,50 | ||||
| 2025-08-05 | 13F | Simplex Trading, Llc | 2 499 | 0 | ||||||
| 2025-08-12 | 13F | Jpmorgan Chase & Co | 16 575 | 79,17 | 1 235 | 63,01 | ||||
| 2025-08-19 | 13F | Anchor Investment Management, LLC | 3 142 | 0,03 | 234 | −8,95 | ||||
| 2025-07-25 | 13F | Astoria Portfolio Advisors LLC. | 0 | −100,00 | 0 | |||||
| 2025-08-28 | NP | Northern Lights Fund Trust - Sierra Tactical Core Growth Fund Investor Class Shares | 0 | −100,00 | 0 | −100,00 | ||||
| 2025-07-29 | 13F | Activest Wealth Management | 2 022 | 0,00 | 151 | −9,09 | ||||
| 2025-07-17 | 13F | Vermillion Wealth Management, Inc. | 30 | 2 | ||||||
| 2025-08-04 | 13F | Joseph P. Lucia & Associates, LLC | 27 645 | −5,23 | 2 059 | −13,78 | ||||
| 2025-08-01 | 13F | Oarsman Capital, Inc. | 58 112 | 2,83 | 4 328 | −6,44 | ||||
| 2025-05-12 | 13F | Independent Advisor Alliance | 0 | −100,00 | 0 | |||||
| 2025-08-12 | 13F | Strategic Advisors LLC | 4 038 | −1,61 | 301 | −10,45 | ||||
| 2025-08-15 | 13F | Morgan Stanley | 277 526 | 47,85 | 20 670 | 34,51 | ||||
| 2025-08-12 | 13F | MAI Capital Management | 5 045 | −3,90 | 376 | −12,59 | ||||
| 2025-04-22 | 13F | Synergy Financial Management, LLC | 0 | −100,00 | 0 | |||||
| 2025-07-25 | 13F | Cwm, Llc | 457 | −30,44 | 0 | |||||
| 2025-07-24 | 13F | Live Oak Investment Partners | 0 | −100,00 | 0 | |||||
| 2025-08-13 | 13F | Summit Financial, LLC | 2 991 | 0,23 | 223 | −9,02 | ||||
| 2025-07-21 | 13F | HighMark Wealth Management LLC | 200 | 0,00 | 15 | −12,50 | ||||
| 2025-04-25 | 13F | Almanack Investment Partners, LLC. | 0 | −100,00 | 0 | |||||
| 2025-07-16 | 13F | Strategic Investment Solutions, Inc. /IL | 68 | 0,00 | 5 | 0,00 | ||||
| 2025-08-13 | 13F | Jones Financial Companies Lllp | 5 242 | 10,33 | 392 | 2,08 | ||||
| 2025-08-14 | 13F | Advisor OS, LLC | 0 | −100,00 | 0 | |||||
| 2025-08-14 | 13F | Goldman Sachs Group Inc | 10 936 | 23,06 | 815 | 11,97 | ||||
| 2025-08-11 | 13F | HHM Wealth Advisors, LLC | 500 | −64,79 | 37 | −68,10 | ||||
| 2025-08-14 | 13F | Ancora Advisors, LLC | 248 | 0,00 | 18 | −10,00 | ||||
| 2025-07-17 | 13F | Walker Asset Management, LLC | 6 115 | −0,63 | 455 | −9,54 | ||||
| 2025-08-12 | 13F | OneAscent Financial Services LLC | 0 | −100,00 | 0 | |||||
| 2025-07-16 | 13F/A | CX Institutional | 226 | −97,77 | 0 | |||||
| 2025-07-10 | 13F | Arkfeld Wealth Strategies, L.L.C. | 114 096 | 736,05 | 8 610 | 781,17 | ||||
| 2025-08-13 | 13F | Green Harvest Asset Management LLC | 20 156 | −0,15 | 1 501 | −9,14 | ||||
| 2025-08-18 | 13F | Geneos Wealth Management Inc. | 2 450 | 188,24 | 182 | 163,77 | ||||
| 2025-05-07 | 13F | Mb, Levis & Associates, Llc | 0 | −100,00 | 0 | −100,00 | ||||
| 2025-08-05 | 13F | Fourth Dimension Wealth, LLC | 3 | 0,00 | 0 | |||||
| 2025-08-11 | 13F | Rothschild Investment Llc | 7 898 | 4,00 | 588 | −5,31 | ||||
| 2025-08-14 | 13F | Stifel Financial Corp | 16 505 | −15,64 | 1 229 | −23,24 | ||||
| 2025-07-29 | 13F | Salomon & Ludwin, LLC | 750 | 57 | ||||||
| 2025-07-31 | 13F | Longview Financial Advisors, Inc. | 6 257 | −5,33 | 466 | −13,86 | ||||
| 2025-05-01 | 13F | Bleakley Financial Group, LLC | 0 | −100,00 | 0 | −100,00 | ||||
| 2025-07-18 | 13F | Truist Financial Corp | 5 786 | 23,34 | 431 | 11,98 | ||||
| 2025-07-31 | 13F | Mason & Associates Inc | 40 406 | 2,48 | 3 009 | −6,78 | ||||
| 2025-05-29 | NP | Northern Lights Fund Trust - Sierra Tactical Risk Spectrum 30 Fund Instl Class | 9 250 | 757 | ||||||
| 2025-08-13 | 13F | Baird Financial Group, Inc. | 31 446 | 0,27 | 2 342 | −8,77 | ||||
| 2025-07-29 | 13F | Private Trust Co Na | 0 | −100,00 | 0 | |||||
| 2025-08-14 | 13F | Royal Bank Of Canada | 36 374 | −12,71 | 2 709 | −20,58 | ||||
| 2025-08-04 | 13F | Creative Financial Designs Inc /adv | 1 724 | 0,58 | 128 | −8,57 | ||||
| 2025-07-17 | 13F | Janney Montgomery Scott LLC | 12 739 | −8,68 | 1 | −100,00 | ||||
| 2025-08-13 | 13F | Lido Advisors, LLC | 2 876 | −6,17 | 214 | −14,40 | ||||
| 2025-07-07 | 13F | Thurston, Springer, Miller, Herd & Titak, Inc. | 300 | 0,00 | 22 | −8,33 | ||||
| 2025-08-14 | 13F | Ameriprise Financial Inc | 25 672 | −81,43 | 1 906 | −83,23 | ||||
| 2025-07-31 | 13F | Harbour Investment Management Llc | 0 | −100,00 | 0 | |||||
| 2025-05-06 | 13F | Fpc Investment Advisory, Inc. | 0 | −100,00 | 0 | |||||
| 2025-07-29 | 13F | Financial Guidance Group, Inc. | 23 119 | 1 722 | ||||||
| 2025-07-28 | 13F | Harbour Investments, Inc. | 1 805 | 0,39 | 134 | −8,84 | ||||
| 2025-08-14 | 13F | Citadel Advisors Llc | 28 695 | 83,60 | 2 137 | 67,08 |