Grundläggande statistik
| Institutionella ägare | 195 total, 195 long only, 0 short only, 0 long/short - change of 5,95% MRQ |
| Genomsnittlig portföljallokering | 0.1255 % - change of −8,25% MRQ |
| Institutionella aktier (lång) | 24 187 899 (ex 13D/G) - change of −0,09MM shares −0,37% MRQ |
| Institutionellt värde (lång) | $ 290 450 USD ($1000) |
Institutionellt ägande och aktieägare
Cohen & Steers Quality Income Realty Fund, Inc. (US:RQI) har 195 Institutionella ägare och aktieägare som har lämnat in 13D/G- eller 13F-formulär till Securities Exchange Commission (SEC). Dessa institut innehar totalt 24,187,899 aktier. Största aktieägare inkluderar Morgan Stanley, Bank Of America Corp /de/, Raymond James Financial Inc, Wells Fargo & Company/mn, Mission Hills Financial Advisory, LLC, Ameriprise Financial Inc, Royal Bank Of Canada, LPL Financial LLC, UBS Group AG, and Mariner, LLC .
Cohen & Steers Quality Income Realty Fund, Inc. (NYSE:RQI) Institutionell ägarstruktur visar institutioners och fonders nuvarande positioner i företaget, samt de senaste förändringarna i positionernas storlek. Större aktieägare kan vara enskilda investerare, fonder, hedgefonder eller institutioner. Bilaga 13D visar att investeraren äger (eller ägde) mer än 5% av företaget och avser (eller avsåg) att aktivt eftersträva en förändring av affärsstrategin. Schedule 13G indikerar en passiv investering på över 5%.
The share price as of September 12, 2025 is 12,69 / share. Previously, on September 16, 2024, the share price was 14,32 / share. This represents a decline of 11,38% over that period.

Fondsentimentets poäng
Fondsentimentet poängen(fka Ägarackumulation-poäng) visar vilka aktier som är mest köpta av fonder. Det är resultatet av en sofistikerad kvantitativ flerfaktormodell som identifierar företag med de högsta nivåerna av institutionell ackumulering. Poängsättningsmodellen använder en kombination av den totala ökningen av redovisade ägare, förändringarna i portföljallokeringarna för dessa ägare och andra mått. Siffran sträcker sig från 0 till 100, där högre siffror indikerar en högre nivå av ackumulering i förhållande till sina konkurrenter, och 50 är genomsnittet.
Uppdateringsfrekvens: Dagligen
Se Ownership Explorer, som innehåller en lista över de högst rankade företagen.
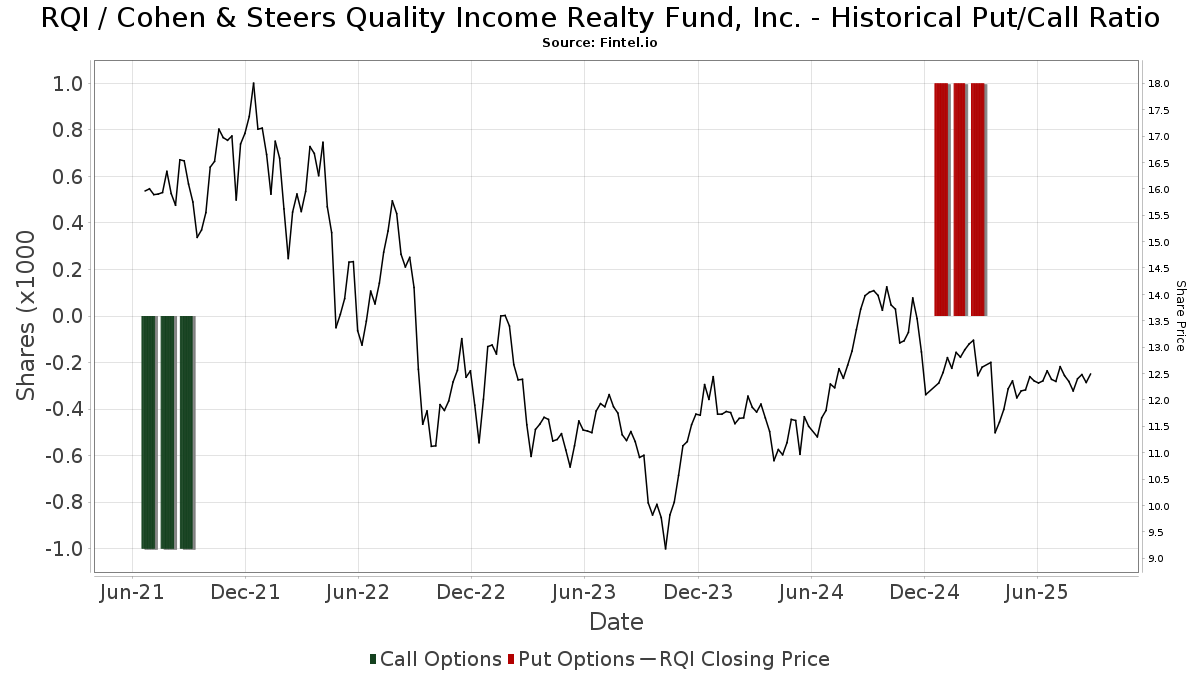
Institutionell sälj/köp-kvot
Förutom att rapportera vanliga eget kapital- och skuldemissioner måste institutioner med mer än 100MM tillgångar under förvaltning också avslöja sina innehav av sälj- och köpoptioner. Eftersom säljoptioner i allmänhet indikerar ett negativt sentiment och köpoptioner indikerar ett positivt sentiment, kan vi få en uppfattning om det övergripande institutionella sentimentet genom att plotta förhållandet mellan säljoptioner och köpoptioner. Diagrammet till höger visar det historiska förhållandet mellan sälj- och köpoptioner för detta instrument.
Genom att använda sälj/köp-kvoten som en indikator på aktieägarnas sentiment undviker man en av de största bristerna med att använda det totala institutionella ägandet, nämligen att en betydande del av de förvaltade tillgångarna investeras passivt för att följa index. Passivt förvaltade fonder köper vanligtvis inte optioner, så indikatorn för sälj/köp-kvoten ger en bättre bild av stämningen i aktivt förvaltade fonder.
13F- och NPORT-arkiveringar
Detaljer om 13F-arkiveringar är gratis. Detaljer om NP-arkiveringar kräver ett premiummedlemskap. Gröna rader indikerar nya positioner. Röda rader indikerar stängda positioner. Klicka på länk symbolen för att se hela transaktionshistoriken.
Uppgradera
för att låsa upp premiumdata och exportera till Excel ![]() .
.
| Fil Datum | Källa | Investerare | Typ | Genomsnittligt pris (beräknat) |
Aktier | Δ Aktier (%) |
Rapporterat värde (1000 USD) |
Δ Värde (%) |
Portföljallokering (%) |
|
|---|---|---|---|---|---|---|---|---|---|---|
| 2025-07-18 | 13F | Cooper Financial Group | 69 866 | 0,35 | 870 | −0,57 | ||||
| 2025-07-30 | 13F | D.a. Davidson & Co. | 35 528 | 6,00 | 442 | 5,24 | ||||
| 2025-07-28 | 13F | BRYN MAWR TRUST Co | 2 000 | 0,00 | 25 | −4,00 | ||||
| 2025-07-16 | 13F | ORG Wealth Partners, LLC | 89 678 | 12,70 | 1 123 | 11,74 | ||||
| 2025-07-30 | 13F | Principle Wealth Partners Llc | 10 373 | 0,00 | 129 | −0,77 | ||||
| 2025-07-18 | 13F | Bartlett & Co. Wealth Management Llc | 4 481 | 0,00 | 56 | −1,79 | ||||
| 2025-08-08 | 13F | 1776 Wealth LLC | 10 000 | 0,00 | 124 | −0,80 | ||||
| 2025-08-14 | 13F | Mml Investors Services, Llc | 27 571 | 154,39 | 0 | |||||
| 2025-07-29 | 13F | Stratos Wealth Partners, LTD. | 25 860 | 70,73 | 322 | 68,95 | ||||
| 2025-08-06 | 13F | Smh Capital Advisors Inc | 14 725 | −1,40 | 183 | −2,14 | ||||
| 2025-08-14 | 13F | Comerica Bank | 32 249 | −62,18 | 402 | −62,52 | ||||
| 2025-05-14 | 13F | Landscape Capital Management, L.l.c. | 0 | −100,00 | 0 | |||||
| 2025-07-07 | 13F | Investors Research Corp | 11 615 | 6,41 | 145 | 5,11 | ||||
| 2025-07-08 | 13F | Parallel Advisors, LLC | 300 | −25,00 | 4 | −40,00 | ||||
| 2025-05-09 | 13F | Delta Financial Group, Inc. | 31 025 | −2,89 | 0 | |||||
| 2025-08-11 | 13F | Shufro Rose & Co Llc | 72 600 | 0,00 | 912 | 0,00 | ||||
| 2025-07-14 | 13F | Sweeney & Michel, Llc | 65 762 | −2,25 | 815 | 11,97 | ||||
| 2025-08-14 | 13F | Wiley Bros.-aintree Capital, Llc | 23 526 | 9,84 | 293 | 9,36 | ||||
| 2025-07-11 | 13F | Pinnacle Bancorp, Inc. | 2 420 | 30 | ||||||
| 2025-08-05 | 13F | Sigma Planning Corp | 18 251 | −28,26 | 227 | −28,84 | ||||
| 2025-08-06 | 13F | Commonwealth Equity Services, Llc | 338 631 | −7,82 | 4 | 0,00 | ||||
| 2025-08-04 | 13F | Quaker Wealth Management, LLC | Put | 0 | −100,00 | 0 | −100,00 | |||
| 2025-07-28 | 13F | Mutual Advisors, LLC | 145 680 | −0,59 | 1 836 | 5,46 | ||||
| 2025-08-22 | NP | Cornerstone Strategic Value Fund Inc | 12 568 | 25,68 | 191 | 55,74 | ||||
| 2025-05-05 | 13F | Cassaday & Co Wealth Management LLC | 0 | −100,00 | 0 | |||||
| 2025-08-12 | 13F | Coldstream Capital Management Inc | 0 | −100,00 | 0 | |||||
| 2025-05-08 | 13F | Roble, Belko & Company, Inc | 0 | −100,00 | 0 | |||||
| 2025-07-17 | 13F | HB Wealth Management, LLC | 0 | −100,00 | 0 | |||||
| 2025-08-18 | 13F | Geneos Wealth Management Inc. | 4 563 | −0,93 | 57 | −1,75 | ||||
| 2025-09-04 | 13F | Beacon Capital Management, Inc. | 93 000 | 50,00 | 1 158 | 49,10 | ||||
| 2025-07-31 | 13F | Carnegie Capital Asset Management, LLC | 16 119 | 201 | ||||||
| 2025-08-15 | 13F | Tower Research Capital LLC (TRC) | 0 | −100,00 | 0 | |||||
| 2025-07-24 | 13F | Cyndeo Wealth Partners, LLC | 346 710 | −13,48 | 4 317 | −14,23 | ||||
| 2025-08-11 | 13F | Delta Asset Management Llc/tn | 774 | 0,00 | 10 | 0,00 | ||||
| 2025-05-15 | 13F | Hilltop Holdings Inc. | 0 | −100,00 | 0 | |||||
| 2025-07-29 | 13F | Mezzasalma Advisors, LLC | 32 136 | 1,73 | 400 | 1,01 | ||||
| 2025-08-11 | 13F | Principal Securities, Inc. | 2 565 | −10,25 | 32 | −8,82 | ||||
| 2025-08-13 | 13F | EverSource Wealth Advisors, LLC | 5 000 | 0,00 | 62 | 0,00 | ||||
| 2025-08-13 | 13F | Invesco Ltd. | 31 800 | 396 | ||||||
| 2025-08-11 | 13F | Private Advisor Group, LLC | 216 583 | 8,73 | 2 696 | 7,80 | ||||
| 2025-08-11 | 13F | TD Waterhouse Canada Inc. | 27 000 | −12,90 | 338 | −13,55 | ||||
| 2025-08-12 | 13F | Auxano Advisors, LLC | 22 186 | 1,97 | 276 | 1,10 | ||||
| 2025-08-11 | 13F | Alteri Wealth LLC | 11 405 | −2,56 | 142 | −4,08 | ||||
| 2025-08-06 | 13F | Golden State Wealth Management, LLC | 5 000 | 0,00 | 62 | 0,00 | ||||
| 2025-07-30 | 13F | Gables Capital Management Inc. | 1 101 | 1,85 | 14 | 0,00 | ||||
| 2025-05-12 | 13F | Independent Advisor Alliance | 0 | −100,00 | 0 | |||||
| 2025-07-14 | 13F | Wealth Advisory Solutions, LLC | 353 564 | 3,35 | 4 402 | 2,44 | ||||
| 2025-08-12 | 13F | Financial Advocates Investment Management | 11 113 | −80,15 | 138 | −80,37 | ||||
| 2025-08-12 | 13F | Strategic Advisors LLC | 31 405 | 0,11 | 391 | −1,02 | ||||
| 2025-08-15 | 13F | Morse Asset Management, Inc | 1 099 | −15,27 | 14 | −18,75 | ||||
| 2025-07-29 | 13F | Private Trust Co Na | 6 422 | 0,00 | 80 | −1,25 | ||||
| 2025-08-14 | 13F | Ameriprise Financial Inc | 795 613 | 0,45 | 9 902 | −0,47 | ||||
| 2025-08-05 | 13F | Fourth Dimension Wealth, LLC | 500 | 0,00 | 6 | 0,00 | ||||
| 2025-07-09 | 13F | Channel Wealth Llc | 11 363 | 0,00 | 141 | −0,70 | ||||
| 2025-08-05 | 13F | Key FInancial Inc | 3 | 0,00 | 0 | |||||
| 2025-08-04 | 13F | Carret Asset Management, Llc | 10 554 | −2,76 | 131 | −3,68 | ||||
| 2025-07-25 | 13F | LRI Investments, LLC | 1 325 | 0,00 | 16 | 0,00 | ||||
| 2025-08-07 | 13F | Samalin Investment Counsel, LLC | 146 668 | 1,03 | 1 826 | 0,16 | ||||
| 2025-08-13 | 13F | Baird Financial Group, Inc. | 65 935 | 3,56 | 821 | 2,63 | ||||
| 2025-07-25 | 13F | Hazlett, Burt & Watson, Inc. | 810 | 0 | ||||||
| 2025-08-13 | 13F | Northwestern Mutual Wealth Management Co | 37 814 | 6,48 | 471 | 5,38 | ||||
| 2025-07-25 | 13F | Concord Wealth Partners | 127 | 0,00 | 2 | 0,00 | ||||
| 2025-09-09 | 13F | NWF Advisory Services Inc. | 84 876 | 7,32 | 1 057 | 6,34 | ||||
| 2025-07-22 | 13F | Merit Financial Group, LLC | 22 286 | 68,12 | 277 | 66,87 | ||||
| 2025-08-19 | 13F | Newbridge Financial Services Group, Inc. | 37 651 | 469 | ||||||
| 2025-08-14 | 13F | Sargent Investment Group, LLC | 186 430 | −2,65 | 2 302 | −4,28 | ||||
| 2025-07-28 | 13F | Mission Hills Financial Advisory, LLC | 799 685 | 16,24 | 9 956 | 15,23 | ||||
| 2025-07-25 | 13F | Atria Wealth Solutions, Inc. | 19 447 | −1,38 | 242 | −2,02 | ||||
| 2025-08-06 | 13F | Prospera Financial Services Inc | 115 568 | 0,28 | 1 439 | −0,62 | ||||
| 2025-07-31 | 13F | Pacitti Group Inc. | 10 284 | −13,88 | 128 | −14,09 | ||||
| 2025-08-12 | 13F | Steward Partners Investment Advisory, Llc | 115 592 | −8,34 | 1 439 | −9,10 | ||||
| 2025-08-14 | 13F | Modern Wealth Management, LLC | 12 940 | 0,00 | 161 | −0,62 | ||||
| 2025-08-14 | 13F | Susquehanna International Group, Llp | 18 293 | 228 | ||||||
| 2025-07-15 | 13F | MCF Advisors LLC | 74 | 0,00 | 1 | |||||
| 2025-07-17 | 13F | Delta Capital Management Llc | 19 700 | 0,00 | 0 | |||||
| 2025-08-13 | 13F | StoneX Group Inc. | 11 343 | 7,02 | 141 | 6,02 | ||||
| 2025-05-12 | 13F | Fmr Llc | 0 | −100,00 | 0 | |||||
| 2025-08-14 | 13F | Mercer Global Advisors Inc /adv | 0 | −100,00 | 0 | |||||
| 2025-08-14 | 13F | Josh Arnold Investment Consultant, Llc | 42 050 | 0,00 | 524 | −0,95 | ||||
| 2025-05-14 | 13F | Van Hulzen Asset Management, LLC | 0 | −100,00 | 0 | −100,00 | ||||
| 2025-08-05 | 13F | Shaker Financial Services, LLC | 125 826 | 17,05 | 1 567 | 16,00 | ||||
| 2025-08-13 | 13F | Keystone Financial Group | 10 587 | 0,03 | 132 | −0,76 | ||||
| 2025-07-23 | 13F | Abel Hall, LLC | 26 000 | 324 | ||||||
| 2025-08-07 | 13F | Vista Investment Partners Ii, Llc | 13 597 | −1,59 | 169 | −2,31 | ||||
| 2025-08-11 | 13F | Elequin Capital Lp | 424 | −97,65 | 5 | −97,79 | ||||
| 2025-08-06 | 13F | Atlantic Union Bankshares Corp | 517 | 6 | ||||||
| 2025-05-06 | 13F | Venturi Wealth Management, LLC | 0 | −100,00 | 0 | |||||
| 2025-07-30 | 13F | Castle Wealth Management Llc | 246 929 | 1,60 | 3 074 | 0,72 | ||||
| 2025-07-07 | 13F | Trust Co | 0 | −100,00 | 0 | |||||
| 2025-08-08 | 13F | Pnc Financial Services Group, Inc. | 2 400 | −30,43 | 30 | −32,56 | ||||
| 2025-07-10 | 13F | Wealth Enhancement Advisory Services, Llc | 110 960 | −2,68 | 1 391 | −2,86 | ||||
| 2025-07-07 | 13F | Thurston, Springer, Miller, Herd & Titak, Inc. | 7 676 | 32,21 | 96 | 31,94 | ||||
| 2025-08-06 | 13F | Rialto Wealth Management, LLC | 5 111 | 0,00 | 64 | −1,56 | ||||
| 2025-08-15 | 13F | Equitable Holdings, Inc. | 45 962 | −1,32 | 572 | −2,05 | ||||
| 2025-06-27 | NP | Calamos ETF Trust - Calamos CEF Income & Arbitrage ETF | 26 347 | −33,84 | 322 | −36,94 | ||||
| 2025-04-21 | 13F | ORG Partners LLC | 0 | −100,00 | 0 | |||||
| 2025-08-12 | 13F | AlphaCore Capital LLC | 58 427 | 9,66 | 727 | 8,67 | ||||
| 2025-08-13 | 13F | Congress Wealth Management LLC / DE / | 84 652 | 14,22 | 1 054 | 13,23 | ||||
| 2025-07-23 | 13F | Nbt Bank N A /ny | 3 430 | 0,00 | 43 | −2,33 | ||||
| 2025-07-11 | 13F | Vanguard Capital Wealth Advisors This fund is a listed as child fund of Vanguard Group Inc and if that institution has disclosed ownership in this security, then these positions will not be double counted when calculating total shares and total value | 17 500 | −46,15 | 218 | −46,81 | ||||
| 2025-08-12 | 13F | CIBC Private Wealth Group, LLC | 0 | −100,00 | 0 | |||||
| 2025-08-06 | 13F | Moors & Cabot, Inc. | 23 283 | 0,24 | 290 | −0,69 | ||||
| 2025-07-17 | 13F | XML Financial, LLC | 10 680 | 0,00 | 133 | −1,49 | ||||
| 2025-04-24 | 13F | Wingate Wealth Advisors, Inc. | 0 | −100,00 | 0 | |||||
| 2025-08-14 | 13F | GWM Advisors LLC | 10 327 | 32,57 | 129 | 31,96 | ||||
| 2025-05-12 | 13F | Sandy Spring Bank | 517 | 0,00 | 6 | 0,00 | ||||
| 2025-08-14 | 13F | CoreCap Advisors, LLC | 1 830 | −69,35 | 23 | −70,27 | ||||
| 2025-08-11 | 13F | Brown Brothers Harriman & Co | 0 | −100,00 | 0 | |||||
| 2025-08-11 | 13F | Hexagon Capital Partners LLC | 0 | −100,00 | 0 | |||||
| 2025-07-31 | 13F | Optimum Investment Advisors | 1 000 | 0,00 | 12 | 0,00 | ||||
| 2025-08-06 | 13F | Sound Financial Strategies Group, LLC | 92 857 | −2,89 | 1 156 | −3,75 | ||||
| 2025-08-15 | 13F | Morgan Stanley | 5 098 148 | 3,88 | 63 472 | 2,97 | ||||
| 2025-08-22 | NP | Cornerstone Total Return Fund Inc | 137 613 | 29,54 | 1 713 | 33,52 | ||||
| 2025-04-28 | 13F | Strategic Financial Concepts, LLC | 0 | −100,00 | 0 | −100,00 | ||||
| 2025-08-12 | 13F | J.w. Cole Advisors, Inc. | 11 534 | 2,68 | 144 | 1,42 | ||||
| 2025-07-24 | 13F | IFP Advisors, Inc | 12 958 | −0,38 | 161 | −1,23 | ||||
| 2025-08-05 | 13F | Sage Capital Management, LLC | 50 131 | 1,97 | 624 | 1,13 | ||||
| 2025-08-05 | 13F | Burney Co/ | 14 054 | 0,00 | 175 | −1,14 | ||||
| 2025-08-13 | 13F | Colonial Trust Co / SC | 6 000 | 0,00 | 74 | 0,00 | ||||
| 2025-04-25 | 13F | Washington Trust Advisors, Inc. | 0 | −100,00 | 0 | −100,00 | ||||
| 2025-08-13 | 13F | Everstar Asset Management, LLC | 17 625 | −14,55 | 219 | −15,44 | ||||
| 2025-07-17 | 13F | Sound Income Strategies, LLC | 400 | 0,00 | 5 | −20,00 | ||||
| 2025-08-04 | 13F | Wolverine Asset Management Llc | 66 249 | 113,74 | 825 | 111,83 | ||||
| 2025-08-12 | 13F | Ameritas Investment Partners, Inc. | 629 | −25,74 | 8 | −30,00 | ||||
| 2025-08-12 | 13F | Wealthbridge Capital Management, Llc | 20 286 | −4,70 | 253 | −5,62 | ||||
| 2025-08-04 | 13F | Quaker Wealth Management, LLC | 1 332 | 17 | ||||||
| 2025-07-17 | 13F | Janney Montgomery Scott LLC | 84 140 | −7,58 | 1 | 0,00 | ||||
| 2025-08-12 | 13F | Virtu Financial LLC | 12 411 | 0 | ||||||
| 2025-08-08 | 13F | Larson Financial Group LLC | 6 872 | −8,81 | 86 | −9,57 | ||||
| 2025-07-08 | 13F | Morris Retirement Advisors, LLC | 10 280 | 0,47 | 128 | −0,78 | ||||
| 2025-07-08 | 13F/A | Salem Investment Counselors Inc | 15 000 | 0,00 | 187 | −1,06 | ||||
| 2025-07-21 | 13F | Ameritas Advisory Services, LLC | 22 087 | −71,19 | 275 | −70,79 | ||||
| 2025-08-12 | 13F | Horizon Kinetics Asset Management Llc | 81 227 | 3,83 | 1 011 | 2,95 | ||||
| 2025-08-12 | 13F | PKS Advisory Services, LLC | 22 961 | 46,08 | 286 | 44,67 | ||||
| 2025-08-15 | 13F | WFA of San Diego, LLC | 200 | 0,00 | 2 | 0,00 | ||||
| 2025-07-21 | 13F | Barrett & Company, Inc. | 0 | −100,00 | 0 | |||||
| 2025-08-12 | 13F | Jpmorgan Chase & Co | 1 130 | 14 | ||||||
| 2025-07-15 | 13F | Fortitude Family Office, LLC | 4 000 | 50 | ||||||
| 2025-08-01 | 13F | Transcend Wealth Collective, Llc | 0 | −100,00 | 0 | |||||
| 2025-08-11 | 13F | WPG Advisers, LLC | 466 | −21,81 | 6 | −28,57 | ||||
| 2025-08-08 | 13F | Cetera Investment Advisers | 172 159 | −2,89 | 2 143 | −3,73 | ||||
| 2025-07-25 | 13F | Cwm, Llc | 13 719 | 10,31 | 0 | |||||
| 2025-07-18 | 13F | Consolidated Portfolio Review Corp | 176 616 | 2,16 | 2 199 | 1,24 | ||||
| 2025-08-12 | 13F | Advisors Asset Management, Inc. | 98 733 | −50,79 | 1 229 | −51,23 | ||||
| 2025-08-05 | 13F | Seelaus Asset Management LLC | 11 585 | 144 | ||||||
| 2025-07-21 | 13F | Cliftonlarsonallen Wealth Advisors, Llc | 23 179 | 0,00 | 289 | −1,03 | ||||
| 2025-08-08 | 13F | Fortis Group Advisors, LLC | 230 | 0,00 | 3 | 0,00 | ||||
| 2025-07-15 | 13F | Fifth Third Bancorp | 67 | −93,30 | 1 | −100,00 | ||||
| 2025-07-25 | 13F | Concurrent Investment Advisors, LLC | 14 213 | −27,28 | 177 | −28,16 | ||||
| 2025-07-17 | 13F | Venture Visionary Partners LLC | 17 007 | 0,00 | 212 | −0,94 | ||||
| 2025-07-08 | 13F | Next Level Private LLC | 36 627 | 1,07 | 456 | 0,22 | ||||
| 2025-04-02 | 13F | Global Wealth Strategies & Associates | 0 | 0 | ||||||
| 2025-08-11 | 13F | Lake Street Financial Llc | 427 025 | 5,63 | 5 316 | 4,71 | ||||
| 2025-08-12 | 13F | Marshall & Sterling Wealth Advisors Inc. | 44 828 | −7,52 | 558 | −8,39 | ||||
| 2025-08-12 | 13F | Evelyn Partners Asset Management Ltd | 1 289 | 16 | ||||||
| 2025-08-14 | 13F | Integrated Wealth Concepts LLC | 11 328 | 0,00 | 141 | −0,70 | ||||
| 2025-07-29 | 13F | Tradewinds Capital Management, LLC | 775 | 0,00 | 10 | 0,00 | ||||
| 2025-08-14 | 13F | Matrix Private Capital Group Llc | 254 882 | 5,33 | 3 173 | 4,41 | ||||
| 2025-07-02 | 13F | HBW Advisory Services LLC | 68 886 | −4,49 | 858 | −5,30 | ||||
| 2025-07-11 | 13F | Farther Finance Advisors, LLC | 3 554 | −32,28 | 44 | −33,33 | ||||
| 2025-07-31 | 13F | Cambridge Investment Research Advisors, Inc. | 280 271 | 0,59 | 3 | 0,00 | ||||
| 2025-08-14 | 13F | Bank Of America Corp /de/ | 2 589 312 | 1,54 | 32 237 | 0,65 | ||||
| 2025-07-15 | 13F | Regatta Capital Group, Llc | 24 515 | 305 | ||||||
| 2025-07-11 | 13F | Quad-Cities Investment Group, LLC | 192 438 | 0,59 | 2 396 | −0,29 | ||||
| 2025-08-05 | 13F | Dunhill Financial, LLC | 1 141 | 14 | ||||||
| 2025-07-29 | 13F | First National Bank of Mount Dora, Trust Investment Services | 17 641 | 0,00 | 220 | −0,90 | ||||
| 2025-09-04 | 13F/A | Advisor Group Holdings, Inc. | 261 071 | 19,87 | 3 251 | 18,83 | ||||
| 2025-08-13 | 13F | Lido Advisors, LLC | 108 625 | −6,84 | 1 352 | −7,65 | ||||
| 2025-08-14 | 13F | Balyasny Asset Management Llc | 18 992 | 236 | ||||||
| 2025-05-14 | 13F | Jane Street Group, Llc | 0 | −100,00 | 0 | |||||
| 2025-07-10 | 13F | Fortress Wealth Management, Inc. | 265 670 | 0,30 | 3 308 | −0,57 | ||||
| 2025-08-12 | 13F | MAI Capital Management | 5 939 | 0,00 | 74 | −1,35 | ||||
| 2025-08-14 | 13F/A | Rockefeller Capital Management L.P. | 84 466 | −4,19 | 1 052 | −5,06 | ||||
| 2025-08-14 | 13F | UBS Group AG | 641 340 | −14,26 | 7 985 | −15,01 | ||||
| 2025-07-25 | 13F | Apollon Wealth Management, LLC | 298 986 | −2,06 | 3 722 | −2,92 | ||||
| 2025-07-24 | 13F | Us Bancorp \de\ | 26 492 | 4,00 | 330 | 3,13 | ||||
| 2025-08-18 | 13F | Hollencrest Capital Management | 5 042 | 1,96 | 63 | 0,00 | ||||
| 2025-08-15 | 13F | Kestra Advisory Services, LLC | 21 988 | 73,89 | 274 | 72,78 | ||||
| 2025-07-17 | 13F/A | Capital Investment Advisors, LLC | 14 141 | −17,50 | 176 | −18,14 | ||||
| 2025-07-28 | 13F | Harbour Investments, Inc. | 5 894 | 6,78 | 73 | 5,80 | ||||
| 2025-08-05 | 13F | Huntington National Bank | 0 | |||||||
| 2025-08-11 | 13F | Tidemark, LLC | 240 | 0,00 | 3 | −33,33 | ||||
| 2025-07-18 | 13F | PFG Investments, LLC | 10 540 | 131 | ||||||
| 2025-08-14 | 13F | Wetherby Asset Management Inc | 31 563 | 0,99 | 393 | 2,62 | ||||
| 2025-07-09 | 13F | Breakwater Capital Group | 45 160 | 27,33 | 562 | 26,29 | ||||
| 2025-08-13 | 13F | Guggenheim Capital Llc | 24 925 | 0,73 | 310 | 0,00 | ||||
| 2025-05-16 | 13F | Jones Financial Companies Lllp | 0 | −100,00 | 0 | |||||
| 2025-08-14 | 13F | Colony Group, LLC | 15 224 | −27,98 | 190 | −28,68 | ||||
| 2025-08-14 | 13F | Snowden Capital Advisors LLC | 13 583 | 23,72 | 169 | 23,36 | ||||
| 2025-05-14 | 13F | Karpus Management, Inc. | 0 | −100,00 | 0 | |||||
| 2025-08-14 | 13F | Royal Bank Of Canada | 765 162 | −57,31 | 9 526 | −57,68 | ||||
| 2025-08-12 | 13F | Summit Global Investments | 23 300 | 0,00 | 0 | |||||
| 2025-08-07 | 13F | Readystate Asset Management Lp | 112 465 | 664,29 | 1 400 | 660,87 | ||||
| 2025-07-23 | 13F | Bellevue Asset Management, Llc | 1 609 | −23,82 | 20 | −23,08 | ||||
| 2025-08-07 | 13F | CENTRAL TRUST Co | 300 | 0,00 | 4 | 0,00 | ||||
| 2025-08-07 | 13F | Kestra Private Wealth Services, Llc | 51 531 | −3,30 | 642 | −4,19 | ||||
| 2025-08-08 | 13F | Good Life Advisors, LLC | 61 212 | 180,43 | 762 | 178,10 | ||||
| 2025-08-12 | 13F | LPL Financial LLC | 764 110 | 5,62 | 9 513 | 4,70 | ||||
| 2025-08-14 | 13F | Kovitz Investment Group Partners, LLC | 27 266 | 0,00 | 339 | −0,88 | ||||
| 2025-08-08 | 13F | Calamos Advisors LLC | 26 347 | −8,00 | 328 | −8,64 | ||||
| 2025-04-25 | 13F | JNBA Financial Advisors | 0 | −100,00 | 0 | −100,00 | ||||
| 2025-08-01 | 13F | Pasadena Private Wealth, LLC | 15 883 | 0,51 | 198 | −0,51 | ||||
| 2025-08-14 | 13F | Wells Fargo & Company/mn | 962 289 | −4,79 | 11 980 | −5,62 | ||||
| 2025-06-12 | 13F/A | Deutsche Bank Ag\ | 0 | −100,00 | 0 | |||||
| 2025-08-04 | 13F | Assetmark, Inc | 1 136 | 24,84 | 14 | 27,27 | ||||
| 2025-08-13 | 13F | Rsm Us Wealth Management Llc | 13 993 | −1,40 | 174 | −2,25 | ||||
| 2025-08-08 | 13F | Cornerstone Advisors, LLC | 348 547 | 4 339 | ||||||
| 2025-08-05 | 13F | GPS Wealth Strategies Group, LLC | 850 | 0,00 | 11 | 0,00 | ||||
| 2025-08-12 | 13F | Proequities, Inc. | 0 | 0 | ||||||
| 2025-08-13 | 13F | Brown Advisory Inc | 19 593 | −25,39 | 244 | −26,14 | ||||
| 2025-07-31 | 13F | Oppenheimer & Co Inc | 137 984 | −5,47 | 1 718 | −6,33 | ||||
| 2025-07-14 | 13F | Sowell Financial Services LLC | 67 168 | 5,68 | 836 | 4,76 | ||||
| 2025-04-29 | 13F | Hm Payson & Co | 1 880 | 1,62 | 24 | 4,55 | ||||
| 2025-08-11 | 13F | HighTower Advisors, LLC | 69 194 | 32,56 | 861 | 31,45 | ||||
| 2025-08-11 | 13F | Strategic Wealth Partners, Ltd. | 4 560 | 57 | ||||||
| 2025-08-14 | 13F | Mariner, LLC | 514 854 | −0,46 | 6 410 | −1,34 | ||||
| 2025-07-08 | 13F | Nbc Securities, Inc. | 23 530 | 7,71 | 0 | |||||
| 2025-05-14 | 13F | Truvestments Capital Llc | 0 | −100,00 | 0 | |||||
| 2025-08-07 | 13F | Allworth Financial LP | 10 199 | −7,23 | 127 | −3,08 | ||||
| 2025-08-11 | 13F | Nations Financial Group Inc, /ia/ /adv | 13 402 | −15,40 | 167 | −16,16 | ||||
| 2025-07-21 | 13F | Future Financial Wealth Managment LLC | 65 086 | 2,50 | 810 | 1,63 | ||||
| 2025-08-13 | 13F | VestGen Advisors, LLC | 11 000 | 0,00 | 135 | −2,17 | ||||
| 2025-08-14 | 13F | Stifel Financial Corp | 71 302 | 31,57 | 888 | 30,44 | ||||
| 2025-08-04 | 13F | Kovack Advisors, Inc. | 15 195 | 189 | ||||||
| 2025-08-08 | 13F | Creative Planning | 38 946 | −5,43 | 485 | −6,38 | ||||
| 2025-07-17 | 13F | Nelson, Van Denburg & Campbell Wealth Management Group, LLC | 55 236 | −4,79 | 688 | −5,63 | ||||
| 2025-08-14 | 13F | Raymond James Financial Inc | 2 055 112 | 4,82 | 25 586 | 3,90 | ||||
| 2025-05-06 | 13F | Avantax Advisory Services, Inc. | 0 | −100,00 | 0 |