Grundläggande statistik
| Institutionella ägare | 125 total, 124 long only, 0 short only, 1 long/short - change of 13,51% MRQ |
| Genomsnittlig portföljallokering | 0.0661 % - change of −24,71% MRQ |
| Institutionella aktier (lång) | 3 510 102 (ex 13D/G) - change of 0,09MM shares 2,52% MRQ |
| Institutionellt värde (lång) | $ 190 498 USD ($1000) |
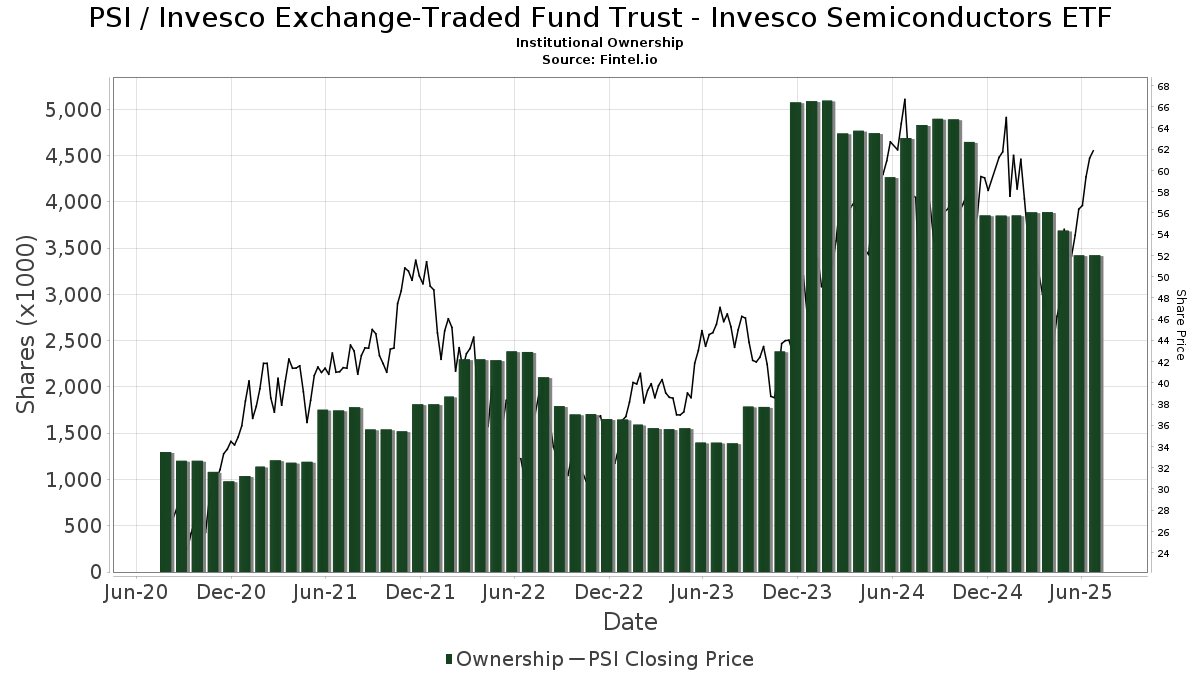
Institutionellt ägande och aktieägare
Invesco Exchange-Traded Fund Trust - Invesco Semiconductors ETF (US:PSI) har 125 Institutionella ägare och aktieägare som har lämnat in 13D/G- eller 13F-formulär till Securities Exchange Commission (SEC). Dessa institut innehar totalt 3,510,102 aktier. Största aktieägare inkluderar LPL Financial LLC, Morgan Stanley, Captrust Financial Advisors, Cetera Investment Advisers, Bank Of America Corp /de/, HighTower Advisors, LLC, Ameriprise Financial Inc, Envestnet Asset Management Inc, UBS Group AG, and Mercer Global Advisors Inc /adv .
Invesco Exchange-Traded Fund Trust - Invesco Semiconductors ETF (ARCA:PSI) Institutionell ägarstruktur visar institutioners och fonders nuvarande positioner i företaget, samt de senaste förändringarna i positionernas storlek. Större aktieägare kan vara enskilda investerare, fonder, hedgefonder eller institutioner. Bilaga 13D visar att investeraren äger (eller ägde) mer än 5% av företaget och avser (eller avsåg) att aktivt eftersträva en förändring av affärsstrategin. Schedule 13G indikerar en passiv investering på över 5%.
The share price as of September 12, 2025 is 67,17 / share. Previously, on September 13, 2024, the share price was 54,66 / share. This represents an increase of 22,89% over that period.
Fondsentimentets poäng
Fondsentimentet poängen(fka Ägarackumulation-poäng) visar vilka aktier som är mest köpta av fonder. Det är resultatet av en sofistikerad kvantitativ flerfaktormodell som identifierar företag med de högsta nivåerna av institutionell ackumulering. Poängsättningsmodellen använder en kombination av den totala ökningen av redovisade ägare, förändringarna i portföljallokeringarna för dessa ägare och andra mått. Siffran sträcker sig från 0 till 100, där högre siffror indikerar en högre nivå av ackumulering i förhållande till sina konkurrenter, och 50 är genomsnittet.
Uppdateringsfrekvens: Dagligen
Se Ownership Explorer, som innehåller en lista över de högst rankade företagen.
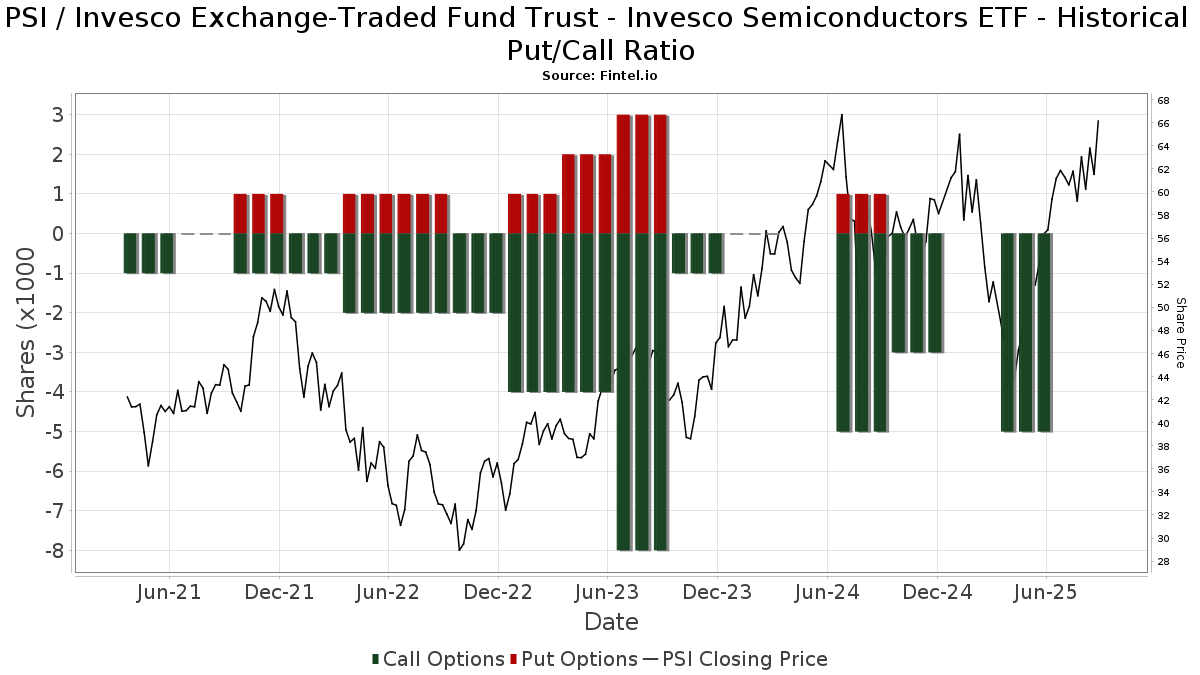
Institutionell sälj/köp-kvot
Förutom att rapportera vanliga eget kapital- och skuldemissioner måste institutioner med mer än 100MM tillgångar under förvaltning också avslöja sina innehav av sälj- och köpoptioner. Eftersom säljoptioner i allmänhet indikerar ett negativt sentiment och köpoptioner indikerar ett positivt sentiment, kan vi få en uppfattning om det övergripande institutionella sentimentet genom att plotta förhållandet mellan säljoptioner och köpoptioner. Diagrammet till höger visar det historiska förhållandet mellan sälj- och köpoptioner för detta instrument.
Genom att använda sälj/köp-kvoten som en indikator på aktieägarnas sentiment undviker man en av de största bristerna med att använda det totala institutionella ägandet, nämligen att en betydande del av de förvaltade tillgångarna investeras passivt för att följa index. Passivt förvaltade fonder köper vanligtvis inte optioner, så indikatorn för sälj/köp-kvoten ger en bättre bild av stämningen i aktivt förvaltade fonder.
13F- och NPORT-arkiveringar
Detaljer om 13F-arkiveringar är gratis. Detaljer om NP-arkiveringar kräver ett premiummedlemskap. Gröna rader indikerar nya positioner. Röda rader indikerar stängda positioner. Klicka på länk symbolen för att se hela transaktionshistoriken.
Uppgradera
för att låsa upp premiumdata och exportera till Excel ![]() .
.
| Fil Datum | Källa | Investerare | Typ | Genomsnittligt pris (beräknat) |
Aktier | Δ Aktier (%) |
Rapporterat värde (1000 USD) |
Δ Värde (%) |
Portföljallokering (%) |
|
|---|---|---|---|---|---|---|---|---|---|---|
| 2025-07-24 | 13F | WMG Financial Advisors, LLC | 4 413 | −0,45 | 265 | 25,71 | ||||
| 2025-08-06 | 13F | Aspect Partners, LLC | 911 | 0,00 | 55 | 25,58 | ||||
| 2025-08-14 | 13F | Susquehanna International Group, Llp | 19 542 | 232,86 | 1 172 | 321,22 | ||||
| 2025-05-14 | 13F | Capital Wealth Alliance, LLC | 0 | −100,00 | 0 | |||||
| 2025-08-14 | 13F | CoreCap Advisors, LLC | 564 | 0,00 | 34 | 26,92 | ||||
| 2025-08-14 | 13F | Wells Fargo & Company/mn | 2 101 | 249,00 | 126 | 346,43 | ||||
| 2025-08-14 | 13F | Federation des caisses Desjardins du Quebec | 130 | 8 | ||||||
| 2025-05-02 | 13F | Signaturefd, Llc | 0 | −100,00 | 0 | |||||
| 2025-08-14 | 13F | Bank Of America Corp /de/ | 188 920 | −0,63 | 11 328 | 25,76 | ||||
| 2025-07-10 | 13F | Wealth Enhancement Advisory Services, Llc | 3 264 | −16,09 | 202 | −9,87 | ||||
| 2025-08-13 | 13F | Millington Financial Advisors, LLC | 0 | −100,00 | 0 | |||||
| 2025-07-18 | 13F | Truist Financial Corp | 5 448 | −0,13 | 327 | 26,36 | ||||
| 2025-08-11 | 13F | Private Advisor Group, LLC | 44 679 | 7,96 | 2 679 | 36,63 | ||||
| 2025-08-12 | 13F | LPL Financial LLC | 335 368 | −43,78 | 20 109 | −28,86 | ||||
| 2025-08-04 | 13F | Flagship Harbor Advisors, Llc | 8 049 | −2,31 | 483 | 23,59 | ||||
| 2025-08-25 | 13F/A | Neuberger Berman Group LLC | 4 323 | 0,00 | 259 | 26,96 | ||||
| 2025-08-14 | 13F | IHT Wealth Management, LLC | 4 954 | 297 | ||||||
| 2025-08-14 | 13F | Comerica Bank | 47 | 0,00 | 3 | 0,00 | ||||
| 2025-08-14 | 13F | Arete Wealth Advisors, LLC | 34 741 | 2 | ||||||
| 2025-07-24 | 13F | Ulland Investment Advisors, LLC | 5 010 | −51,01 | 0 | |||||
| 2025-07-22 | 13F | Valley National Advisers Inc | 2 071 | 0,00 | 0 | |||||
| 2025-08-12 | 13F | Steward Partners Investment Advisory, Llc | 415 | 0,00 | 25 | 26,32 | ||||
| 2025-07-22 | 13F | Wealthcare Advisory Partners LLC | 4 161 | 249 | ||||||
| 2025-07-23 | 13F | Meitav Dash Investments Ltd | 91 446 | 0,00 | 5 483 | 26,57 | ||||
| 2025-05-12 | 13F | Independent Advisor Alliance | 0 | −100,00 | 0 | |||||
| 2025-08-14 | 13F | Bnp Paribas Arbitrage, Sa | 40 000 | 2 398 | ||||||
| 2025-07-30 | 13F | Evermay Wealth Management Llc | 0 | −100,00 | 0 | |||||
| 2025-05-13 | 13F | Tocqueville Asset Management L.p. | 0 | −100,00 | 0 | |||||
| 2025-04-23 | 13F | Mascagni Wealth Management, Inc. | 0 | −100,00 | 0 | −100,00 | ||||
| 2025-08-08 | 13F | Larson Financial Group LLC | 51 | 0,00 | 3 | 50,00 | ||||
| 2025-08-07 | 13F | CENTRAL TRUST Co | 0 | −100,00 | 0 | −100,00 | ||||
| 2025-03-21 | 13F | Prostatis Group LLC | 0 | −100,00 | 0 | −100,00 | ||||
| 2025-08-14 | 13F | First Foundation Advisors | 7 022 | 0,00 | 421 | 26,81 | ||||
| 2025-08-14 | 13F | Goldman Sachs Group Inc | 80 371 | 62,45 | 4 819 | 105,59 | ||||
| 2025-07-25 | 13F | Valley Brook Capital Group, Inc. | 10 385 | −6,05 | 623 | 18,93 | ||||
| 2025-08-08 | 13F | WASHINGTON TRUST Co | 0 | −100,00 | 0 | |||||
| 2025-07-22 | 13F | Belpointe Asset Management LLC | 9 462 | 0,00 | 567 | 26,56 | ||||
| 2025-08-11 | 13F | Cornerstone Planning Group LLC | 24 | 1 | ||||||
| 2025-08-12 | 13F | Financial Advocates Investment Management | 0 | −100,00 | 0 | −100,00 | ||||
| 2025-08-14 | 13F | Colony Group, LLC | 5 256 | 0,11 | 315 | 27,02 | ||||
| 2025-07-29 | 13F | Harbor Asset Planning, Inc. | 647 | 39 | ||||||
| 2025-07-31 | 13F | Cambridge Investment Research Advisors, Inc. | 95 123 | −6,00 | 6 | 25,00 | ||||
| 2025-08-04 | 13F | WNY Asset Management, LLC | 3 914 | 235 | ||||||
| 2025-07-30 | 13F | Capstone Triton Financial Group, LLC | 18 530 | 22,31 | 1 111 | 26,68 | ||||
| 2025-07-25 | 13F | Atria Wealth Solutions, Inc. | 9 591 | −56,13 | 575 | −44,44 | ||||
| 2025-05-05 | 13F | J.w. Cole Advisors, Inc. | 0 | −100,00 | 0 | −100,00 | ||||
| 2025-08-14 | 13F | Mercer Global Advisors Inc /adv | 112 225 | 2,62 | 6 729 | 29,86 | ||||
| 2025-08-11 | 13F | Principal Securities, Inc. | 17 958 | −4,92 | 1 077 | −1,56 | ||||
| 2025-08-14 | 13F | UBS Group AG | 137 632 | −21,15 | 8 252 | −0,22 | ||||
| 2025-08-13 | 13F | Cheviot Value Management, LLC | 300 | 0,00 | 18 | 28,57 | ||||
| 2025-08-15 | 13F | Morgan Stanley | 247 211 | −1,77 | 14 823 | 24,31 | ||||
| 2025-08-19 | 13F | Advisory Services Network, LLC | 48 932 | −5,22 | 2 911 | 19,01 | ||||
| 2025-08-15 | 13F | Captrust Financial Advisors | 243 386 | 33,16 | 14 593 | 68,53 | ||||
| 2025-07-24 | 13F | Blair William & Co/il | 8 | 0,00 | 0 | |||||
| 2025-07-30 | 13F | Whittier Trust Co Of Nevada Inc | 2 972 | 178 | ||||||
| 2025-07-22 | 13F | Grimes & Company, Inc. | 8 553 | 513 | ||||||
| 2025-08-08 | 13F | Cetera Investment Advisers | 207 094 | 5,96 | 12 417 | 34,09 | ||||
| 2025-08-05 | 13F | Tsfg, Llc | 0 | −100,00 | 0 | |||||
| 2025-04-25 | 13F | Sovran Advisors, LLC | 0 | −100,00 | 0 | |||||
| 2025-05-02 | 13F | Transcendent Capital Group LLC | 0 | −100,00 | 0 | |||||
| 2025-08-13 | 13F | Summit Financial, LLC | 19 656 | 1 179 | ||||||
| 2025-08-14 | 13F | Sunbelt Securities, Inc. | 31 | 0,00 | 2 | 0,00 | ||||
| 2025-08-14 | 13F | Money Concepts Capital Corp | 4 187 | 251 | ||||||
| 2025-07-15 | 13F | Main Street Group, LTD | 121 | 0,00 | 7 | 40,00 | ||||
| 2025-08-14 | 13F | Jane Street Group, Llc | 14 722 | 29,19 | 883 | 63,64 | ||||
| 2025-09-11 | 13F | Silicon Valley Capital Partners | 302 | 18 | ||||||
| 2025-08-15 | 13F | Tower Research Capital LLC (TRC) | 11 916 | 169,96 | 714 | 241,63 | ||||
| 2025-07-15 | 13F | Carr Financial Group Corp | 0 | −100,00 | 0 | |||||
| 2025-08-06 | 13F | Prospera Financial Services Inc | 14 857 | 3,22 | 891 | 30,65 | ||||
| 2025-07-15 | 13F | Capstone Wealth Management Group LLC | 3 452 | 207 | ||||||
| 2025-08-06 | 13F | AE Wealth Management LLC | 9 746 | 5,02 | 584 | 33,03 | ||||
| 2025-08-13 | 13F | Northwestern Mutual Wealth Management Co | 35 207 | −33,78 | 2 111 | −16,20 | ||||
| 2025-07-31 | 13F | Sage Mountain Advisors LLC | 190 | 0,00 | 11 | 22,22 | ||||
| 2025-07-30 | 13F | Strategic Blueprint, LLC | 25 044 | 1,93 | 1 502 | 28,95 | ||||
| 2025-08-11 | 13F | HighTower Advisors, LLC | 176 111 | 3 894,35 | 10 560 | 4 976,44 | ||||
| 2025-07-18 | 13F | Institute for Wealth Management, LLC. | 4 365 | 0,00 | 262 | 26,70 | ||||
| 2025-08-11 | 13F | Aptus Capital Advisors, LLC | 50 | 100,00 | 3 | 100,00 | ||||
| 2025-07-18 | 13F | PFG Investments, LLC | 8 970 | 0,92 | 538 | 27,55 | ||||
| 2025-08-12 | 13F | CIBC Private Wealth Group, LLC | 795 | 0,00 | 48 | 51,61 | ||||
| 2025-07-29 | 13F | Private Trust Co Na | 1 049 | 0,00 | 63 | 26,53 | ||||
| 2025-08-01 | 13F | Envestnet Asset Management Inc | 141 803 | −7,71 | 8 503 | 16,80 | ||||
| 2025-08-14 | 13F | Lebenthal Global Advisors, LLC | 3 950 | 237 | ||||||
| 2025-07-08 | 13F | Nbc Securities, Inc. | 957 | −5,90 | 0 | |||||
| 2025-08-11 | 13F | SFI Advisors, LLC | 13 048 | −8,38 | 782 | 16,02 | ||||
| 2025-08-14 | 13F | Integrated Wealth Concepts LLC | 14 917 | 0,61 | 894 | 27,35 | ||||
| 2025-08-18 | 13F/A | National Bank Of Canada /fi/ | 82 405 | 4,27 | 4 941 | 31,87 | ||||
| 2025-08-12 | 13F | Argent Trust Co | 4 803 | 0,00 | 288 | 26,43 | ||||
| 2025-04-28 | 13F | Strategic Financial Concepts, LLC | 0 | −100,00 | 0 | −100,00 | ||||
| 2025-05-06 | 13F | Proficio Capital Partners LLC | 0 | −100,00 | 0 | −100,00 | ||||
| 2025-08-05 | 13F | Bank Of Montreal /can/ | 482 | −45,54 | 29 | −31,71 | ||||
| 2025-08-14 | 13F | Ameriprise Financial Inc | 151 834 | 833,90 | 9 129 | 1 085,45 | ||||
| 2025-07-21 | 13F | Ameriflex Group, Inc. | 17 | 0,00 | 1 | |||||
| 2025-08-19 | 13F | National Asset Management, Inc. | 12 129 | −49,14 | 727 | −47,36 | ||||
| 2025-05-16 | 13F | Coppell Advisory Solutions LLC | 0 | −100,00 | 0 | |||||
| 2025-07-11 | 13F | Farther Finance Advisors, LLC | 1 005 | 458,33 | 60 | 650,00 | ||||
| 2025-08-14 | 13F | Citadel Advisors Llc | 12 949 | 776 | ||||||
| 2025-07-28 | 13F | Mission Hills Financial Advisory, LLC | 15 524 | −1,95 | 931 | 24,00 | ||||
| 2025-07-31 | 13F | Oppenheimer & Co Inc | 10 763 | 75,78 | 645 | 122,41 | ||||
| 2025-08-04 | 13F | Kovack Advisors, Inc. | 4 987 | −8,78 | 299 | 15,44 | ||||
| 2025-05-06 | 13F | Venturi Wealth Management, LLC | 0 | −100,00 | 0 | |||||
| 2025-08-07 | 13F | Atala Financial Inc | 0 | −100,00 | 0 | |||||
| 2025-08-07 | 13F | PFG Advisors | 5 229 | 314 | ||||||
| 2025-05-12 | 13F | Y.D. More Investments Ltd | 0 | −100,00 | 0 | |||||
| 2025-08-12 | 13F | Jpmorgan Chase & Co | 3 744 | 0,00 | 224 | 26,55 | ||||
| 2025-08-14 | 13F | Raymond James Financial Inc | 99 852 | −16,58 | 5 987 | 5,57 | ||||
| 2025-08-12 | 13F | O'shaughnessy Asset Management, Llc | 0 | −100,00 | 0 | |||||
| 2025-09-04 | 13F/A | Advisor Group Holdings, Inc. | 62 568 | −20,81 | 3 751 | 0,21 | ||||
| 2025-04-21 | 13F | SILVER OAK SECURITIES, Inc | 0 | −100,00 | 0 | |||||
| 2025-08-11 | 13F | Capital Square, LLC | 5 812 | 1,75 | 359 | 32,59 | ||||
| 2025-08-14 | 13F | Benjamin Edwards Inc | 7 354 | 441 | ||||||
| 2025-07-14 | 13F | Sowell Financial Services LLC | 0 | −100,00 | 0 | |||||
| 2025-08-14 | 13F | Mariner, LLC | 8 500 | 7,36 | 510 | 35,73 | ||||
| 2025-07-16 | 13F | Perigon Wealth Management, LLC | 4 405 | 0,00 | 264 | 26,92 | ||||
| 2025-08-06 | 13F | Commonwealth Equity Services, Llc | 65 759 | −4,04 | 4 | 0,00 | ||||
| 2025-08-06 | 13F | Mark Sheptoff Financial Planning, Llc | 175 | 0,00 | 10 | 25,00 | ||||
| 2025-05-01 | 13F | Fifth Third Securities, Inc. | 0 | −100,00 | 0 | |||||
| 2025-08-14 | 13F | Fmr Llc | 2 023 | −23,83 | 121 | −3,20 | ||||
| 2025-08-14 | 13F | Royal Bank Of Canada | 74 651 | −18,21 | 4 476 | 3,49 | ||||
| 2025-08-12 | 13F | Yahav Achim Ve Achayot - Provident Funds Management Co Ltd. | 19 122 | 0,00 | 1 147 | 26,74 | ||||
| 2025-05-15 | 13F | StoneX Group Inc. | 0 | −100,00 | 0 | −100,00 | ||||
| 2025-08-04 | 13F | Spire Wealth Management | 2 456 | −1,92 | 147 | 24,58 | ||||
| 2025-08-12 | 13F | Proequities, Inc. | 0 | 0 | ||||||
| 2025-08-08 | 13F | Pnc Financial Services Group, Inc. | 9 070 | −18,66 | 544 | 2,84 | ||||
| 2025-08-12 | 13F | Global Retirement Partners, LLC | 1 408 | 0,00 | 84 | 3,70 | ||||
| 2025-05-12 | 13F | Citigroup Inc | 0 | −100,00 | 0 | |||||
| 2025-08-07 | 13F | Kestra Private Wealth Services, Llc | 5 196 | −23,96 | 312 | −3,72 | ||||
| 2025-07-17 | 13F | Sound Income Strategies, LLC | 29 | 2 | ||||||
| 2025-07-18 | 13F | McGuire Investment Group, LLC | 4 698 | 0,00 | 282 | 26,58 | ||||
| 2025-08-14 | 13F | Optiver Holding B.V. | 24 207 | 1 451 | ||||||
| 2025-05-15 | 13F | CAPROCK Group, Inc. | 12 564 | 0,00 | 595 | −18,16 | ||||
| 2025-07-28 | 13F | Harbour Investments, Inc. | 4 657 | −9,68 | 279 | 14,34 | ||||
| 2025-07-21 | 13F | DHJJ Financial Advisors, Ltd. | 1 | 0,00 | 0 | |||||
| 2025-08-06 | 13F | Golden State Wealth Management, LLC | 75 | 0,00 | 5 | 33,33 | ||||
| 2025-08-14 | 13F | EP Wealth Advisors, Inc. | 7 856 | −47,79 | 471 | −33,85 | ||||
| 2025-08-14 | 13F | KKM Financial LLC | 6 850 | −10,02 | 411 | 13,89 | ||||
| 2025-08-01 | 13F | Belvedere Trading LLC | Call | 5 600 | 336 | |||||
| 2025-08-01 | 13F | Belvedere Trading LLC | Put | 700 | 42 | |||||
| 2025-05-01 | 13F | WESPAC Advisors, LLC | 0 | −100,00 | 0 | |||||
| 2025-08-05 | 13F | Simplex Trading, Llc | 753 | 818,29 | 0 | |||||
| 2025-08-14 | 13F | Mml Investors Services, Llc | 85 783 | −29,05 | 5 | 0,00 | ||||
| 2025-08-04 | 13F | Bay Colony Advisory Group, Inc d/b/a Bay Colony Advisors | 9 279 | −1,56 | 556 | 23,83 | ||||
| 2025-08-19 | 13F | Newbridge Financial Services Group, Inc. | 180 | −21,74 | 11 | 0,00 | ||||
| 2025-07-24 | 13F | Us Bancorp \de\ | 229 | 0,00 | 14 | 30,00 | ||||
| 2025-08-27 | NP | FFOX - FundX Future Fund Opportunities ETF | 510 | 31 | ||||||
| 2025-08-11 | 13F | VSM Wealth Advisory, LLC | 425 | 0,00 | 25 | 25,00 | ||||
| 2025-08-13 | 13F | Jones Financial Companies Lllp | 21 588 | 31,11 | 1 294 | 64,84 | ||||
| 2025-08-13 | 13F | Flow Traders U.s. Llc | 6 095 | 0 | ||||||
| 2025-08-08 | 13F | Mv Capital Management, Inc. | 750 | 0,00 | 45 | 25,71 | ||||
| 2025-08-13 | 13F | M Holdings Securities, Inc. | 20 326 | 1 | ||||||
| 2025-07-17 | 13F | Janney Montgomery Scott LLC | 3 725 | −29,98 | 0 | |||||
| 2025-07-29 | 13F | Koshinski Asset Management, Inc. | 8 448 | −3,26 | 507 | 22,52 | ||||
| 2025-04-29 | 13F | Capital Investment Advisory Services, LLC | 0 | −100,00 | 0 | −100,00 | ||||
| 2025-07-25 | 13F | Cwm, Llc | 9 664 | 31,70 | 1 | |||||
| 2025-08-14 | 13F | Stifel Financial Corp | 14 605 | 876 | ||||||
| 2025-08-14 | 13F | DRW Securities, LLC | 14 024 | 22,16 | 841 | 54,70 | ||||
| 2025-08-08 | 13F | Creative Planning | 5 859 | 351 | ||||||
| 2025-08-05 | 13F | GPS Wealth Strategies Group, LLC | 50 | −28,57 | 3 | −33,33 | ||||
| 2025-04-23 | 13F | Golden State Equity Partners | 0 | −100,00 | 0 |
Other Listings
| MX:PSI |