Grundläggande statistik
| Institutionella ägare | 139 total, 139 long only, 0 short only, 0 long/short - change of 7,75% MRQ |
| Genomsnittlig portföljallokering | 0.0535 % - change of −1,73% MRQ |
| Institutionella aktier (lång) | 7 112 435 (ex 13D/G) - change of −0,39MM shares −5,18% MRQ |
| Institutionellt värde (lång) | $ 364 583 USD ($1000) |
Institutionellt ägande och aktieägare
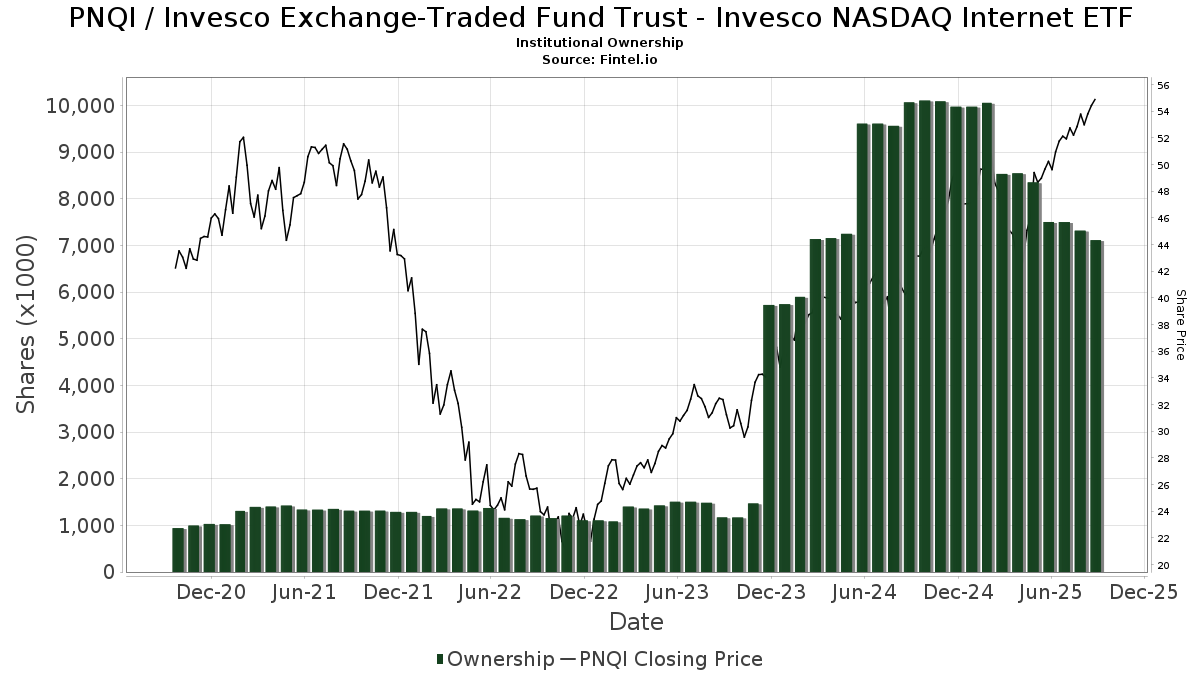
Invesco Exchange-Traded Fund Trust - Invesco NASDAQ Internet ETF (US:PNQI) har 139 Institutionella ägare och aktieägare som har lämnat in 13D/G- eller 13F-formulär till Securities Exchange Commission (SEC). Dessa institut innehar totalt 7,112,435 aktier. Största aktieägare inkluderar Fisher Asset Management, LLC, UBS Group AG, HighTower Advisors, LLC, Morgan Stanley, LPL Financial LLC, Wells Fargo & Company/mn, Bank Of America Corp /de/, Royal Bank Of Canada, Goldman Sachs Group Inc, and Raymond James Financial Inc .
Invesco Exchange-Traded Fund Trust - Invesco NASDAQ Internet ETF (NasdaqGM:PNQI) Institutionell ägarstruktur visar institutioners och fonders nuvarande positioner i företaget, samt de senaste förändringarna i positionernas storlek. Större aktieägare kan vara enskilda investerare, fonder, hedgefonder eller institutioner. Bilaga 13D visar att investeraren äger (eller ägde) mer än 5% av företaget och avser (eller avsåg) att aktivt eftersträva en förändring av affärsstrategin. Schedule 13G indikerar en passiv investering på över 5%.
The share price as of September 16, 2025 is 56,27 / share. Previously, on September 17, 2024, the share price was 41,48 / share. This represents an increase of 35,64% over that period.
Fondsentimentets poäng
Fondsentimentet poängen(fka Ägarackumulation-poäng) visar vilka aktier som är mest köpta av fonder. Det är resultatet av en sofistikerad kvantitativ flerfaktormodell som identifierar företag med de högsta nivåerna av institutionell ackumulering. Poängsättningsmodellen använder en kombination av den totala ökningen av redovisade ägare, förändringarna i portföljallokeringarna för dessa ägare och andra mått. Siffran sträcker sig från 0 till 100, där högre siffror indikerar en högre nivå av ackumulering i förhållande till sina konkurrenter, och 50 är genomsnittet.
Uppdateringsfrekvens: Dagligen
Se Ownership Explorer, som innehåller en lista över de högst rankade företagen.
Institutionell sälj/köp-kvot
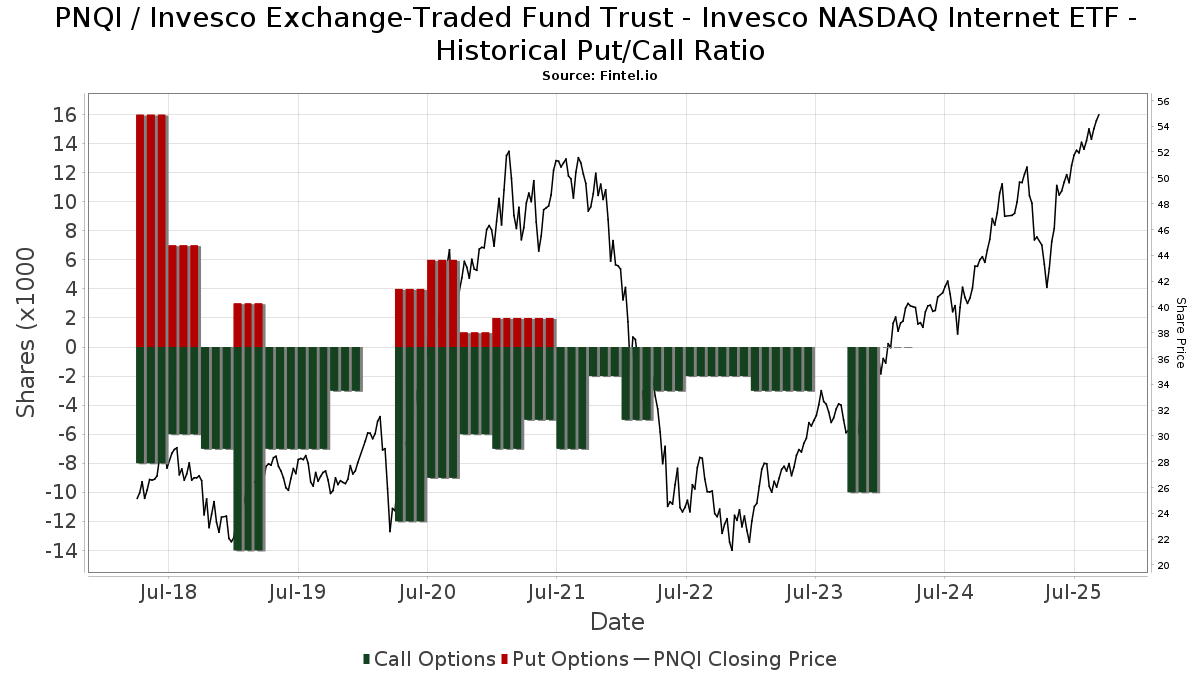
Förutom att rapportera vanliga eget kapital- och skuldemissioner måste institutioner med mer än 100MM tillgångar under förvaltning också avslöja sina innehav av sälj- och köpoptioner. Eftersom säljoptioner i allmänhet indikerar ett negativt sentiment och köpoptioner indikerar ett positivt sentiment, kan vi få en uppfattning om det övergripande institutionella sentimentet genom att plotta förhållandet mellan säljoptioner och köpoptioner. Diagrammet till höger visar det historiska förhållandet mellan sälj- och köpoptioner för detta instrument.
Genom att använda sälj/köp-kvoten som en indikator på aktieägarnas sentiment undviker man en av de största bristerna med att använda det totala institutionella ägandet, nämligen att en betydande del av de förvaltade tillgångarna investeras passivt för att följa index. Passivt förvaltade fonder köper vanligtvis inte optioner, så indikatorn för sälj/köp-kvoten ger en bättre bild av stämningen i aktivt förvaltade fonder.
13F- och NPORT-arkiveringar
Detaljer om 13F-arkiveringar är gratis. Detaljer om NP-arkiveringar kräver ett premiummedlemskap. Gröna rader indikerar nya positioner. Röda rader indikerar stängda positioner. Klicka på länk symbolen för att se hela transaktionshistoriken.
Uppgradera
för att låsa upp premiumdata och exportera till Excel ![]() .
.
| Fil Datum | Källa | Investerare | Typ | Genomsnittligt pris (beräknat) |
Aktier | Δ Aktier (%) |
Rapporterat värde (1000 USD) |
Δ Värde (%) |
Portföljallokering (%) |
|
|---|---|---|---|---|---|---|---|---|---|---|
| 2025-08-12 | 13F | Edmond De Rothschild Holding S.a. | 650 | 0,00 | 34 | 17,86 | ||||
| 2025-08-08 | 13F | Cetera Investment Advisers | 21 475 | −1,84 | 1 121 | 16,17 | ||||
| 2025-07-10 | 13F | Wealth Enhancement Advisory Services, Llc | 14 773 | 9,02 | 771 | 28,93 | ||||
| 2025-07-24 | 13F | WMG Financial Advisors, LLC | 5 798 | 5,92 | 303 | 25,31 | ||||
| 2025-08-11 | 13F | Aptus Capital Advisors, LLC | 667 | 0,00 | 35 | 17,24 | ||||
| 2025-07-30 | 13F | Pacific Sun Financial Corp | 48 900 | −0,10 | 2 553 | 18,19 | ||||
| 2025-08-14 | 13F | Comerica Bank | 15 224 | −0,83 | 795 | 17,28 | ||||
| 2025-08-14 | 13F | Susquehanna International Group, Llp | 11 676 | 122,78 | 610 | 163,64 | ||||
| 2025-04-29 | 13F | Lee Danner & Bass Inc | 0 | −100,00 | 0 | −100,00 | ||||
| 2025-05-12 | 13F | Sandy Spring Bank | 1 500 | 0,00 | 66 | −5,71 | ||||
| 2025-07-18 | 13F | Truist Financial Corp | 72 590 | −1,41 | 3 790 | 16,62 | ||||
| 2025-08-18 | 13F | Goodman Advisory Group, LLC | 0 | −100,00 | 0 | |||||
| 2025-07-22 | 13F | Gsa Capital Partners Llp | 4 034 | 0 | ||||||
| 2025-08-05 | 13F | NewSquare Capital LLC | 75 | 4 | ||||||
| 2025-07-17 | 13F | Robbins Farley Llc | 3 593 | −13,73 | 188 | 2,19 | ||||
| 2025-08-11 | 13F | HighTower Advisors, LLC | 651 649 | 0,15 | 34 023 | 18,49 | ||||
| 2025-08-14 | 13F | Jane Street Group, Llc | 0 | −100,00 | 0 | |||||
| 2025-07-10 | 13F | Global Financial Private Client, LLC | 6 690 | 0,00 | 349 | 18,31 | ||||
| 2025-08-12 | 13F | O'shaughnessy Asset Management, Llc | 821 | 0,00 | 43 | 16,67 | ||||
| 2025-08-05 | 13F | Westside Investment Management, Inc. | 1 140 | 0,00 | 60 | 18,00 | ||||
| 2025-08-06 | 13F | Texas Yale Capital Corp. | 25 150 | 0,00 | 1 313 | 18,39 | ||||
| 2025-07-25 | 13F | Cwm, Llc | 246 | 95,24 | 0 | |||||
| 2025-07-30 | 13F | Evermay Wealth Management Llc | 0 | −100,00 | 0 | |||||
| 2025-08-11 | 13F | Private Advisor Group, LLC | 33 579 | 0,35 | 1 753 | 18,77 | ||||
| 2025-08-13 | 13F | Colonial Trust Co / SC | 4 401 | 3,41 | 230 | 22,46 | ||||
| 2025-08-14 | 13F | Qube Research & Technologies Ltd | 130 | 0,00 | 7 | 20,00 | ||||
| 2025-08-14 | 13F | Wiley Bros.-aintree Capital, Llc | 3 947 | 205 | ||||||
| 2025-08-12 | 13F | Steward Partners Investment Advisory, Llc | 1 470 | 0,00 | 77 | 18,75 | ||||
| 2025-07-16 | 13F | Beaumont Financial Advisors, LLC | 4 000 | 209 | ||||||
| 2025-08-12 | 13F | LPL Financial LLC | 415 174 | −10,61 | 21 676 | 5,76 | ||||
| 2025-08-14 | 13F | Goldman Sachs Group Inc | 230 073 | 0,00 | 12 012 | 18,31 | ||||
| 2025-07-18 | 13F | SOA Wealth Advisors, LLC. | 160 | 0,00 | 8 | 14,29 | ||||
| 2025-08-14 | 13F | Boston Private Wealth Llc | 0 | −100,00 | 0 | |||||
| 2025-08-15 | 13F | Kestra Advisory Services, LLC | 4 504 | 235 | ||||||
| 2025-08-14 | 13F | Sunbelt Securities, Inc. | 1 100 | 0,00 | 51 | 6,25 | ||||
| 2025-07-16 | 13F | Meridian Investment Counsel Inc. | 4 165 | 217 | ||||||
| 2025-08-13 | 13F | GeoWealth Management, LLC | 66 545 | −31,04 | 3 474 | −18,41 | ||||
| 2025-07-11 | 13F | Farther Finance Advisors, LLC | 410 | 0,00 | 21 | 16,67 | ||||
| 2025-07-30 | 13F | Whittier Trust Co | 155 | 0,00 | 8 | 33,33 | ||||
| 2025-04-14 | 13F | Pallas Capital Advisors LLC | 0 | −100,00 | 0 | |||||
| 2025-08-12 | 13F | Proequities, Inc. | 0 | 0 | ||||||
| 2025-08-07 | 13F | Hennion & Walsh Asset Management, Inc. | 10 110 | −0,88 | 528 | 17,11 | ||||
| 2025-07-16 | 13F | Minichmacgregor Wealth Management, Llc | 7 410 | −5,99 | 387 | 11,24 | ||||
| 2025-08-11 | 13F | Wealthspire Advisors, LLC | 7 680 | 0,00 | 401 | 18,34 | ||||
| 2025-07-14 | 13F | Abound Wealth Management | 92 | 0,00 | 5 | 0,00 | ||||
| 2025-07-30 | 13F | Onyx Bridge Wealth Group LLC | 9 915 | −23,35 | 518 | −9,30 | ||||
| 2025-08-13 | 13F | Financial Freedom, LLC | 1 100 | 0,00 | 57 | 18,75 | ||||
| 2025-07-22 | 13F | Merit Financial Group, LLC | 22 559 | −1,21 | 1 178 | 16,88 | ||||
| 2025-08-12 | 13F | J.w. Cole Advisors, Inc. | 15 975 | −6,95 | 834 | 10,17 | ||||
| 2025-05-01 | 13F | Grant/GrossMendelsohn, LLC | 0 | −100,00 | 0 | |||||
| 2025-08-06 | 13F | Commonwealth Equity Services, Llc | 29 660 | −2,11 | 2 | 0,00 | ||||
| 2025-07-21 | 13F | Ameritas Advisory Services, LLC | 651 | 34 | ||||||
| 2025-07-24 | 13F | Blair William & Co/il | 10 045 | 0,00 | 524 | 18,28 | ||||
| 2025-08-11 | 13F | Principal Securities, Inc. | 634 | 10,45 | 33 | 26,92 | ||||
| 2025-08-14 | 13F | Fmr Llc | 20 496 | 26,65 | 1 070 | 49,86 | ||||
| 2025-08-13 | 13F | Northwestern Mutual Wealth Management Co | 6 259 | −6,82 | 327 | 10,14 | ||||
| 2025-04-10 | 13F | TruWealth Advisors, LLC | 0 | −100,00 | 0 | −100,00 | ||||
| 2025-07-30 | 13F | Schnieders Capital Management Llc | 7 660 | 0,00 | 400 | 18,05 | ||||
| 2025-04-01 | 13F | Massmutual Trust Co Fsb/adv | 0 | −100,00 | 0 | |||||
| 2025-08-06 | 13F | Prospera Financial Services Inc | 8 626 | −5,63 | 450 | 11,66 | ||||
| 2025-08-08 | 13F | Creative Planning | 11 485 | 1,19 | 600 | 19,80 | ||||
| 2025-08-15 | 13F | Tower Research Capital LLC (TRC) | 8 900 | 4,72 | 465 | 23,73 | ||||
| 2025-05-14 | 13F | Barometer Capital Management Inc. | 0 | −100,00 | 0 | |||||
| 2025-07-15 | 13F | Santori & Peters, Inc. | 40 844 | 0,00 | 2 132 | 18,31 | ||||
| 2025-08-14 | 13F | Wells Fargo & Company/mn | 239 900 | −0,97 | 12 525 | 17,17 | ||||
| 2025-08-14 | 13F | GWM Advisors LLC | 5 920 | 178,59 | 309 | 232,26 | ||||
| 2025-07-21 | 13F | Mirae Asset Global Investments Co., Ltd. | 1 283 | 0,00 | 67 | 17,86 | ||||
| 2025-09-04 | 13F/A | Advisor Group Holdings, Inc. | 79 051 | 18,21 | 4 127 | 39,85 | ||||
| 2025-07-31 | 13F | Cambridge Investment Research Advisors, Inc. | 35 033 | −5,88 | 2 | 0,00 | ||||
| 2025-08-14 | 13F | Old Mission Capital Llc | 6 633 | 346 | ||||||
| 2025-08-12 | 13F | FourThought Financial Partners, LLC | 22 464 | 0,02 | 1 173 | 18,26 | ||||
| 2025-08-13 | 13F | Fisher Asset Management, LLC | 1 830 206 | −3,77 | 95 555 | 13,85 | ||||
| 2025-05-07 | 13F | Prudent Investors Network | 0 | −100,00 | 0 | |||||
| 2025-08-14 | 13F | Mpwm Advisory Solutions, Llc | 230 | 15,00 | 12 | 50,00 | ||||
| 2025-08-05 | 13F | Wellington Shields Capital Management, LLC | 450 | 23 | ||||||
| 2025-07-18 | 13F | PFG Investments, LLC | 7 349 | −3,61 | 384 | 13,99 | ||||
| 2025-08-14 | 13F | Bank Of America Corp /de/ | 233 883 | −40,02 | 12 211 | −29,04 | ||||
| 2025-07-14 | 13F | Sowell Financial Services LLC | 17 175 | 0,00 | 897 | 18,36 | ||||
| 2025-08-05 | 13F | Wellington Shields & Co., LLC | 4 680 | 244 | ||||||
| 2025-08-08 | 13F | Tortoise Investment Management, LLC | 442 | 0,00 | 23 | 21,05 | ||||
| 2025-08-05 | 13F | Bank Of Montreal /can/ | 3 050 | 0,00 | 159 | 18,66 | ||||
| 2025-08-14 | 13F | Citadel Advisors Llc | 10 824 | −57,55 | 565 | −49,78 | ||||
| 2025-07-17 | 13F | Fifth Third Securities, Inc. | 4 910 | 0,00 | 256 | 18,52 | ||||
| 2025-08-07 | 13F | Efficient Advisors, LLC | 30 290 | 35,62 | 1 581 | 60,51 | ||||
| 2025-08-12 | 13F | CIBC Private Wealth Group, LLC | 279 | 0,00 | 15 | 40,00 | ||||
| 2025-08-13 | 13F | Lido Advisors, LLC | 11 133 | 12,51 | 581 | 33,26 | ||||
| 2025-07-29 | 13F | Private Trust Co Na | 141 | 0,00 | 7 | 16,67 | ||||
| 2025-07-28 | 13F | WJ Wealth Management, LLC | 8 500 | 0,00 | 444 | 18,13 | ||||
| 2025-07-16 | 13F | Perigon Wealth Management, LLC | 7 602 | −2,04 | 397 | 15,79 | ||||
| 2025-08-14 | 13F | Raymond James Financial Inc | 165 485 | 0,79 | 8 640 | 19,24 | ||||
| 2025-07-08 | 13F | Parallel Advisors, LLC | 43 715 | −5,37 | 2 282 | 11,97 | ||||
| 2025-07-18 | 13F | Founders Capital Management | 95 | 0,00 | 5 | 0,00 | ||||
| 2025-07-17 | 13F | Beacon Capital Management, LLC | 230 | 0,00 | 12 | 20,00 | ||||
| 2025-07-29 | 13F | Ballast, Inc. | 22 523 | 1 176 | ||||||
| 2025-08-14 | 13F | Benjamin Edwards Inc | 19 368 | 22,27 | 1 011 | 44,64 | ||||
| 2025-05-12 | 13F | Biltmore Family Office, LLC | 0 | −100,00 | 0 | −100,00 | ||||
| 2025-07-17 | 13F | Halbert Hargrove Global Advisors, Llc | 220 | 0,00 | 11 | 22,22 | ||||
| 2025-08-12 | 13F | Pathstone Holdings, LLC | 44 454 | 0,00 | 2 321 | 18,31 | ||||
| 2025-08-04 | 13F | Creative Financial Designs Inc /adv | 95 | 0,00 | 5 | 0,00 | ||||
| 2025-08-07 | 13F | Allworth Financial LP | 1 000 | 0,00 | 52 | 18,18 | ||||
| 2025-08-04 | 13F | Joseph P. Lucia & Associates, LLC | 22 523 | −1,94 | 1 176 | 15,99 | ||||
| 2025-08-07 | 13F | PFG Advisors | 93 473 | 21,64 | 4 880 | 43,91 | ||||
| 2025-08-11 | 13F | Atlantic Private Wealth, LLC | 2 000 | 0,00 | 104 | 18,18 | ||||
| 2025-08-14 | 13F | UBS Group AG | 736 821 | 1,29 | 38 469 | 19,84 | ||||
| 2025-08-15 | 13F | Morgan Stanley | 620 314 | 4,66 | 32 387 | 23,83 | ||||
| 2025-07-01 | 13F | Harbor Investment Advisory, Llc | 20 315 | −1,22 | 1 061 | 16,87 | ||||
| 2025-08-08 | 13F | Pnc Financial Services Group, Inc. | 2 200 | 0,00 | 115 | 17,53 | ||||
| 2025-08-12 | 13F | Jpmorgan Chase & Co | 33 901 | −0,81 | 1 770 | 17,31 | ||||
| 2025-07-14 | 13F | Golden State Equity Partners | 4 150 | 217 | ||||||
| 2025-08-01 | 13F | Envestnet Asset Management Inc | 26 133 | 43,68 | 1 364 | 70,07 | ||||
| 2025-07-25 | 13F | Hemington Wealth Management | 866 | 0,00 | 0 | |||||
| 2025-08-11 | 13F | Citigroup Inc | 1 850 | 0,00 | 97 | 18,52 | ||||
| 2025-07-31 | 13F | Nilsine Partners, LLC | 29 499 | 0,38 | 1 540 | 18,83 | ||||
| 2025-08-04 | 13F | Kovack Advisors, Inc. | 13 863 | 0,17 | 724 | 18,52 | ||||
| 2025-08-14 | 13F | Royal Bank Of Canada | 232 891 | −5,10 | 12 159 | 12,27 | ||||
| 2025-08-14 | 13F | Colony Group, LLC | 4 025 | 210 | ||||||
| 2025-08-14 | 13F | Mariner, LLC | 20 819 | 0,00 | 1 087 | 18,30 | ||||
| 2025-07-11 | 13F | Seacrest Wealth Management, Llc | 21 234 | 2,82 | 1 109 | 21,62 | ||||
| 2025-07-28 | 13F | Harbour Investments, Inc. | 2 596 | 0,04 | 136 | 18,42 | ||||
| 2025-08-06 | 13F | AE Wealth Management LLC | 1 677 | 15,02 | 88 | 35,94 | ||||
| 2025-07-23 | 13F | Tcfg Wealth Management, Llc | 6 986 | 0,00 | 365 | 18,18 | ||||
| 2025-08-12 | 13F | MAI Capital Management | 440 | −55,47 | 23 | −48,84 | ||||
| 2025-08-19 | 13F | Asset Dedication, LLC | 90 | 0,00 | 5 | 33,33 | ||||
| 2025-07-15 | 13F | Carr Financial Group Corp | 22 454 | 39,42 | 1 172 | 65,07 | ||||
| 2025-07-28 | 13F | Frazier Financial Advisors, LLC | 32 | 0,00 | 2 | 0,00 | ||||
| 2025-08-14 | 13F | Aqr Capital Management Llc | 9 035 | −3,99 | 472 | 13,49 | ||||
| 2025-08-13 | 13F/A | StoneX Group Inc. | 0 | −100,00 | 0 | |||||
| 2025-08-08 | 13F | Austin Wealth Management, LLC | 11 714 | −2,78 | 617 | 15,76 | ||||
| 2025-07-02 | 13F | Central Pacific Bank - Trust Division | 240 | 0,00 | 13 | 20,00 | ||||
| 2025-08-14 | 13F | KKM Financial LLC | 5 209 | 0,00 | 272 | 18,34 | ||||
| 2025-07-14 | 13F | Painted Porch Advisors LLC | 0 | −100,00 | 0 | −100,00 | ||||
| 2025-08-01 | 13F | Gwn Securities Inc. | 5 938 | −96,96 | 310 | −96,78 | ||||
| 2025-08-11 | 13F | GW&K Investment Management, LLC | 1 375 | 0,00 | 0 | |||||
| 2025-07-24 | 13F | Us Bancorp \de\ | 15 986 | 0,00 | 835 | 18,30 | ||||
| 2025-08-08 | 13F | Avantax Advisory Services, Inc. | 22 946 | −5,58 | 1 198 | 11,75 | ||||
| 2025-08-06 | 13F | Atlantic Union Bankshares Corp | 1 500 | 78 | ||||||
| 2025-07-17 | 13F | Sound Income Strategies, LLC | 30 | 0,00 | 2 | 0,00 | ||||
| 2025-08-13 | 13F | Jones Financial Companies Lllp | 25 513 | 17,14 | 1 327 | 37,80 | ||||
| 2025-08-19 | 13F | Newbridge Financial Services Group, Inc. | 1 491 | 78 | ||||||
| 2025-08-13 | 13F | Marshall Wace, Llp | 12 111 | −19,97 | 632 | −5,25 | ||||
| 2025-08-14 | 13F | Two Sigma Investments, Lp | 70 300 | 3 670 | ||||||
| 2025-07-22 | 13F | Bank Hapoalim Bm | 4 600 | 0,00 | 0 | |||||
| 2025-08-14 | 13F | CIBC World Markets Inc. | 13 710 | 1,22 | 716 | 19,77 | ||||
| 2025-07-07 | 13F | RDA Financial Network | 9 760 | 0,00 | 510 | 18,37 | ||||
| 2025-08-14 | 13F | Hirtle Callaghan & Co LLC | 8 600 | 0,00 | 449 | 18,47 | ||||
| 2025-07-16 | 13F | ORG Wealth Partners, LLC | 93 | 0,00 | 5 | 0,00 | ||||
| 2025-07-31 | 13F | Brighton Jones Llc | 7 084 | −0,91 | 370 | 17,14 | ||||
| 2025-05-09 | 13F | Atria Wealth Solutions, Inc. | 0 | −100,00 | 0 | |||||
| 2025-07-17 | 13F | Western Financial Corp/CA | 6 589 | −21,09 | 344 | −6,52 | ||||
| 2025-07-29 | 13F | Stratos Wealth Partners, LTD. | 5 709 | 44,31 | 298 | −44,09 | ||||
| 2025-07-09 | 13F | David J Yvars Group | 23 099 | −7,66 | 1 206 | 9,25 | ||||
| 2025-08-08 | 13F | Ironwood Investment Counsel, LLC | 9 721 | 0,00 | 508 | 18,46 | ||||
| 2025-08-14 | 13F | Ameriprise Financial Inc | 39 225 | 11,60 | 2 048 | 31,98 | ||||
| 2025-08-14 | 13F | Bnp Paribas Arbitrage, Sa | 0 | −100,00 | 0 | |||||
| 2025-08-14 | 13F | Mml Investors Services, Llc | 52 049 | 0,96 | 3 | 0,00 | ||||
| 2025-08-14 | 13F | Stifel Financial Corp | 92 478 | −0,75 | 4 829 | 17,44 |