Grundläggande statistik
| Institutionella ägare | 181 total, 181 long only, 0 short only, 0 long/short - change of 5,23% MRQ |
| Genomsnittlig portföljallokering | 0.2461 % - change of 11,87% MRQ |
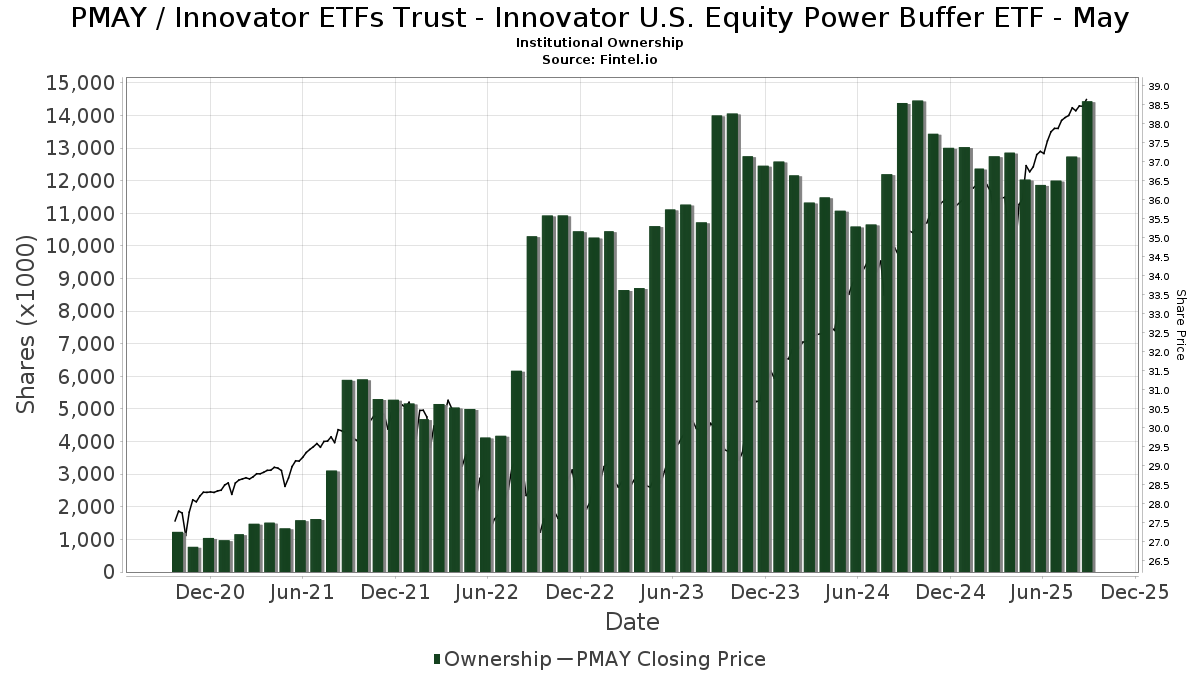
| Institutionella aktier (lång) | 14 434 666 (ex 13D/G) - change of 2,57MM shares 21,61% MRQ |
| Institutionellt värde (lång) | $ 455 641 USD ($1000) |
Institutionellt ägande och aktieägare
Innovator ETFs Trust - Innovator U.S. Equity Power Buffer ETF - May (US:PMAY) har 181 Institutionella ägare och aktieägare som har lämnat in 13D/G- eller 13F-formulär till Securities Exchange Commission (SEC). Dessa institut innehar totalt 14,434,666 aktier. Största aktieägare inkluderar Alliancebernstein L.p., Penserra Capital Management LLC, Innovator ETFs Trust - Innovator Laddered Fund of U.S. Equity Power Buffer ETFs, Raymond James Financial Inc, Advisor Group Holdings, Inc., Commonwealth Equity Services, Llc, Kovitz Investment Group Partners, LLC, Cetera Investment Advisers, LPL Financial LLC, and Southland Equity Partners LLC .
Innovator ETFs Trust - Innovator U.S. Equity Power Buffer ETF - May (BATS:PMAY) Institutionell ägarstruktur visar institutioners och fonders nuvarande positioner i företaget, samt de senaste förändringarna i positionernas storlek. Större aktieägare kan vara enskilda investerare, fonder, hedgefonder eller institutioner. Bilaga 13D visar att investeraren äger (eller ägde) mer än 5% av företaget och avser (eller avsåg) att aktivt eftersträva en förändring av affärsstrategin. Schedule 13G indikerar en passiv investering på över 5%.
The share price as of September 9, 2025 is 38,59 / share. Previously, on September 10, 2024, the share price was 34,53 / share. This represents an increase of 11,76% over that period.
Fondsentimentets poäng
Fondsentimentet poängen(fka Ägarackumulation-poäng) visar vilka aktier som är mest köpta av fonder. Det är resultatet av en sofistikerad kvantitativ flerfaktormodell som identifierar företag med de högsta nivåerna av institutionell ackumulering. Poängsättningsmodellen använder en kombination av den totala ökningen av redovisade ägare, förändringarna i portföljallokeringarna för dessa ägare och andra mått. Siffran sträcker sig från 0 till 100, där högre siffror indikerar en högre nivå av ackumulering i förhållande till sina konkurrenter, och 50 är genomsnittet.
Uppdateringsfrekvens: Dagligen
Se Ownership Explorer, som innehåller en lista över de högst rankade företagen.
Institutionell sälj/köp-kvot
Förutom att rapportera vanliga eget kapital- och skuldemissioner måste institutioner med mer än 100MM tillgångar under förvaltning också avslöja sina innehav av sälj- och köpoptioner. Eftersom säljoptioner i allmänhet indikerar ett negativt sentiment och köpoptioner indikerar ett positivt sentiment, kan vi få en uppfattning om det övergripande institutionella sentimentet genom att plotta förhållandet mellan säljoptioner och köpoptioner. Diagrammet till höger visar det historiska förhållandet mellan sälj- och köpoptioner för detta instrument.
Genom att använda sälj/köp-kvoten som en indikator på aktieägarnas sentiment undviker man en av de största bristerna med att använda det totala institutionella ägandet, nämligen att en betydande del av de förvaltade tillgångarna investeras passivt för att följa index. Passivt förvaltade fonder köper vanligtvis inte optioner, så indikatorn för sälj/köp-kvoten ger en bättre bild av stämningen i aktivt förvaltade fonder.
13F- och NPORT-arkiveringar
Detaljer om 13F-arkiveringar är gratis. Detaljer om NP-arkiveringar kräver ett premiummedlemskap. Gröna rader indikerar nya positioner. Röda rader indikerar stängda positioner. Klicka på länk symbolen för att se hela transaktionshistoriken.
Uppgradera
för att låsa upp premiumdata och exportera till Excel ![]() .
.
| Fil Datum | Källa | Investerare | Typ | Genomsnittligt pris (beräknat) |
Aktier | Δ Aktier (%) |
Rapporterat värde (1000 USD) |
Δ Värde (%) |
Portföljallokering (%) |
|
|---|---|---|---|---|---|---|---|---|---|---|
| 2025-07-17 | 13F | Clear Point Advisors Inc. | 33 740 | −0,56 | 1 275 | 4,94 | ||||
| 2025-07-22 | 13F | Siligmueller & Norvid Wealth Advisors LLC | 16 677 | 0,00 | 632 | 5,70 | ||||
| 2025-08-14 | 13F | Visionary Wealth Advisors | 42 502 | −1,36 | 1 606 | 4,15 | ||||
| 2025-07-22 | 13F | Merit Financial Group, LLC | 15 722 | 594 | ||||||
| 2025-08-06 | 13F | Penserra Capital Management LLC | 1 546 071 | 14,08 | 58 | 20,83 | ||||
| 2025-07-23 | 13F | Valmark Advisers, Inc. | 38 296 | 5,76 | 1 447 | 11,65 | ||||
| 2025-08-12 | 13F | Coldstream Capital Management Inc | 11 582 | 147,90 | 438 | 161,68 | ||||
| 2025-07-31 | 13F | Gill Capital Partners, Llc | 32 613 | −30,74 | 1 232 | −26,88 | ||||
| 2025-09-09 | 13F | NWF Advisory Services Inc. | 6 700 | 0,00 | 253 | 5,86 | ||||
| 2025-08-14 | 13F | Wells Fargo & Company/mn | 1 500 | −11,76 | 57 | −6,67 | ||||
| 2025-05-05 | 13F | PCA Investment Advisory Services Inc. | 0 | −100,00 | 0 | |||||
| 2025-08-11 | 13F | Blue Bell Private Wealth Management, Llc | 11 334 | 16,99 | 428 | 23,70 | ||||
| 2025-08-13 | 13F | BCJ Capital Management, LLC | 14 644 | 20,06 | 553 | 26,83 | ||||
| 2025-08-14 | 13F | CoreCap Advisors, LLC | 78 219 | 161,23 | 2 956 | 175,91 | ||||
| 2025-04-29 | 13F | Strategic Blueprint, LLC | 0 | −100,00 | 0 | |||||
| 2025-05-14 | 13F | Oarsman Capital, Inc. | 0 | −100,00 | 0 | |||||
| 2025-07-25 | 13F | NorthRock Partners, LLC | 1 742 | 0,00 | 66 | 4,84 | ||||
| 2025-07-11 | 13F | SILVER OAK SECURITIES, Inc | 6 193 | 234 | ||||||
| 2025-07-25 | 13F | Atria Wealth Solutions, Inc. | 8 776 | 14,38 | 332 | 20,80 | ||||
| 2025-07-29 | 13F | Private Trust Co Na | 3 438 | 0,00 | 130 | 4,88 | ||||
| 2025-08-11 | 13F | Nations Financial Group Inc, /ia/ /adv | 9 990 | 33,82 | 378 | 41,20 | ||||
| 2025-08-12 | 13F | Steward Partners Investment Advisory, Llc | 18 203 | 0,00 | 688 | 5,53 | ||||
| 2025-08-08 | 13F | Avantax Advisory Services, Inc. | 9 594 | 60,19 | 363 | 69,16 | ||||
| 2025-07-23 | 13F | RiverTree Advisors, LLC | 15 545 | 0,00 | 587 | 5,58 | ||||
| 2025-08-14 | 13F | Jane Street Group, Llc | 6 678 | −1,98 | 252 | 3,70 | ||||
| 2025-08-12 | 13F | Proequities, Inc. | 0 | 0 | ||||||
| 2025-08-12 | 13F | Jacobi Capital Management LLC | 15 671 | 0,00 | 592 | 5,53 | ||||
| 2025-08-14 | 13F | Royal Bank Of Canada | 0 | −100,00 | 0 | |||||
| 2025-07-29 | 13F | AssuredPartners Investment Advisors, LLC | 18 009 | −70,18 | 681 | −68,55 | ||||
| 2025-08-14 | 13F | Arete Wealth Advisors, LLC | 6 734 | 6,58 | 0 | |||||
| 2025-07-09 | 13F | Keystone Wealth Services, LLC | 7 546 | 18,91 | 285 | 25,55 | ||||
| 2025-08-06 | 13F | Valtinson Bruner Financial Planning LLC | 8 066 | −7,94 | 305 | −2,88 | ||||
| 2025-04-22 | 13F | Continuum Wealth Advisors, Llc | 0 | −100,00 | 0 | |||||
| 2025-07-24 | 13F | Weaver Capital Management LLC | 39 320 | −24,73 | 1 486 | −20,59 | ||||
| 2025-08-14 | 13F | Main Street Financial Solutions, LLC | 16 596 | 0,00 | 627 | 5,56 | ||||
| 2025-08-19 | 13F | National Asset Management, Inc. | 0 | −100,00 | 0 | |||||
| 2025-08-14 | 13F | Financial Network Wealth Advisors LLC | 2 371 | 0,00 | 90 | 5,95 | ||||
| 2025-07-29 | 13F | Stephens Inc /ar/ | 15 170 | 0,00 | 573 | 5,52 | ||||
| 2025-07-02 | 13F | McAlister, Sweet & Associates, Inc. | 125 237 | 4 732 | ||||||
| 2025-08-01 | 13F | Advisory Alpha, LLC | 37 147 | 0,55 | 1 404 | 6,13 | ||||
| 2025-04-25 | 13F | Crown Wealth Group, LLC | 0 | −100,00 | 0 | |||||
| 2025-08-14 | 13F | Susquehanna International Group, Llp | 49 548 | 15,15 | 1 872 | 21,56 | ||||
| 2025-07-21 | 13F | DHJJ Financial Advisors, Ltd. | 38 314 | 13,07 | 1 448 | 19,29 | ||||
| 2025-08-14 | 13F | Raymond James Financial Inc | 507 341 | 26,67 | 19 172 | 33,70 | ||||
| 2025-07-18 | 13F | Truist Financial Corp | 140 998 | 60,90 | 5 328 | 69,84 | ||||
| 2025-08-05 | 13F | Milestone Asset Management, Llc | 12 858 | 0,00 | 486 | 5,43 | ||||
| 2025-08-13 | 13F | SageView Advisory Group, LLC | 58 076 | 2 219 | ||||||
| 2025-07-11 | 13F | Cypress Financial Planning Llc | 7 273 | −1,49 | 275 | 3,79 | ||||
| 2025-08-12 | 13F | Leigh Baldwin & Co., Llc | 27 900 | 3,33 | 1 054 | 9,11 | ||||
| 2025-07-17 | 13F | Keystone Global Partners, LLC | 4 697 | 0,00 | 177 | 5,36 | ||||
| 2025-08-04 | 13F | JDM Financial Group LLC | 6 980 | 10,97 | 264 | 16,89 | ||||
| 2025-07-07 | 13F | Vishria Bird Financial Group, LLC | 30 411 | 0,00 | 1 149 | 5,61 | ||||
| 2025-07-31 | 13F | Orion Capital Management LLC | 12 099 | −0,83 | 457 | 4,82 | ||||
| 2025-08-14 | 13F | Aqr Capital Management Llc | 0 | −100,00 | 0 | |||||
| 2025-07-10 | 13F | Kmg Fiduciary Partners, Llc | 6 109 | 0,21 | 231 | 5,50 | ||||
| 2025-07-29 | 13F | Signature Estate & Investment Advisors Llc | 8 029 | −5,71 | 303 | −0,33 | ||||
| 2025-08-06 | 13F | Wedbush Securities Inc | 5 640 | 0 | ||||||
| 2025-06-24 | NP | Innovator ETFs Trust - Innovator Laddered Fund of U.S. Equity Power Buffer ETFs | 1 350 903 | 10,76 | 48 457 | 9,41 | ||||
| 2025-08-06 | 13F | Commonwealth Equity Services, Llc | 411 419 | 24,18 | 16 | 36,36 | ||||
| 2025-08-08 | 13F | Gts Securities Llc | 9 676 | 366 | ||||||
| 2025-08-14 | 13F | EP Wealth Advisors, Inc. | 54 120 | −1,44 | 2 045 | 4,07 | ||||
| 2025-08-13 | 13F | Townsquare Capital Llc | 0 | −100,00 | 0 | |||||
| 2025-07-17 | 13F | City Holding Co | 1 507 | 0,00 | 57 | 5,66 | ||||
| 2025-07-15 | 13F | Retirement Income Solutions, Inc | 7 838 | 0,00 | 296 | 5,71 | ||||
| 2025-08-05 | 13F | Integrity Financial Corp /WA | 6 735 | −14,94 | 255 | −10,25 | ||||
| 2025-07-10 | 13F | Wealth Enhancement Advisory Services, Llc | 170 580 | 239,11 | 6 456 | 258,67 | ||||
| 2025-07-25 | 13F | Yarger Wealth Strategies, Llc | 115 406 | 85,50 | 4 361 | 95,82 | ||||
| 2025-05-01 | 13F | Quest 10 Wealth Builders, Inc. | 29 723 | −1,00 | 1 070 | −0,83 | ||||
| 2025-07-28 | 13F | WealthPlan Investment Management, LLC | 9 950 | −3,36 | 376 | 1,90 | ||||
| 2025-05-15 | 13F | Camarda Financial Advisors, LLC | 0 | −100,00 | 0 | |||||
| 2025-08-12 | 13F | Bedel Financial Consulting, Inc. | 14 508 | 0,00 | 548 | 5,18 | ||||
| 2025-08-19 | 13F | Cape Investment Advisory, Inc. | 25 139 | 39,36 | 950 | 47,13 | ||||
| 2025-08-29 | 13F | Centaurus Financial, Inc. | 5 549 | 0 | ||||||
| 2025-07-10 | 13F | Focus Financial Network, Inc. | 18 978 | −11,53 | 717 | −6,52 | ||||
| 2025-08-15 | 13F | Morgan Stanley | 465 | 167,24 | 18 | 183,33 | ||||
| 2025-07-31 | 13F | Pinnacle Wealth Management Group, Inc. | 102 713 | 13,60 | 3 881 | 19,93 | ||||
| 2025-08-14 | 13F | GWM Advisors LLC | 15 123 | 52,22 | 571 | 60,85 | ||||
| 2025-08-04 | 13F | Assetmark, Inc | 59 | −35,87 | 2 | −33,33 | ||||
| 2025-07-30 | 13F | Drive Wealth Management, Llc | 8 643 | 12,64 | 327 | 18,98 | ||||
| 2025-08-01 | 13F | FSA Advisors, Inc. | 11 546 | 0,22 | 436 | 5,83 | ||||
| 2025-08-08 | 13F | Creative Planning | 6 822 | 0,00 | 258 | 5,33 | ||||
| 2025-08-01 | 13F | Envestnet Asset Management Inc | 152 722 | 128,87 | 5 771 | 141,67 | ||||
| 2025-05-15 | 13F | Two Sigma Securities, Llc | 0 | −100,00 | 0 | −100,00 | ||||
| 2025-07-28 | 13F | Cornerstone Wealth Group, LLC | 15 687 | 26,18 | 593 | 33,03 | ||||
| 2025-08-11 | 13F | Outlook Wealth Advisors, LLC | 15 144 | −14,33 | 572 | −9,49 | ||||
| 2025-05-07 | 13F | Keystone Financial Group, Inc. | 0 | −100,00 | 0 | |||||
| 2025-07-22 | 13F | Diligent Investors, LLC | 21 008 | 61,50 | 794 | 70,54 | ||||
| 2025-08-08 | 13F | Foundations Investment Advisors, LLC | 6 575 | 6,95 | 248 | 12,73 | ||||
| 2025-07-31 | 13F | Cambridge Investment Research Advisors, Inc. | 77 621 | 17,56 | 3 | 0,00 | ||||
| 2025-08-14 | 13F | Old Mission Capital Llc | 39 725 | −48,97 | 1 501 | −46,12 | ||||
| 2025-07-10 | 13F | Secure Asset Management, LLC | 15 180 | 0,00 | 574 | 5,52 | ||||
| 2025-07-29 | 13F | Stratos Wealth Advisors, LLC | 37 853 | 0,00 | 1 430 | 5,54 | ||||
| 2025-08-07 | 13F | Lakeridge Wealth Management LLC | 23 992 | 12,63 | 907 | 18,90 | ||||
| 2025-07-09 | 13F | Lineweaver Wealth Advisors, LLC | 49 255 | 0,00 | 1 861 | 5,56 | ||||
| 2025-08-14 | 13F | First Commonwealth Financial Corp /pa/ | 36 967 | −2,92 | 1 397 | 2,42 | ||||
| 2025-08-08 | 13F | Capital Investment Advisory Services, LLC | 1 000 | 0,00 | 38 | 5,71 | ||||
| 2025-08-14 | 13F | UBS Group AG | 0 | −100,00 | 0 | |||||
| 2025-09-04 | 13F/A | Advisor Group Holdings, Inc. | 495 679 | 20,67 | 18 727 | 27,35 | ||||
| 2025-07-17 | 13F | Hengehold Capital Management Llc | 8 700 | 0,00 | 329 | 5,47 | ||||
| 2025-07-09 | 13F | Fragasso Group Inc. | 25 190 | 0,00 | 952 | 5,55 | ||||
| 2025-08-14 | 13F | Beck Capital Management, Llc | 23 846 | −0,66 | 901 | 4,89 | ||||
| 2025-07-25 | 13F | Hazlett, Burt & Watson, Inc. | 500 | −47,37 | 0 | |||||
| 2025-08-13 | 13F | Cresset Asset Management, LLC | 10 741 | 406 | ||||||
| 2025-07-21 | 13F | Seros Financial, LLC | 9 082 | 0,00 | 343 | 5,54 | ||||
| 2025-07-30 | 13F | Brookstone Capital Management | 163 667 | −2,74 | 6 185 | 2,66 | ||||
| 2025-07-21 | 13F | Patriot Financial Group Insurance Agency, LLC | 36 332 | 8,74 | 1 373 | 14,72 | ||||
| 2025-07-28 | 13F | Harbour Investments, Inc. | 48 632 | 0,95 | 1 838 | 6,55 | ||||
| 2025-07-15 | 13F | BigSur Wealth Management LLC | 1 500 | 0,00 | 57 | 5,66 | ||||
| 2025-08-12 | 13F | LPL Financial LLC | 255 323 | 5,30 | 9 648 | 11,15 | ||||
| 2025-08-15 | 13F | Kestra Advisory Services, LLC | 134 808 | 44,51 | 5 094 | 52,56 | ||||
| 2025-08-13 | 13F | Continuum Advisory, LLC | 0 | −100,00 | 0 | |||||
| 2025-07-30 | 13F | Evermay Wealth Management Llc | 31 105 | 29,21 | 1 175 | 36,47 | ||||
| 2025-07-07 | 13F | Schulz Wealth, LTD. | 30 010 | −4,00 | 1 134 | 1,34 | ||||
| 2025-07-22 | 13F | Belpointe Asset Management LLC | 17 996 | 680 | ||||||
| 2025-07-23 | 13F | Allegiance Financial Group Advisory Services LLC | 26 681 | 0,00 | 1 008 | 5,55 | ||||
| 2025-08-06 | 13F | AE Wealth Management LLC | 86 603 | −44,98 | 3 273 | −41,92 | ||||
| 2025-07-30 | 13F | Retirement Planning Group | 11 267 | 0,00 | 426 | 5,46 | ||||
| 2025-08-07 | 13F | Resources Investment Advisors, LLC. | 77 548 | 100,68 | 2 930 | 111,86 | ||||
| 2025-08-12 | 13F | SRS Capital Advisors, Inc. | 7 682 | −49,20 | 290 | −46,40 | ||||
| 2025-04-10 | 13F | Whipplewood Advisors, LLC | 0 | −100,00 | 0 | |||||
| 2025-08-08 | 13F | Wealth Alliance | 69 283 | 21,51 | 2 618 | 28,27 | ||||
| 2025-08-07 | 13F | Allworth Financial LP | 9 009 | 0,00 | 340 | 7,26 | ||||
| 2025-07-25 | 13F | We Are One Seven, LLC | 15 196 | 574 | ||||||
| 2025-07-15 | 13F | McAdam, LLC | 11 026 | 29,79 | 417 | 36,84 | ||||
| 2025-08-14 | 13F | Colony Group, LLC | 80 617 | −5,62 | 3 046 | −0,36 | ||||
| 2025-08-01 | 13F | Corrado Advisors, Llc | 68 287 | 25,42 | 2 580 | 32,38 | ||||
| 2025-04-15 | 13F | Noble Wealth Management PBC | 125 | 0,00 | 4 | 0,00 | ||||
| 2025-08-04 | 13F | Creative Financial Designs Inc /adv | 5 250 | −0,40 | 198 | 5,32 | ||||
| 2025-08-05 | 13F | WorthPointe, LLC | 12 609 | 17,56 | 476 | 24,28 | ||||
| 2025-04-22 | 13F | Castleview Partners, Llc | 0 | −100,00 | 0 | |||||
| 2025-07-14 | 13F | AdvisorNet Financial, Inc | 6 344 | 0,00 | 240 | 5,29 | ||||
| 2025-08-11 | 13F | Bellwether Advisors, LLC | 19 217 | 0,00 | 726 | 5,68 | ||||
| 2025-08-12 | 13F | MAI Capital Management | 58 967 | 15,57 | 2 228 | 22,02 | ||||
| 2025-07-23 | 13F | Heck Capital Advisors, LLC | 197 799 | 0,30 | 7 474 | 5,86 | ||||
| 2025-07-29 | 13F | Chicago Partners Investment Group LLC | 21 260 | 0,00 | 810 | 5,75 | ||||
| 2025-08-05 | 13F | Sigma Planning Corp | 5 995 | −5,50 | 227 | −0,44 | ||||
| 2025-08-14 | 13F | Kovitz Investment Group Partners, LLC | 303 092 | 30,89 | 11 453 | 38,17 | ||||
| 2025-07-03 | 13F | Fiduciary Financial Group, Llc | 8 976 | −12,53 | 339 | −3,98 | ||||
| 2025-07-16 | 13F | Signaturefd, Llc | 12 461 | 0,00 | 471 | 5,38 | ||||
| 2025-07-17 | 13F | Wagner Wealth Management, Llc | 1 800 | 0,00 | 68 | 6,25 | ||||
| 2025-05-14 | 13F | Frisch Financial Group, Inc. | 0 | −100,00 | 0 | |||||
| 2025-08-11 | 13F | WPWealth LLP | 153 864 | 5 814 | ||||||
| 2025-08-14 | 13F | Citadel Advisors Llc | 14 901 | −30,60 | 563 | −26,69 | ||||
| 2025-07-23 | 13F | Castle Rock Wealth Management, LLC | 85 650 | −2,97 | 3 259 | 2,78 | ||||
| 2025-07-28 | 13F | Mutual Advisors, LLC | 7 542 | 288 | ||||||
| 2025-07-15 | 13F | Palumbo Wealth Management LLC | 18 354 | 0,00 | 694 | 5,48 | ||||
| 2025-07-10 | 13F | Atticus Wealth Management, Llc | 108 604 | 4,29 | 4 104 | 10,09 | ||||
| 2025-07-15 | 13F | Optima Capital Llc | 10 723 | 405 | ||||||
| 2025-08-14 | 13F | Mml Investors Services, Llc | 70 161 | 208,40 | 3 | |||||
| 2025-05-09 | 13F | Mitchell Capital Management Co | 0 | −100,00 | 0 | |||||
| 2025-07-31 | 13F | Brinker Capital Investments, LLC | 0 | −100,00 | 0 | −100,00 | ||||
| 2025-07-14 | 13F | Chris Bulman Inc | 68 611 | 33,51 | 2 593 | 40,95 | ||||
| 2025-07-30 | 13F | Red Crane Wealth Management, Llc | 9 528 | −1,64 | 360 | 4,05 | ||||
| 2025-07-31 | 13F | Cardinal Point Capital Management, ULC | 5 600 | 0,00 | 212 | 5,50 | ||||
| 2025-07-17 | 13F | Janney Montgomery Scott LLC | 82 988 | 8,18 | 3 | 50,00 | ||||
| 2025-08-11 | 13F | Anfield Capital Management, LLC | 350 | 13 | ||||||
| 2025-07-25 | 13F | Sequoia Financial Advisors, LLC | 12 250 | 0,00 | 463 | 5,48 | ||||
| 2025-08-12 | 13F | Jpmorgan Chase & Co | 13 112 | 28,90 | 495 | 35,99 | ||||
| 2025-07-24 | 13F | IFP Advisors, Inc | 74 343 | −4,03 | 2 809 | 1,30 | ||||
| 2025-08-13 | 13F | Beacon Pointe Advisors, LLC | 151 720 | 6,72 | 5 733 | 12,65 | ||||
| 2025-08-13 | 13F | Capital Analysts, Inc. | 6 287 | 0,00 | 0 | |||||
| 2025-08-14 | 13F | Comerica Bank | 2 000 | 0,00 | 76 | 5,63 | ||||
| 2025-07-10 | 13F | ARS Wealth Advisors Group, LLC | 94 641 | 88,41 | 3 576 | 98,89 | ||||
| 2025-08-14 | 13F | Alliancebernstein L.p. | 3 546 015 | 28,17 | 133 998 | 35,29 | ||||
| 2025-07-14 | 13F | Kfg Wealth Management, Llc | 143 534 | 4,69 | 5 424 | 10,49 | ||||
| 2025-08-19 | 13F | Advisory Services Network, LLC | 9 175 | −3,36 | 349 | 2,95 | ||||
| 2025-08-07 | 13F | Runnymede Capital Advisors, Inc. | 0 | −100,00 | 0 | |||||
| 2025-05-12 | 13F | Fmr Llc | 0 | −100,00 | 0 | |||||
| 2025-08-14 | 13F/A | Barclays Plc | 5 266 | 1 495,76 | 0 | |||||
| 2025-08-11 | 13F | Rothschild Investment Llc | 200 | 0,00 | 8 | 0,00 | ||||
| 2025-08-11 | 13F | HighTower Advisors, LLC | 116 746 | 8,93 | 4 412 | 14,96 | ||||
| 2025-08-12 | 13F | Wood Tarver Financial Group, LLC | 64 602 | 1,69 | 2 | −99,91 | ||||
| 2025-07-24 | 13F | Bernard Wealth Management Corp. | 4 221 | 246,84 | 160 | 269,77 | ||||
| 2025-08-14 | 13F | Mariner, LLC | 26 807 | 0,00 | 1 013 | 5,53 | ||||
| 2025-07-15 | 13F | BCS Wealth Management | 17 001 | 3,44 | 1 | |||||
| 2025-08-08 | 13F | Kingsview Wealth Management, LLC | 16 417 | −3,72 | 620 | 1,64 | ||||
| 2025-08-07 | 13F | Tfo-tdc, Llc | 0 | −100,00 | 0 | |||||
| 2025-04-10 | 13F | Sugar Maple Asset Management, LLC | 0 | −100,00 | 0 | |||||
| 2025-07-14 | 13F | Southland Equity Partners LLC | 231 771 | 42,97 | 8 758 | 50,92 | ||||
| 2025-08-08 | 13F | Cetera Investment Advisers | 258 367 | 10,80 | 9 763 | 16,96 | ||||
| 2025-08-13 | 13F | Cerity Partners LLC | 18 500 | 20,92 | 699 | 27,79 | ||||
| 2025-07-21 | 13F | Catalina Capital Group, LLC | 14 361 | 543 | ||||||
| 2025-07-29 | 13F | BKD Wealth Advisors, LLC | 35 201 | −5,99 | 1 330 | −0,75 | ||||
| 2025-08-04 | 13F | Spire Wealth Management | 25 105 | 124,85 | 949 | 137,59 | ||||
| 2025-07-24 | 13F | Blair William & Co/il | 49 594 | 459,37 | 1 874 | 491,17 | ||||
| 2025-08-08 | 13F | Larson Financial Group LLC | 0 | −100,00 | 0 | |||||
| 2025-07-14 | 13F | U.S. Capital Wealth Advisors, LLC | 13 706 | 0,73 | 518 | 6,16 | ||||
| 2025-08-12 | 13F | Change Path, LLC | 59 011 | 107,73 | 2 230 | 119,17 | ||||
| 2025-08-12 | 13F | Weaver Consulting Group | 31 480 | 16,27 | 1 190 | 22,70 | ||||
| 2025-07-24 | 13F | Riverchase Wealth Management, Llc | 9 619 | 363 | ||||||
| 2025-07-31 | 13F | Buckingham Strategic Partners | 30 104 | 1 138 | ||||||
| 2025-08-01 | 13F | Stuart Chaussee & Associates, Inc. | 22 000 | −74,60 | 831 | −73,20 | ||||
| 2025-07-17 | 13F | Smith Anglin Financial, LLC | 15 066 | 0,00 | 569 | 5,57 | ||||
| 2025-07-21 | 13F | Ameritas Advisory Services, LLC | 720 | 27 | ||||||
| 2025-08-05 | 13F | BCGM Wealth Management, LLC | 34 774 | 0,00 | 1 314 | 5,63 | ||||
| 2025-08-13 | 13F | Wealthquest Corp | 36 432 | −0,42 | 1 377 | 5,12 | ||||
| 2025-08-14 | 13F | Benjamin Edwards Inc | 23 699 | −3,25 | 896 | 2,17 | ||||
| 2025-08-15 | 13F | Captrust Financial Advisors | 55 038 | 10,88 | 2 080 | 16,99 | ||||
| 2025-07-24 | 13F | Stonebridge Financial Group, LLC | 0 | −100,00 | 0 | |||||
| 2025-07-30 | 13F | Phoenix Holdings Ltd. | 65 175 | 2 462 | ||||||
| 2025-08-13 | 13F | Luminist Capital LLC | 7 437 | 281 | ||||||
| 2025-08-14 | 13F | Hrt Financial Lp | 8 917 | 0 | ||||||
| 2025-08-11 | 13F | Principal Securities, Inc. | 3 125 | −17,00 | 118 | −12,59 | ||||
| 2025-07-28 | 13F | Axxcess Wealth Management, Llc | 5 941 | 0,00 | 224 | 5,66 | ||||
| 2025-07-11 | 13F | Farther Finance Advisors, LLC | 70 | −86,27 | 3 | −88,89 | ||||
| 2025-07-14 | 13F | CRA Financial Services, LLC | 5 825 | −4,90 | 220 | 0,46 | ||||
| 2025-07-24 | 13F | Vantage Point Financial LLC | 14 180 | 0,00 | 536 | 5,52 |