Grundläggande statistik
| Institutionella ägare | 159 total, 159 long only, 0 short only, 0 long/short - change of 1,91% MRQ |
| Genomsnittlig portföljallokering | 0.2750 % - change of 2,78% MRQ |
| Institutionella aktier (lång) | 15 924 910 (ex 13D/G) - change of 3,38MM shares 26,98% MRQ |
| Institutionellt värde (lång) | $ 492 553 USD ($1000) |
Institutionellt ägande och aktieägare
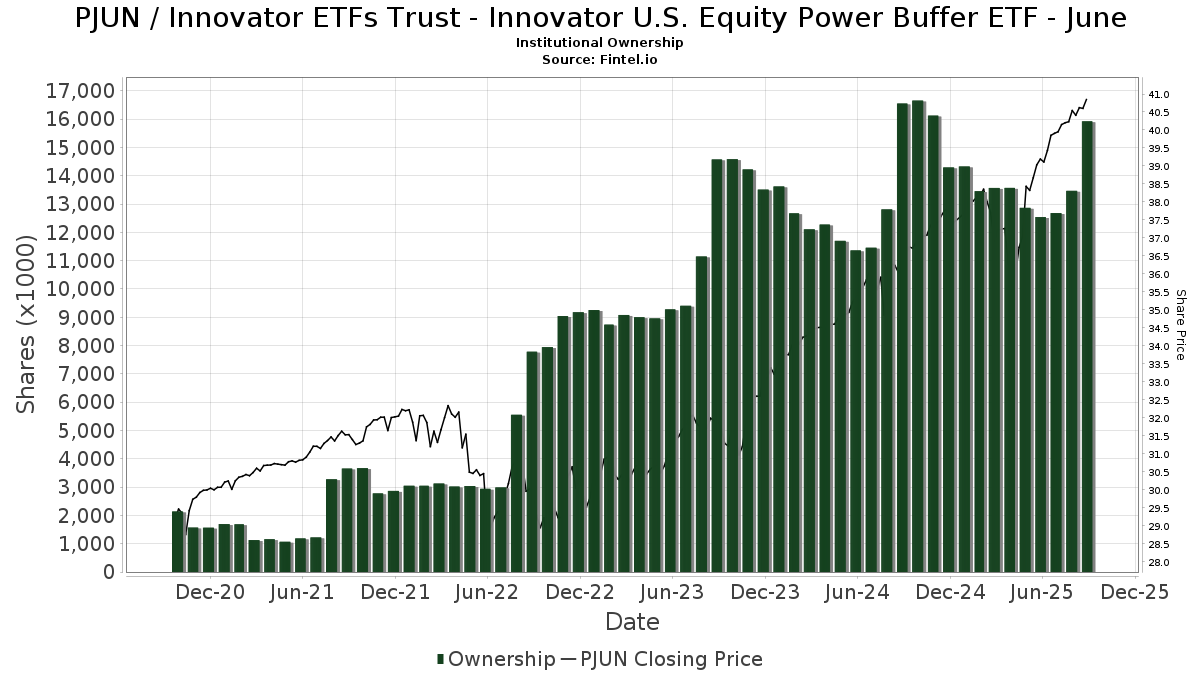
Innovator ETFs Trust - Innovator U.S. Equity Power Buffer ETF - June (US:PJUN) har 159 Institutionella ägare och aktieägare som har lämnat in 13D/G- eller 13F-formulär till Securities Exchange Commission (SEC). Dessa institut innehar totalt 15,924,910 aktier. Största aktieägare inkluderar Alliancebernstein L.p., Commonwealth Equity Services, Llc, Penserra Capital Management LLC, Innovator ETFs Trust - Innovator Laddered Fund of U.S. Equity Power Buffer ETFs, Berkshire Money Management, Inc., Advisor Group Holdings, Inc., HighTower Advisors, LLC, Kovitz Investment Group Partners, LLC, Wealth Enhancement Advisory Services, Llc, and Raymond James Financial Inc .
Innovator ETFs Trust - Innovator U.S. Equity Power Buffer ETF - June (BATS:PJUN) Institutionell ägarstruktur visar institutioners och fonders nuvarande positioner i företaget, samt de senaste förändringarna i positionernas storlek. Större aktieägare kan vara enskilda investerare, fonder, hedgefonder eller institutioner. Bilaga 13D visar att investeraren äger (eller ägde) mer än 5% av företaget och avser (eller avsåg) att aktivt eftersträva en förändring av affärsstrategin. Schedule 13G indikerar en passiv investering på över 5%.
The share price as of September 10, 2025 is 40,85 / share. Previously, on September 11, 2024, the share price was 36,18 / share. This represents an increase of 12,90% over that period.
Fondsentimentets poäng
Fondsentimentet poängen(fka Ägarackumulation-poäng) visar vilka aktier som är mest köpta av fonder. Det är resultatet av en sofistikerad kvantitativ flerfaktormodell som identifierar företag med de högsta nivåerna av institutionell ackumulering. Poängsättningsmodellen använder en kombination av den totala ökningen av redovisade ägare, förändringarna i portföljallokeringarna för dessa ägare och andra mått. Siffran sträcker sig från 0 till 100, där högre siffror indikerar en högre nivå av ackumulering i förhållande till sina konkurrenter, och 50 är genomsnittet.
Uppdateringsfrekvens: Dagligen
Se Ownership Explorer, som innehåller en lista över de högst rankade företagen.
Institutionell sälj/köp-kvot
Förutom att rapportera vanliga eget kapital- och skuldemissioner måste institutioner med mer än 100MM tillgångar under förvaltning också avslöja sina innehav av sälj- och köpoptioner. Eftersom säljoptioner i allmänhet indikerar ett negativt sentiment och köpoptioner indikerar ett positivt sentiment, kan vi få en uppfattning om det övergripande institutionella sentimentet genom att plotta förhållandet mellan säljoptioner och köpoptioner. Diagrammet till höger visar det historiska förhållandet mellan sälj- och köpoptioner för detta instrument.
Genom att använda sälj/köp-kvoten som en indikator på aktieägarnas sentiment undviker man en av de största bristerna med att använda det totala institutionella ägandet, nämligen att en betydande del av de förvaltade tillgångarna investeras passivt för att följa index. Passivt förvaltade fonder köper vanligtvis inte optioner, så indikatorn för sälj/köp-kvoten ger en bättre bild av stämningen i aktivt förvaltade fonder.
13F- och NPORT-arkiveringar
Detaljer om 13F-arkiveringar är gratis. Detaljer om NP-arkiveringar kräver ett premiummedlemskap. Gröna rader indikerar nya positioner. Röda rader indikerar stängda positioner. Klicka på länk symbolen för att se hela transaktionshistoriken.
Uppgradera
för att låsa upp premiumdata och exportera till Excel ![]() .
.
| Fil Datum | Källa | Investerare | Typ | Genomsnittligt pris (beräknat) |
Aktier | Δ Aktier (%) |
Rapporterat värde (1000 USD) |
Δ Värde (%) |
Portföljallokering (%) |
|
|---|---|---|---|---|---|---|---|---|---|---|
| 2025-08-13 | 13F | Cresset Asset Management, LLC | 54 746 | 46,96 | 2 177 | 57,91 | ||||
| 2025-07-25 | 13F | NorthRock Partners, LLC | 1 629 | 0,00 | 65 | 6,67 | ||||
| 2025-08-04 | 13F | Spire Wealth Management | 19 609 | 9,41 | 780 | 17,50 | ||||
| 2025-08-14 | 13F | Beck Capital Management, Llc | 12 882 | 0,01 | 512 | 7,56 | ||||
| 2025-07-25 | 13F | Atria Wealth Solutions, Inc. | 9 665 | −28,88 | 384 | −23,51 | ||||
| 2025-07-22 | 13F | Merit Financial Group, LLC | 10 720 | 426 | ||||||
| 2025-07-15 | 13F | McAdam, LLC | 201 951 | −1,20 | 8 030 | 6,15 | ||||
| 2025-07-23 | 13F | Valmark Advisers, Inc. | 16 399 | 24,08 | 652 | 33,33 | ||||
| 2025-08-11 | 13F | Atlantic Private Wealth, LLC | 0 | −100,00 | 0 | |||||
| 2025-08-12 | 13F | LPL Financial LLC | 196 618 | 10,32 | 7 818 | 18,51 | ||||
| 2025-04-08 | 13F | Lantz Financial LLC | 0 | −100,00 | 0 | |||||
| 2025-08-08 | 13F | Wealth Alliance | 51 065 | 1,90 | 2 030 | 9,49 | ||||
| 2025-05-06 | 13F | Assetmark, Inc | 0 | −100,00 | 0 | |||||
| 2025-08-04 | 13F | Integrity Alliance, Llc. | 0 | −100,00 | 0 | |||||
| 2025-08-14 | 13F | Wells Fargo & Company/mn | 879 | 0,00 | 35 | 6,25 | ||||
| 2025-08-15 | 13F | Kestra Advisory Services, LLC | 171 760 | 36,41 | 6 829 | 46,55 | ||||
| 2025-08-14 | 13F | Ambassador Advisors, LLC | 16 335 | 11,62 | 649 | 19,96 | ||||
| 2025-08-01 | 13F | FSA Advisors, Inc. | 12 067 | 8,29 | 480 | 17,11 | ||||
| 2025-08-01 | 13F | Corrado Advisors, Llc | 41 353 | 1 644 | ||||||
| 2025-08-06 | 13F | New Millennium Group LLC | 0 | −100,00 | 0 | |||||
| 2025-08-11 | 13F | Blue Bell Private Wealth Management, Llc | 11 603 | 1,75 | 461 | 9,24 | ||||
| 2025-07-25 | 13F | We Are One Seven, LLC | 15 276 | 607 | ||||||
| 2025-08-11 | 13F | Annis Gardner Whiting Capital Advisors, LLC | 20 875 | 830 | ||||||
| 2025-07-17 | 13F | Clear Point Advisors Inc. | 89 850 | −3,30 | 3 572 | 3,90 | ||||
| 2025-08-14 | 13F | Visionary Wealth Advisors | 6 242 | −0,14 | 248 | 7,36 | ||||
| 2025-07-09 | 13F | Fragasso Group Inc. | 18 268 | −4,41 | 726 | 2,69 | ||||
| 2025-08-12 | 13F | SRS Capital Advisors, Inc. | 7 962 | −46,66 | 317 | −42,75 | ||||
| 2025-07-30 | 13F | Brookstone Capital Management | 203 841 | −45,68 | 8 105 | −41,64 | ||||
| 2025-08-06 | 13F | Rps Advisory Solutions Llc | 49 591 | 139,32 | 1 972 | 157,31 | ||||
| 2025-08-14 | 13F | CoreCap Advisors, LLC | 202 489 | 105,68 | 8 051 | 120,97 | ||||
| 2025-07-30 | 13F | Retirement Planning Group | 7 620 | 0,00 | 303 | 7,09 | ||||
| 2025-08-07 | 13F | Resources Investment Advisors, LLC. | 82 206 | 74,56 | 3 269 | 87,60 | ||||
| 2025-08-14 | 13F | Colony Group, LLC | 69 914 | 1,85 | 2 780 | 9,41 | ||||
| 2025-07-21 | 13F | Ameriflex Group, Inc. | 133 | 0,00 | 5 | 25,00 | ||||
| 2025-07-22 | 13F | Berkshire Money Management, Inc. | 623 576 | 2 852,12 | 24 793 | 3 074,52 | ||||
| 2025-07-25 | 13F | Cwm, Llc | 1 950 | 22,41 | 0 | |||||
| 2025-05-15 | 13F | Two Sigma Securities, Llc | 0 | −100,00 | 0 | −100,00 | ||||
| 2025-08-11 | 13F | Bellwether Advisors, LLC | 127 427 | 17,90 | 5 066 | 26,68 | ||||
| 2025-08-04 | 13F | Atria Investments Llc | 24 297 | 966 | ||||||
| 2025-08-12 | 13F | MAI Capital Management | 55 251 | 127,74 | 2 197 | 144,82 | ||||
| 2025-08-13 | 13F | Continuum Advisory, LLC | 0 | −100,00 | 0 | |||||
| 2025-07-10 | 13F | Atticus Wealth Management, Llc | 15 838 | 77,78 | 630 | 91,19 | ||||
| 2025-08-12 | 13F | Jacobi Capital Management LLC | 10 850 | 0,00 | 431 | 7,48 | ||||
| 2025-08-05 | 13F | Sigma Planning Corp | 5 677 | 226 | ||||||
| 2025-08-11 | 13F | Nations Financial Group Inc, /ia/ /adv | 37 875 | 1,55 | 1 506 | 9,06 | ||||
| 2025-08-14 | 13F | Bank Of America Corp /de/ | 568 | 23 | ||||||
| 2025-08-08 | 13F | Avantax Advisory Services, Inc. | 21 114 | 89,07 | 839 | 103,15 | ||||
| 2025-07-17 | 13F | Wagner Wealth Management, Llc | 1 990 | 0,00 | 79 | 8,22 | ||||
| 2025-07-29 | 13F | Chicago Partners Investment Group LLC | 32 845 | −7,62 | 1 319 | 0,15 | ||||
| 2025-08-14 | 13F | Financial Network Wealth Advisors LLC | 3 055 | 9,03 | 121 | 17,48 | ||||
| 2025-08-08 | 13F | Thoroughbred Financial Services, Llc | 26 406 | −7,03 | 1 | 0,00 | ||||
| 2025-08-14 | 13F | Mml Investors Services, Llc | 120 549 | 179,70 | 5 | 300,00 | ||||
| 2025-07-28 | 13F | Elmwood Wealth Management, Inc. | 6 950 | −12,58 | 276 | −6,12 | ||||
| 2025-08-13 | 13F | Barclays Plc | 0 | −100,00 | 0 | |||||
| 2025-07-28 | 13F | Cypress Wealth Services, LLC | 9 684 | −15,59 | 385 | −9,20 | ||||
| 2025-08-01 | 13F | Advisory Alpha, LLC | 149 897 | −2,18 | 5 960 | 5,08 | ||||
| 2025-07-17 | 13F | Fort Washington Investment Advisors Inc /oh/ | 6 950 | −21,02 | 276 | −15,08 | ||||
| 2025-08-14 | 13F | Jane Street Group, Llc | 33 247 | 1 322 | ||||||
| 2025-07-24 | 13F | Weaver Capital Management LLC | 138 697 | 0,40 | 5 515 | 7,86 | ||||
| 2025-05-08 | 13F | Arkadios Wealth Advisors | 0 | −100,00 | 0 | |||||
| 2025-08-05 | 13F | Tsfg, Llc | 0 | −100,00 | 0 | |||||
| 2025-04-01 | 13F/A | Family Wealth Group, LLC | 0 | −100,00 | 0 | |||||
| 2025-07-22 | 13F | Global Strategic Investment Solutions, LLC | 14 932 | −0,08 | 594 | 7,23 | ||||
| 2025-05-06 | 13F | Retirement Income Solutions, Inc | 0 | −100,00 | 0 | |||||
| 2025-07-28 | 13F | Harbour Investments, Inc. | 24 896 | 2,73 | 990 | 10,38 | ||||
| 2025-07-09 | 13F | Fiduciary Alliance LLC | 5 674 | 226 | ||||||
| 2025-05-09 | 13F | Mitchell Capital Management Co | 0 | −100,00 | 0 | −100,00 | ||||
| 2025-08-12 | 13F | Proequities, Inc. | 0 | 0 | ||||||
| 2025-07-23 | 13F | Castle Rock Wealth Management, LLC | 45 035 | 0,69 | 1 804 | 9,00 | ||||
| 2025-07-16 | 13F | Dakota Wealth Management | 12 817 | 0,00 | 510 | 7,38 | ||||
| 2025-08-11 | 13F | WPWealth LLP | 30 176 | −72,38 | 1 200 | −70,34 | ||||
| 2025-08-01 | 13F | Bessemer Group Inc | 0 | −100,00 | 0 | |||||
| 2025-08-06 | 13F | Penserra Capital Management LLC | 1 493 506 | 15,39 | 59 | 25,53 | ||||
| 2025-08-14 | 13F | Kovitz Investment Group Partners, LLC | 416 018 | 34,28 | 16 541 | 44,25 | ||||
| 2025-08-05 | 13F | Bank Of Montreal /can/ | 16 587 | 0,00 | 659 | 7,50 | ||||
| 2025-04-10 | 13F | Sugar Maple Asset Management, LLC | 0 | −100,00 | 0 | |||||
| 2025-07-25 | 13F | Sequoia Financial Advisors, LLC | 8 974 | 0,00 | 357 | 7,23 | ||||
| 2025-08-06 | 13F | Commonwealth Equity Services, Llc | 1 670 634 | 274,26 | 66 | 312,50 | ||||
| 2025-08-13 | 13F | Beacon Pointe Advisors, LLC | 138 703 | 58,90 | 5 515 | 70,71 | ||||
| 2025-08-14 | 13F | First Commonwealth Financial Corp /pa/ | 17 908 | 8,70 | 712 | 16,91 | ||||
| 2025-08-12 | 13F | Weaver Consulting Group | 107 594 | 3,55 | 4 278 | 11,24 | ||||
| 2025-06-24 | NP | Innovator ETFs Trust - Innovator Laddered Fund of U.S. Equity Power Buffer ETFs | 1 304 988 | 12,03 | 47 932 | 8,17 | ||||
| 2025-07-14 | 13F | Chris Bulman Inc | 155 187 | −45,96 | 6 170 | −41,94 | ||||
| 2025-08-14 | 13F | UBS Group AG | 0 | −100,00 | 0 | |||||
| 2025-08-08 | 13F | Kingsview Wealth Management, LLC | 12 760 | −1,54 | 507 | 5,85 | ||||
| 2025-08-15 | 13F | First Heartland Consultants, Inc. | 25 648 | 1 020 | ||||||
| 2025-08-06 | 13F | AE Wealth Management LLC | 43 662 | −3,54 | 1 736 | 3,64 | ||||
| 2025-07-14 | 13F | Kfg Wealth Management, Llc | 59 227 | 25,73 | 2 355 | 35,05 | ||||
| 2025-07-21 | 13F | DHJJ Financial Advisors, Ltd. | 21 471 | 27,45 | 854 | 36,92 | ||||
| 2025-05-14 | 13F | Valtinson Bruner Financial Planning LLC | 0 | −100,00 | 0 | |||||
| 2025-08-06 | 13F | Stone House Investment Management, LLC | 1 450 | 58 | ||||||
| 2025-08-15 | 13F | Chapman Financial Group, Llc | 3 100 | −8,82 | 123 | −3,15 | ||||
| 2025-08-11 | 13F | Brown Brothers Harriman & Co | 272 | 0,00 | 11 | 0,00 | ||||
| 2025-04-22 | 13F | Continuum Wealth Advisors, Llc | 0 | −100,00 | 0 | |||||
| 2025-08-07 | 13F | Tfo-tdc, Llc | 0 | −100,00 | 0 | |||||
| 2025-08-12 | 13F | Tradition Wealth Management, LLC | 20 174 | −3,23 | 802 | 4,02 | ||||
| 2025-08-19 | 13F | Advisory Services Network, LLC | 23 000 | 138,34 | 924 | 158,82 | ||||
| 2025-08-11 | 13F | HighTower Advisors, LLC | 431 695 | −1,70 | 17 164 | 5,61 | ||||
| 2025-05-12 | 13F | Fmr Llc | 0 | −100,00 | 0 | |||||
| 2025-07-29 | 13F | Balboa Wealth Partners | 0 | −100,00 | 0 | |||||
| 2025-08-14 | 13F | Raymond James Financial Inc | 331 546 | 76,98 | 13 182 | 90,13 | ||||
| 2025-08-14 | 13F | Alliancebernstein L.p. | 2 943 205 | 10,53 | 117 022 | 18,74 | ||||
| 2025-07-31 | 13F | Cardinal Point Capital Management, ULC | 16 230 | 0,00 | 645 | 7,50 | ||||
| 2025-07-15 | 13F | BCS Wealth Management | 31 131 | 11,54 | 1 | 0,00 | ||||
| 2025-07-18 | 13F | Truist Financial Corp | 178 359 | 4,92 | 7 092 | 12,72 | ||||
| 2025-08-05 | 13F | Huntington National Bank | 20 | |||||||
| 2025-08-13 | 13F | Capital Analysts, Inc. | 8 288 | 9,07 | 0 | |||||
| 2025-05-01 | 13F | Quest 10 Wealth Builders, Inc. | 19 090 | 0,00 | 713 | −0,42 | ||||
| 2025-05-13 | 13F | Coldstream Capital Management Inc | 0 | −100,00 | 0 | |||||
| 2025-08-14 | 13F | Garden State Investment Advisory Services LLC | 13 585 | 0,00 | 540 | 7,57 | ||||
| 2025-07-25 | 13F | Yarger Wealth Strategies, Llc | 75 696 | 3,43 | 3 010 | 11,12 | ||||
| 2025-07-17 | 13F | Janney Montgomery Scott LLC | 35 792 | −4,06 | 1 | 0,00 | ||||
| 2025-08-12 | 13F | Wood Tarver Financial Group, LLC | 3 326 | 0,00 | 0 | −100,00 | ||||
| 2025-07-10 | 13F | Focus Financial Network, Inc. | 21 770 | 4,25 | 866 | 12,05 | ||||
| 2025-08-13 | 13F | Cerity Partners LLC | 11 941 | −28,71 | 475 | −23,42 | ||||
| 2025-07-24 | 13F | Bernard Wealth Management Corp. | 920 | 0,99 | 37 | 9,09 | ||||
| 2025-07-29 | 13F | Straight Path Wealth Management | 5 354 | −16,30 | 213 | −10,17 | ||||
| 2025-08-12 | 13F | Steward Partners Investment Advisory, Llc | 3 949 | 0,00 | 157 | 7,53 | ||||
| 2025-08-19 | 13F | Cape Investment Advisory, Inc. | 41 825 | −9,32 | 1 663 | −2,64 | ||||
| 2025-07-24 | 13F | IFP Advisors, Inc | 43 123 | 32,38 | 1 715 | 42,24 | ||||
| 2025-08-12 | 13F | Bedel Financial Consulting, Inc. | 0 | −100,00 | 0 | |||||
| 2025-07-31 | 13F | Orion Capital Management LLC | 13 720 | −6,79 | 546 | 0,18 | ||||
| 2025-08-05 | 13F | Integrity Financial Corp /WA | 5 284 | −17,41 | 210 | −11,02 | ||||
| 2025-07-17 | 13F | City Holding Co | 430 | 0,00 | 17 | 13,33 | ||||
| 2025-08-14 | 13F | Susquehanna International Group, Llp | 26 098 | −76,20 | 1 038 | −74,44 | ||||
| 2025-07-14 | 13F | AdvisorNet Financial, Inc | 1 848 | −11,32 | 73 | −5,19 | ||||
| 2025-08-11 | 13F | Outlook Wealth Advisors, LLC | 38 994 | −3,70 | 1 550 | 3,47 | ||||
| 2025-08-12 | 13F | Park Square Financial Group, LLC | 138 | 0,00 | 5 | 0,00 | ||||
| 2025-07-10 | 13F | ARS Wealth Advisors Group, LLC | 114 802 | 4,53 | 4 565 | 12,30 | ||||
| 2025-08-08 | 13F | Cetera Investment Advisers | 212 948 | 6,70 | 8 467 | 14,62 | ||||
| 2025-08-05 | 13F | WorthPointe, LLC | 16 451 | 3,27 | 654 | 11,04 | ||||
| 2025-08-08 | 13F | Gts Securities Llc | 7 900 | 314 | ||||||
| 2025-08-12 | 13F | Tableaux Llc | 6 714 | 2 847 | ||||||
| 2025-07-28 | 13F | WealthPlan Investment Management, LLC | 5 444 | 0,00 | 216 | 7,46 | ||||
| 2025-08-04 | 13F | JDM Financial Group LLC | 21 447 | 0,00 | 853 | 7,44 | ||||
| 2025-07-28 | 13F | RFG Advisory, LLC | 27 724 | −17,87 | 1 102 | −11,77 | ||||
| 2025-07-10 | 13F | Wealth Enhancement Advisory Services, Llc | 368 519 | 389,97 | 14 697 | 428,06 | ||||
| 2025-08-12 | 13F | Change Path, LLC | 30 655 | 73,08 | 1 219 | 85,95 | ||||
| 2025-08-13 | 13F | BCJ Capital Management, LLC | 7 331 | −0,33 | 291 | 6,99 | ||||
| 2025-07-31 | 13F | Cambridge Investment Research Advisors, Inc. | 91 125 | 19,80 | 4 | 50,00 | ||||
| 2025-04-22 | 13F | Worth Financial Advisory Group, LLC | 0 | −100,00 | 0 | −100,00 | ||||
| 2025-08-08 | 13F | Emerald Investment Partners, Llc | 842 | 155,15 | 33 | 175,00 | ||||
| 2025-07-29 | 13F | BKD Wealth Advisors, LLC | 56 829 | −16,54 | 2 260 | −10,32 | ||||
| 2025-08-01 | 13F | Envestnet Asset Management Inc | 251 711 | 93,36 | 10 008 | 107,76 | ||||
| 2025-07-17 | 13F | Clay Northam Wealth Management, LLC | 6 960 | 4,11 | 277 | 11,74 | ||||
| 2025-07-31 | 13F | Blue Sky Capital Consultants Group, Inc. | 7 925 | 315 | ||||||
| 2025-08-11 | 13F | Principal Securities, Inc. | 5 065 | 23,09 | 201 | 30,52 | ||||
| 2025-07-31 | 13F | Pinnacle Wealth Management Group, Inc. | 63 535 | 16,62 | 2 526 | 25,30 | ||||
| 2025-07-11 | 13F | Farther Finance Advisors, LLC | 6 227 | 2,47 | 248 | 9,78 | ||||
| 2025-08-19 | 13F | National Asset Management, Inc. | 7 500 | −63,99 | 298 | −61,84 | ||||
| 2025-07-14 | 13F | U.S. Capital Wealth Advisors, LLC | 12 457 | 29,36 | 495 | 39,04 | ||||
| 2025-08-14 | 13F | GWM Advisors LLC | 36 668 | 149,09 | 1 458 | 167,83 | ||||
| 2025-07-14 | 13F | Southland Equity Partners LLC | 94 166 | −0,00 | 3 744 | 7,43 | ||||
| 2025-07-31 | 13F | Gill Capital Partners, Llc | 19 407 | 42,94 | 772 | 53,59 | ||||
| 2025-07-24 | 13F | Riverchase Wealth Management, Llc | 27 250 | 0,00 | 1 083 | 7,44 | ||||
| 2025-07-30 | 13F | Strategic Blueprint, LLC | 23 053 | −36,50 | 917 | −31,79 | ||||
| 2025-08-14 | 13F | AllSquare Wealth Management LLC | 350 | 0,00 | 14 | 8,33 | ||||
| 2025-08-04 | 13F | Pensionmark Financial Group, Llc | 22 588 | 31,69 | 898 | 41,64 | ||||
| 2025-08-13 | 13F | M Holdings Securities, Inc. | 13 967 | 1 | ||||||
| 2025-07-28 | 13F | Cornerstone Wealth Group, LLC | 28 913 | −5,56 | 1 150 | 1,41 | ||||
| 2025-08-05 | 13F | BCGM Wealth Management, LLC | 9 979 | 0,00 | 397 | 7,32 | ||||
| 2025-08-04 | 13F | Creative Financial Designs Inc /adv | 4 820 | 2,53 | 192 | 10,40 | ||||
| 2025-08-14 | 13F | Citadel Advisors Llc | 0 | −100,00 | 0 | |||||
| 2025-07-30 | 13F | Phoenix Holdings Ltd. | 9 920 | 394 | ||||||
| 2025-08-14 | 13F | Hrt Financial Lp | 7 920 | −43,00 | 0 | |||||
| 2025-08-14 | 13F | Old Mission Capital Llc | 99 564 | 622,00 | 3 959 | 676,08 | ||||
| 2025-08-08 | 13F | Foundations Investment Advisors, LLC | 12 413 | 29,19 | 494 | 38,87 | ||||
| 2025-08-13 | 13F | Townsquare Capital Llc | 0 | −100,00 | 0 | |||||
| 2025-08-11 | 13F | Brown Wealth Management, Llc | 32 215 | −1,89 | 1 281 | 5,35 | ||||
| 2025-08-15 | 13F | Nikulski Financial, Inc. | 15 420 | 30,07 | 613 | 39,95 | ||||
| 2025-05-07 | 13F | Keystone Financial Group, Inc. | 0 | −100,00 | 0 | |||||
| 2025-07-22 | 13F | Belpointe Asset Management LLC | 10 789 | 429 | ||||||
| 2025-07-21 | 13F | Patriot Financial Group Insurance Agency, LLC | 28 608 | 4,95 | 1 137 | 12,80 | ||||
| 2025-07-28 | 13F | Axxcess Wealth Management, Llc | 9 646 | 0,00 | 384 | 7,58 | ||||
| 2025-08-08 | 13F | Capital Investment Advisory Services, LLC | 574 | 28,70 | 23 | 37,50 | ||||
| 2025-08-14 | 13F | Aqr Capital Management Llc | 0 | −100,00 | 0 | |||||
| 2025-07-14 | 13F | CRA Financial Services, LLC | 24 770 | −5,35 | 985 | 1,65 | ||||
| 2025-07-22 | 13F | Diligent Investors, LLC | 17 652 | 55,50 | 702 | 66,90 | ||||
| 2025-08-12 | 13F | Jpmorgan Chase & Co | 3 230 | −74,77 | 128 | −72,94 | ||||
| 2025-09-04 | 13F/A | Advisor Group Holdings, Inc. | 494 108 | 25,35 | 19 646 | 34,67 | ||||
| 2025-07-24 | 13F | Blair William & Co/il | 97 837 | −38,00 | 3 890 | −33,41 | ||||
| 2025-08-11 | 13F | Anfield Capital Management, LLC | 327 | 13 | ||||||
| 2025-08-08 | 13F | Firestone Capital Management | 6 005 | 0,00 | 239 | 7,21 | ||||
| 2025-07-22 | 13F | Beacon Financial Advisory LLC | 9 600 | 23,87 | 382 | 33,22 | ||||
| 2025-08-14 | 13F | Benjamin Edwards Inc | 24 229 | 5,62 | 963 | 13,43 | ||||
| 2025-07-09 | 13F | Lineweaver Wealth Advisors, LLC | 310 594 | −0,96 | 12 349 | 6,40 | ||||
| 2025-07-29 | 13F | Stratos Wealth Advisors, LLC | 11 875 | −1,66 | 472 | 5,83 | ||||
| 2025-08-12 | 13F | Leigh Baldwin & Co., Llc | 10 525 | 11,08 | 418 | 19,43 | ||||
| 2025-08-15 | 13F | Captrust Financial Advisors | 39 846 | 43,14 | 1 584 | 53,79 |