Grundläggande statistik
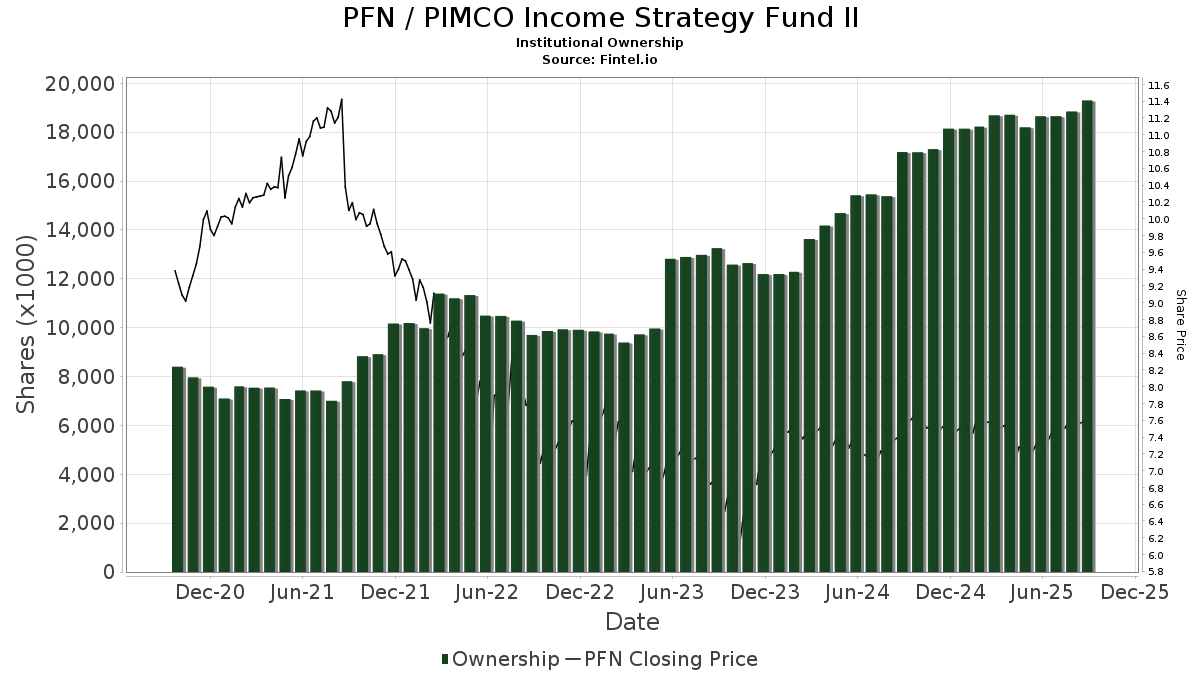
| Institutionella ägare | 128 total, 128 long only, 0 short only, 0 long/short - change of 2,40% MRQ |
| Genomsnittlig portföljallokering | 0.0872 % - change of 5,19% MRQ |
| Institutionella aktier (lång) | 19 293 527 (ex 13D/G) - change of 0,64MM shares 3,46% MRQ |
| Institutionellt värde (lång) | $ 130 169 USD ($1000) |
Institutionellt ägande och aktieägare
PIMCO Income Strategy Fund II (US:PFN) har 128 Institutionella ägare och aktieägare som har lämnat in 13D/G- eller 13F-formulär till Securities Exchange Commission (SEC). Dessa institut innehar totalt 19,293,527 aktier. Största aktieägare inkluderar Rivernorth Capital Management, Llc, RNDLX - RiverNorth/DoubleLine Strategic Income Fund Class R, Guggenheim Capital Llc, LPL Financial LLC, EverSource Wealth Advisors, LLC, Cohen & Steers, Inc., Ameriprise Financial Inc, Invesco Ltd., PCEF - Invesco CEF Income Composite ETF, and Raymond James Financial Inc .
PIMCO Income Strategy Fund II (NYSE:PFN) Institutionell ägarstruktur visar institutioners och fonders nuvarande positioner i företaget, samt de senaste förändringarna i positionernas storlek. Större aktieägare kan vara enskilda investerare, fonder, hedgefonder eller institutioner. Bilaga 13D visar att investeraren äger (eller ägde) mer än 5% av företaget och avser (eller avsåg) att aktivt eftersträva en förändring av affärsstrategin. Schedule 13G indikerar en passiv investering på över 5%.
The share price as of September 12, 2025 is 7,59 / share. Previously, on September 16, 2024, the share price was 7,43 / share. This represents an increase of 2,15% over that period.
Fondsentimentets poäng
Fondsentimentet poängen(fka Ägarackumulation-poäng) visar vilka aktier som är mest köpta av fonder. Det är resultatet av en sofistikerad kvantitativ flerfaktormodell som identifierar företag med de högsta nivåerna av institutionell ackumulering. Poängsättningsmodellen använder en kombination av den totala ökningen av redovisade ägare, förändringarna i portföljallokeringarna för dessa ägare och andra mått. Siffran sträcker sig från 0 till 100, där högre siffror indikerar en högre nivå av ackumulering i förhållande till sina konkurrenter, och 50 är genomsnittet.
Uppdateringsfrekvens: Dagligen
Se Ownership Explorer, som innehåller en lista över de högst rankade företagen.
Institutionell sälj/köp-kvot
Förutom att rapportera vanliga eget kapital- och skuldemissioner måste institutioner med mer än 100MM tillgångar under förvaltning också avslöja sina innehav av sälj- och köpoptioner. Eftersom säljoptioner i allmänhet indikerar ett negativt sentiment och köpoptioner indikerar ett positivt sentiment, kan vi få en uppfattning om det övergripande institutionella sentimentet genom att plotta förhållandet mellan säljoptioner och köpoptioner. Diagrammet till höger visar det historiska förhållandet mellan sälj- och köpoptioner för detta instrument.
Genom att använda sälj/köp-kvoten som en indikator på aktieägarnas sentiment undviker man en av de största bristerna med att använda det totala institutionella ägandet, nämligen att en betydande del av de förvaltade tillgångarna investeras passivt för att följa index. Passivt förvaltade fonder köper vanligtvis inte optioner, så indikatorn för sälj/köp-kvoten ger en bättre bild av stämningen i aktivt förvaltade fonder.
13F- och NPORT-arkiveringar
Detaljer om 13F-arkiveringar är gratis. Detaljer om NP-arkiveringar kräver ett premiummedlemskap. Gröna rader indikerar nya positioner. Röda rader indikerar stängda positioner. Klicka på länk symbolen för att se hela transaktionshistoriken.
Uppgradera
för att låsa upp premiumdata och exportera till Excel ![]() .
.
| Fil Datum | Källa | Investerare | Typ | Genomsnittligt pris (beräknat) |
Aktier | Δ Aktier (%) |
Rapporterat värde (1000 USD) |
Δ Värde (%) |
Portföljallokering (%) |
|
|---|---|---|---|---|---|---|---|---|---|---|
| 2025-08-11 | 13F | TD Waterhouse Canada Inc. | 0 | −100,00 | 0 | |||||
| 2025-08-29 | 13F | Centaurus Financial, Inc. | 356 600 | 234,95 | 3 | |||||
| 2025-08-13 | 13F | Luminist Capital LLC | 751 | 0,00 | 6 | 0,00 | ||||
| 2025-07-25 | 13F | Concord Wealth Partners | 957 | 3,01 | 7 | 0,00 | ||||
| 2025-08-05 | 13F | Key FInancial Inc | 548 | 0,00 | 4 | 0,00 | ||||
| 2025-07-18 | 13F | Consolidated Portfolio Review Corp | 372 691 | 1,17 | 2 754 | −0,83 | ||||
| 2025-07-25 | 13F | Cypress Capital Group | 47 157 | 348 | ||||||
| 2025-07-23 | 13F | Element Wealth, LLC | 21 717 | 0,12 | 160 | −1,84 | ||||
| 2025-08-07 | 13F | Allworth Financial LP | 5 509 | 179,64 | 41 | 185,71 | ||||
| 2025-08-08 | 13F | Cetera Investment Advisers | 88 780 | −1,79 | 656 | −3,67 | ||||
| 2025-05-14 | 13F | Susquehanna International Group, Llp | 0 | −100,00 | 0 | |||||
| 2025-07-29 | 13F | Private Trust Co Na | 192 830 | −1,72 | 1 425 | −3,65 | ||||
| 2025-08-08 | 13F | Pnc Financial Services Group, Inc. | 700 | 0,00 | 5 | 0,00 | ||||
| 2025-08-28 | NP | RNCOX - RiverNorth Core Opportunity Fund Class R | 45 292 | 0,00 | 335 | −2,05 | ||||
| 2025-07-30 | 13F | D.a. Davidson & Co. | 14 518 | −18,11 | 107 | −19,55 | ||||
| 2025-07-30 | 13F | FNY Investment Advisers, LLC | 1 200 | 0,00 | 0 | |||||
| 2025-08-12 | 13F | Steward Partners Investment Advisory, Llc | 6 100 | 0,00 | 45 | 0,00 | ||||
| 2025-07-28 | NP | PCEF - Invesco CEF Income Composite ETF This fund is a listed as child fund of Invesco Ltd. and if that institution has disclosed ownership in this security, then these positions will not be double counted when calculating total shares and total value | 650 854 | −0,42 | 4 745 | −4,24 | ||||
| 2025-07-31 | 13F | Whipplewood Advisors, LLC | 132 698 | 981 | ||||||
| 2025-09-04 | 13F/A | Advisor Group Holdings, Inc. | 251 168 | −12,91 | 1 856 | −14,63 | ||||
| 2025-08-27 | NP | THRIVENT SERIES FUND INC - Thrivent Diversified Income Plus Portfolio Class A | 10 595 | 0,00 | 78 | −1,27 | ||||
| 2025-04-17 | 13F | Rs Crum Inc. | 55 750 | 0,00 | 420 | 1,20 | ||||
| 2025-08-01 | 13F | Envestnet Asset Management Inc | 371 572 | 4,64 | 2 746 | 2,54 | ||||
| 2025-05-14 | 13F | REAP Financial Group, LLC | 0 | −100,00 | 0 | −100,00 | ||||
| 2025-07-11 | 13F | Vanguard Capital Wealth Advisors This fund is a listed as child fund of Vanguard Group Inc and if that institution has disclosed ownership in this security, then these positions will not be double counted when calculating total shares and total value | 30 000 | 0,00 | 222 | −2,21 | ||||
| 2025-05-15 | 13F | Citadel Advisors Llc | 0 | −100,00 | 0 | |||||
| 2025-05-09 | 13F | GeoWealth Management, LLC | 0 | −100,00 | 0 | −100,00 | ||||
| 2025-08-11 | 13F | Pin Oak Investment Advisors Inc | 50 | 0 | ||||||
| 2025-08-13 | 13F | EverSource Wealth Advisors, LLC | 1 016 015 | 1,44 | 7 508 | −0,57 | ||||
| 2025-08-27 | NP | THRIVENT SERIES FUND INC - Thrivent Balanced Income Plus Portfolio Class A | 4 167 | 0,00 | 31 | −3,23 | ||||
| 2025-07-17 | 13F | Sonora Investment Management Group, LLC | 28 660 | 0,00 | 212 | −2,31 | ||||
| 2025-08-12 | 13F | J.w. Cole Advisors, Inc. | 256 591 | 3,50 | 1 896 | 1,44 | ||||
| 2025-08-19 | 13F | Advisory Services Network, LLC | 0 | −100,00 | 0 | |||||
| 2025-08-14 | 13F | Certified Advisory Corp | 44 637 | −0,67 | 330 | −2,66 | ||||
| 2025-08-14 | 13F | UBS Group AG | 85 143 | −4,10 | 629 | −5,98 | ||||
| 2025-07-21 | 13F | Ameritas Advisory Services, LLC | 43 210 | 59,65 | 319 | 58,71 | ||||
| 2025-07-17 | 13F | Smith Chas P & Associates Pa Cpas | 33 458 | −4,16 | 247 | −6,08 | ||||
| 2025-07-23 | 13F | Elm3 Financial Group, LLC | 40 690 | 5,30 | 301 | 3,09 | ||||
| 2025-07-25 | 13F | Cwm, Llc | 29 350 | 0,00 | 0 | |||||
| 2025-08-14 | 13F | Beaird Harris Wealth Management, LLC | 800 | 0,00 | 6 | −16,67 | ||||
| 2025-07-22 | 13F | Willner & Heller, Llc | 11 011 | 0,60 | 81 | −1,22 | ||||
| 2025-08-14 | 13F | Synovus Financial Corp | 44 000 | −0,68 | 325 | −2,69 | ||||
| 2025-08-12 | 13F | LPL Financial LLC | 1 184 073 | 3,98 | 8 750 | 1,92 | ||||
| 2025-08-13 | 13F | Colonial Trust Advisors | 1 900 | 0,00 | 14 | 0,00 | ||||
| 2025-08-14 | 13F | CoreCap Advisors, LLC | 233 915 | 1,60 | 1 729 | −0,46 | ||||
| 2025-08-14 | 13F | GWM Advisors LLC | 75 535 | −7,23 | 558 | −8,97 | ||||
| 2025-04-29 | 13F | Truist Financial Corp | 0 | −100,00 | 0 | |||||
| 2025-08-06 | 13F | Financial Alternatives, Inc | 17 203 | −3,71 | 127 | −5,22 | ||||
| 2025-08-11 | 13F | Addison Capital Co | 51 734 | 0,00 | 382 | −2,05 | ||||
| 2025-07-11 | 13F | Seacrest Wealth Management, Llc | 23 594 | 0,84 | 174 | −1,14 | ||||
| 2025-08-11 | 13F | Semus Wealth Partners LLC | 24 548 | 0,25 | 181 | −1,63 | ||||
| 2025-07-10 | 13F | Burns J W & Co Inc/ny | 15 100 | −3,19 | 112 | −5,13 | ||||
| 2025-08-05 | 13F | GPS Wealth Strategies Group, LLC | 4 069 | 0,00 | 30 | 0,00 | ||||
| 2025-07-28 | 13F | Harbour Investments, Inc. | 1 325 | 2,95 | 10 | 0,00 | ||||
| 2025-08-11 | 13F | Shufro Rose & Co Llc | 26 400 | −3,65 | 199 | −3,40 | ||||
| 2025-08-05 | 13F | Bank Of Montreal /can/ | 14 350 | 8,30 | 106 | 7,07 | ||||
| 2025-08-05 | 13F | Verity Asset Management, Inc. | 11 695 | 86 | ||||||
| 2025-08-08 | 13F | Avantax Advisory Services, Inc. | 38 604 | 220,42 | 285 | 216,67 | ||||
| 2025-08-14 | 13F | Atomi Financial Group, Inc. | 51 779 | 0,00 | 383 | −2,05 | ||||
| 2025-07-10 | 13F | Focus Financial Network, Inc. | 0 | −100,00 | 0 | |||||
| 2025-07-29 | 13F | Salomon & Ludwin, LLC | 1 450 | 0,00 | 11 | 0,00 | ||||
| 2025-06-26 | NP | AABFX - Thrivent Balanced Income Plus Fund Class A | 4 507 | 0,00 | 33 | −3,03 | ||||
| 2025-08-28 | NP | RNDLX - RiverNorth/DoubleLine Strategic Income Fund Class R | 2 659 190 | 0,19 | 19 651 | −1,80 | ||||
| 2025-08-13 | 13F | StoneX Group Inc. | 14 685 | −41,96 | 109 | −43,16 | ||||
| 2025-06-26 | NP | AAINX - Thrivent Opportunity Income Plus Fund Class A | 36 130 | 0,00 | 263 | −2,95 | ||||
| 2025-04-22 | 13F | Putney Financial Group LLC | 0 | −100,00 | 0 | |||||
| 2025-07-17 | 13F | Sound Income Strategies, LLC | 4 786 | 0,00 | 35 | −2,78 | ||||
| 2025-08-14 | 13F | Bank Of America Corp /de/ | 102 299 | 13,42 | 756 | 11,03 | ||||
| 2025-08-14 | 13F | Colony Group, LLC | 10 515 | 78 | ||||||
| 2025-08-05 | 13F | Shaker Financial Services, LLC | 51 718 | 386 | ||||||
| 2025-08-14 | 13F | Cohen & Steers, Inc. | 806 234 | 0,00 | 6 | −16,67 | ||||
| 2025-07-29 | 13F | Stratos Wealth Partners, LTD. | 159 835 | 40,14 | 1 181 | 37,49 | ||||
| 2025-08-13 | 13F | Guggenheim Capital Llc | 1 889 151 | 5,78 | 13 961 | 3,68 | ||||
| 2025-07-23 | 13F | Morey & Quinn Wealth Partners, LLC | 17 700 | 0,00 | 131 | −2,26 | ||||
| 2025-08-04 | 13F | Pensionmark Financial Group, Llc | 10 776 | 0,00 | 80 | −2,47 | ||||
| 2025-08-14 | 13F | Royal Bank Of Canada | 58 606 | −1,97 | 433 | −3,99 | ||||
| 2025-08-14 | 13F | Wells Fargo & Company/mn | 350 261 | 14,20 | 2 588 | 11,94 | ||||
| 2025-08-14 | 13F | Main Street Financial Solutions, LLC | 56 691 | 12,88 | 419 | 10,58 | ||||
| 2025-08-12 | 13F | CIBC Private Wealth Group, LLC | 31 | 0,00 | 0 | |||||
| 2025-08-13 | 13F | Invesco Ltd. | 670 454 | 4,23 | 4 955 | 2,14 | ||||
| 2025-08-14 | 13F | TCG Advisory Services, LLC | 78 155 | −22,71 | 578 | −24,28 | ||||
| 2025-08-27 | NP | AAHYX - Thrivent Diversified Income Plus Fund Class A | 16 869 | 0,00 | 125 | −2,36 | ||||
| 2025-08-19 | 13F | Newbridge Financial Services Group, Inc. | 25 726 | 190 | ||||||
| 2025-08-14 | 13F | Arete Wealth Advisors, LLC | 0 | −100,00 | 0 | |||||
| 2025-08-12 | 13F | Proequities, Inc. | 0 | 0 | ||||||
| 2025-08-13 | 13F | Rsm Us Wealth Management Llc | 41 493 | −50,57 | 307 | −51,88 | ||||
| 2025-08-13 | 13F | Northwestern Mutual Wealth Management Co | 230 239 | −24,53 | 1 701 | −26,04 | ||||
| 2025-08-12 | 13F | Walled Lake Planning & Wealth Management, Llc | 27 800 | 0,00 | 205 | −1,91 | ||||
| 2025-08-14 | 13F | Rivernorth Capital Management, Llc | 2 704 482 | 0,19 | 19 986 | −1,80 | ||||
| 2025-07-22 | 13F | Keudell/Morrison Wealth Management | 77 556 | 573 | ||||||
| 2025-08-14 | 13F | Murphy & Mullick Capital Management Corp | 500 | 0,00 | 4 | 0,00 | ||||
| 2025-08-06 | 13F | Moors & Cabot, Inc. | 54 629 | 0,05 | 404 | −1,95 | ||||
| 2025-08-07 | 13F | Ibex Wealth Advisors | 10 988 | 0,00 | 81 | −1,22 | ||||
| 2025-08-14 | 13F | Ameriprise Financial Inc | 758 129 | 11,20 | 5 603 | 8,99 | ||||
| 2025-08-04 | 13F | Creative Financial Designs Inc /adv | 885 | 0,00 | 7 | 0,00 | ||||
| 2025-07-17 | 13F | Janney Montgomery Scott LLC | 31 975 | −3,03 | 0 | |||||
| 2025-07-21 | 13F | Ameriflex Group, Inc. | 7 602 | 0,00 | 56 | −3,51 | ||||
| 2025-08-14 | 13F/A | Rockefeller Capital Management L.P. | 76 565 | −1,69 | 566 | −3,75 | ||||
| 2025-08-18 | 13F | Hollencrest Capital Management | 5 968 | 0,00 | 44 | 0,00 | ||||
| 2025-07-18 | 13F | Trust Co Of Vermont | 975 | 7 | ||||||
| 2025-07-23 | 13F | Clear Creek Financial Management, LLC | 49 892 | −32,75 | 369 | −34,17 | ||||
| 2025-08-26 | 13F/A | Thrivent Financial For Lutherans | 116 000 | 0,00 | 1 | |||||
| 2025-07-24 | 13F | JNBA Financial Advisors | 2 565 | 12,11 | 19 | 5,88 | ||||
| 2025-08-19 | 13F | National Asset Management, Inc. | 18 129 | 10,48 | 134 | 8,13 | ||||
| 2025-07-07 | 13F | Thurston, Springer, Miller, Herd & Titak, Inc. | 3 156 | 2,94 | 23 | 0,00 | ||||
| 2025-08-13 | 13F | Thomas J. Herzfeld Advisors, Inc. | 308 727 | −14,91 | 2 281 | −16,60 | ||||
| 2025-08-14 | 13F | Balyasny Asset Management Llc | 19 405 | 143 | ||||||
| 2025-04-22 | 13F | Synergy Financial Management, LLC | 0 | −100,00 | 0 | |||||
| 2025-08-14 | 13F | Two Sigma Securities, Llc | 17 292 | 128 | ||||||
| 2025-08-14 | 13F | Stifel Financial Corp | 91 790 | −0,86 | 678 | −2,87 | ||||
| 2025-08-14 | 13F | First Foundation Advisors | 19 636 | 1,19 | 145 | −0,68 | ||||
| 2025-07-14 | 13F | Gridiron Partners, LLC | 10 869 | 80 | ||||||
| 2025-08-06 | 13F | Commonwealth Equity Services, Llc | 259 049 | −5,17 | 2 | −50,00 | ||||
| 2025-04-15 | 13F | Noble Wealth Management PBC | 322 253 | −2,86 | 2 430 | −1,70 | ||||
| 2025-08-04 | 13F | Amplius Wealth Advisors, LLC | 11 000 | 0,00 | 81 | −1,22 | ||||
| 2025-07-29 | 13F | Koshinski Asset Management, Inc. | 11 721 | 0,00 | 87 | −2,27 | ||||
| 2025-08-06 | 13F | Wedbush Securities Inc | 13 731 | −6,58 | 0 | |||||
| 2025-08-07 | 13F | Gs Investments, Inc. | 1 000 | 0,00 | 7 | 0,00 | ||||
| 2025-08-11 | 13F | Aptus Capital Advisors, LLC | 23 378 | 0,00 | 173 | −2,27 | ||||
| 2025-08-12 | 13F | Change Path, LLC | 0 | −100,00 | 0 | |||||
| 2025-08-14 | 13F | Raymond James Financial Inc | 447 310 | −2,13 | 3 306 | −4,09 | ||||
| 2025-07-09 | 13F | St. Louis Financial Planners Asset Management, LLC | 0 | −100,00 | 0 | |||||
| 2025-08-06 | 13F | Mark Sheptoff Financial Planning, Llc | 300 | 0,00 | 3 | 0,00 | ||||
| 2025-07-11 | 13F | Mallini Complete Financial Planning LLC | 50 849 | 13,99 | 376 | 11,61 | ||||
| 2025-08-15 | 13F | Tower Research Capital LLC (TRC) | 0 | −100,00 | 0 | |||||
| 2025-07-31 | 13F | Cambridge Investment Research Advisors, Inc. | 67 510 | 1,13 | 0 | |||||
| 2025-08-14 | 13F | Great Valley Advisor Group, Inc. | 0 | −100,00 | 0 | |||||
| 2025-08-13 | 13F | Lido Advisors, LLC | 19 001 | 0,00 | 142 | −2,08 | ||||
| 2025-08-27 | NP | THRIVENT SERIES FUND INC - Thrivent Opportunity Income Plus Portfolio Class A | 8 107 | 0,00 | 60 | −3,28 | ||||
| 2025-08-18 | 13F | Geneos Wealth Management Inc. | 12 580 | 11,33 | 93 | 8,24 | ||||
| 2025-08-04 | 13F | Spire Wealth Management | 409 | 0,00 | 3 | 0,00 | ||||
| 2025-08-14 | 13F | Herold Advisors, Inc. | 40 250 | 297 | ||||||
| 2025-08-12 | 13F | Horizon Kinetics Asset Management Llc | 256 466 | −0,33 | 1 895 | −2,32 | ||||
| 2025-07-24 | 13F | Us Bancorp \de\ | 3 648 | −80,49 | 27 | −81,43 | ||||
| 2025-08-11 | 13F | Private Advisor Group, LLC | 15 948 | −42,73 | 118 | −44,02 | ||||
| 2025-08-04 | 13F | Pinnacle Associates Ltd | 26 270 | 0,00 | 194 | −2,02 | ||||
| 2025-07-07 | 13F | Wealth Alliance Advisory Group, LLC | 12 000 | 0,00 | 89 | −2,22 | ||||
| 2025-07-25 | 13F | Apollon Wealth Management, LLC | 43 642 | −41,22 | 323 | −42,40 | ||||
| 2025-08-11 | 13F | Root Financial Partners, LLC | 0 | −100,00 | 0 | |||||
| 2025-08-15 | 13F | Equitable Holdings, Inc. | 13 279 | 98 | ||||||
| 2025-08-15 | 13F | Morgan Stanley | 431 732 | −2,48 | 3 191 | −4,43 | ||||
| 2025-05-06 | 13F | Readystate Asset Management Lp | 0 | −100,00 | 0 | |||||
| 2025-05-14 | 13F | Landscape Capital Management, L.l.c. | 0 | −100,00 | 0 | |||||
| 2025-08-13 | 13F | Summit Financial, LLC | 11 377 | 85 | ||||||
| 2025-07-25 | 13F | Atria Wealth Solutions, Inc. | 10 327 | 0,00 | 77 | −1,28 | ||||
| 2025-08-15 | 13F | Kestra Advisory Services, LLC | 43 635 | 26,83 | 322 | 24,32 | ||||
| 2025-07-24 | 13F | IFP Advisors, Inc | 0 | −100,00 | 0 | |||||
| 2025-08-14 | 13F | Comerica Bank | 3 000 | 0,00 | 22 | 0,00 |