Grundläggande statistik
| Institutionella ägare | 127 total, 127 long only, 0 short only, 0 long/short - change of −3,79% MRQ |
| Genomsnittlig portföljallokering | 0.2090 % - change of −18,02% MRQ |
| Institutionella aktier (lång) | 7 420 192 (ex 13D/G) - change of −0,83MM shares −10,11% MRQ |
| Institutionellt värde (lång) | $ 345 454 USD ($1000) |
Institutionellt ägande och aktieägare
Invesco Exchange-Traded Fund Trust - Invesco Dividend Achievers ETF (US:PFM) har 127 Institutionella ägare och aktieägare som har lämnat in 13D/G- eller 13F-formulär till Securities Exchange Commission (SEC). Dessa institut innehar totalt 7,420,192 aktier. Största aktieägare inkluderar LPL Financial LLC, Raymond James Financial Inc, Morgan Stanley, Hartland & Co., LLC, Bank Of America Corp /de/, Wells Fargo & Company/mn, Jones Financial Companies Lllp, Royal Bank Of Canada, Citizens Financial Group Inc/ri, and NFP Retirement, Inc. .
Invesco Exchange-Traded Fund Trust - Invesco Dividend Achievers ETF (NasdaqGM:PFM) Institutionell ägarstruktur visar institutioners och fonders nuvarande positioner i företaget, samt de senaste förändringarna i positionernas storlek. Större aktieägare kan vara enskilda investerare, fonder, hedgefonder eller institutioner. Bilaga 13D visar att investeraren äger (eller ägde) mer än 5% av företaget och avser (eller avsåg) att aktivt eftersträva en förändring av affärsstrategin. Schedule 13G indikerar en passiv investering på över 5%.
The share price as of September 12, 2025 is 50,63 / share. Previously, on September 16, 2024, the share price was 46,25 / share. This represents an increase of 9,46% over that period.

Fondsentimentets poäng
Fondsentimentet poängen(fka Ägarackumulation-poäng) visar vilka aktier som är mest köpta av fonder. Det är resultatet av en sofistikerad kvantitativ flerfaktormodell som identifierar företag med de högsta nivåerna av institutionell ackumulering. Poängsättningsmodellen använder en kombination av den totala ökningen av redovisade ägare, förändringarna i portföljallokeringarna för dessa ägare och andra mått. Siffran sträcker sig från 0 till 100, där högre siffror indikerar en högre nivå av ackumulering i förhållande till sina konkurrenter, och 50 är genomsnittet.
Uppdateringsfrekvens: Dagligen
Se Ownership Explorer, som innehåller en lista över de högst rankade företagen.
Institutionell sälj/köp-kvot
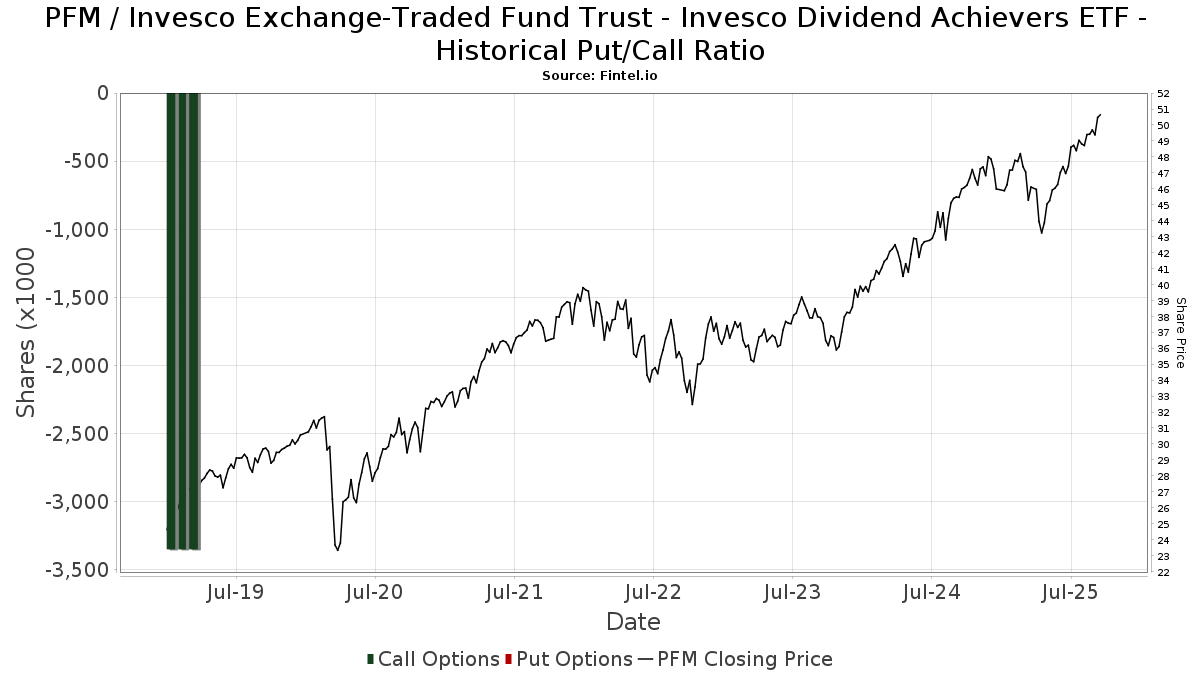
Förutom att rapportera vanliga eget kapital- och skuldemissioner måste institutioner med mer än 100MM tillgångar under förvaltning också avslöja sina innehav av sälj- och köpoptioner. Eftersom säljoptioner i allmänhet indikerar ett negativt sentiment och köpoptioner indikerar ett positivt sentiment, kan vi få en uppfattning om det övergripande institutionella sentimentet genom att plotta förhållandet mellan säljoptioner och köpoptioner. Diagrammet till höger visar det historiska förhållandet mellan sälj- och köpoptioner för detta instrument.
Genom att använda sälj/köp-kvoten som en indikator på aktieägarnas sentiment undviker man en av de största bristerna med att använda det totala institutionella ägandet, nämligen att en betydande del av de förvaltade tillgångarna investeras passivt för att följa index. Passivt förvaltade fonder köper vanligtvis inte optioner, så indikatorn för sälj/köp-kvoten ger en bättre bild av stämningen i aktivt förvaltade fonder.
13F- och NPORT-arkiveringar
Detaljer om 13F-arkiveringar är gratis. Detaljer om NP-arkiveringar kräver ett premiummedlemskap. Gröna rader indikerar nya positioner. Röda rader indikerar stängda positioner. Klicka på länk symbolen för att se hela transaktionshistoriken.
Uppgradera
för att låsa upp premiumdata och exportera till Excel ![]() .
.
| Fil Datum | Källa | Investerare | Typ | Genomsnittligt pris (beräknat) |
Aktier | Δ Aktier (%) |
Rapporterat värde (1000 USD) |
Δ Värde (%) |
Portföljallokering (%) |
|
|---|---|---|---|---|---|---|---|---|---|---|
| 2025-07-28 | 13F | Nestegg Advisors, Inc. | 51 325 | −1,42 | 2 472 | 3,73 | ||||
| 2025-07-10 | 13F | Wealth Enhancement Advisory Services, Llc | 10 147 | 17,36 | 496 | 25,57 | ||||
| 2025-07-17 | 13F | PMG Wealth Management, Inc. | 6 485 | −2,99 | 312 | 1,96 | ||||
| 2025-08-15 | 13F | Tower Research Capital LLC (TRC) | 0 | −100,00 | 0 | |||||
| 2025-08-13 | 13F | Rsm Us Wealth Management Llc | 105 410 | −0,11 | 5 078 | 5,11 | ||||
| 2025-07-07 | 13F | Nova Wealth Management, Inc. | 2 258 | −10,72 | 109 | −6,09 | ||||
| 2025-08-08 | 13F | Creative Planning | 9 404 | 1,72 | 453 | 6,86 | ||||
| 2025-08-11 | 13F | Aptus Capital Advisors, LLC | 9 040 | 0,00 | 435 | 5,33 | ||||
| 2025-08-04 | 13F | Assetmark, Inc | 111 | 5 | ||||||
| 2025-08-12 | 13F | Change Path, LLC | 69 363 | 9,29 | 3 341 | 15,01 | ||||
| 2025-08-14 | 13F | IHT Wealth Management, LLC | 8 754 | 13,66 | 422 | 19,60 | ||||
| 2025-07-15 | 13F | Bfsg, Llc | 293 | 14 | ||||||
| 2025-07-24 | 13F | Advanced Asset Management Advisors Inc | 1 380 | 0,00 | 66 | 4,76 | ||||
| 2025-08-14 | 13F | Susquehanna International Group, Llp | 5 454 | 263 | ||||||
| 2025-06-26 | NP | DWTFX - ARROW DWA TACTICAL FUND CLASS A SHARES | 71 347 | −4,10 | 3 214 | −8,95 | ||||
| 2025-08-08 | 13F | Capital Investment Advisory Services, LLC | 1 950 | 0,00 | 94 | 4,49 | ||||
| 2025-08-08 | 13F | Cetera Investment Advisers | 53 841 | −30,67 | 2 594 | −27,04 | ||||
| 2025-08-14 | 13F | Financial Network Wealth Advisors LLC | 0 | −100,00 | 0 | |||||
| 2025-08-15 | 13F | Kestra Advisory Services, LLC | 6 646 | −4,06 | 320 | 0,95 | ||||
| 2025-07-23 | 13F | Steel Peak Wealth Management LLC | 17 283 | −88,66 | 833 | −88,08 | ||||
| 2025-07-11 | 13F | Farther Finance Advisors, LLC | 3 991 | 0,00 | 192 | 5,49 | ||||
| 2025-08-11 | 13F | HighTower Advisors, LLC | 36 301 | −0,71 | 1 749 | 4,48 | ||||
| 2025-08-08 | 13F | Capital Investment Counsel, Inc | 0 | −100,00 | 0 | |||||
| 2025-08-14 | 13F | First Manhattan Co | 6 400 | 0,00 | 308 | 5,48 | ||||
| 2025-08-14 | 13F | Mercer Global Advisors Inc /adv | 5 186 | −0,10 | 250 | 5,06 | ||||
| 2025-08-14 | 13F | Hilton Capital Management, LLC | 20 056 | 0,00 | 966 | 5,23 | ||||
| 2025-08-15 | 13F | Equitable Holdings, Inc. | 53 110 | 2,97 | 2 558 | 8,34 | ||||
| 2025-08-04 | 13F | Flagship Harbor Advisors, Llc | 17 755 | 3,12 | 855 | 8,50 | ||||
| 2025-07-31 | 13F | Briaud Financial Planning, Inc | 3 890 | 0 | ||||||
| 2025-08-12 | 13F | Steward Partners Investment Advisory, Llc | 45 402 | 3,63 | 2 187 | 9,03 | ||||
| 2025-07-17 | 13F | XML Financial, LLC | 5 056 | −5,21 | 244 | −0,41 | ||||
| 2025-08-11 | 13F | Dorsey Wright & Associates | 0 | −100,00 | 0 | |||||
| 2025-08-11 | 13F | Private Advisor Group, LLC | 47 373 | 55,85 | 2 282 | 63,98 | ||||
| 2025-05-16 | 13F | Coppell Advisory Solutions LLC | 0 | −100,00 | 0 | |||||
| 2025-07-30 | 13F | Wbh Advisory Inc | 10 461 | −6,76 | 504 | −1,95 | ||||
| 2025-08-07 | 13F | Ibex Wealth Advisors | 8 461 | 408 | ||||||
| 2025-08-13 | 13F | Sanibel Captiva Trust Company, Inc. | 10 850 | −13,60 | 523 | −9,06 | ||||
| 2025-07-11 | 13F | Bond & Devick Financial Network, Inc. | 13 561 | 0,00 | 653 | 5,32 | ||||
| 2025-08-08 | 13F | Good Life Advisors, LLC | 7 234 | 14,30 | 348 | 20,42 | ||||
| 2025-07-17 | 13F | Wagner Wealth Management, Llc | 18 | 0,00 | 1 | |||||
| 2025-08-18 | 13F | Geneos Wealth Management Inc. | 1 425 | 0,00 | 69 | 4,62 | ||||
| 2025-07-22 | 13F | Brown Miller Wealth Management, LLC | 0 | −100,00 | 0 | |||||
| 2025-07-22 | 13F | Iron Horse Wealth Management, LLC | 204 | 0,00 | 10 | 0,00 | ||||
| 2025-04-09 | 13F | St Germain D J Co Inc | 0 | −100,00 | 0 | |||||
| 2025-07-08 | 13F | Webster Bank, N. A. | 570 | 0,00 | 27 | 3,85 | ||||
| 2025-08-11 | 13F | Citigroup Inc | 2 977 | 0,00 | 143 | 5,15 | ||||
| 2025-08-14 | 13F/A | Rockefeller Capital Management L.P. | 105 334 | −0,96 | 5 074 | 4,19 | ||||
| 2025-08-08 | 13F | Hartland & Co., LLC | 426 266 | −1,13 | 20 533 | 4,03 | ||||
| 2025-08-12 | 13F | Proequities, Inc. | 0 | 0 | ||||||
| 2025-08-14 | 13F | Mariner, LLC | 67 889 | 1,21 | 3 270 | 6,51 | ||||
| 2025-08-14 | 13F | EP Wealth Advisors, Inc. | 7 631 | −15,87 | 368 | −11,57 | ||||
| 2025-08-13 | 13F | Northwestern Mutual Wealth Management Co | 8 838 | 0,00 | 426 | 5,20 | ||||
| 2025-08-14 | 13F | Fmr Llc | 16 106 | 3,14 | 776 | 8,54 | ||||
| 2025-07-25 | 13F | Atria Wealth Solutions, Inc. | 5 594 | −97,63 | 269 | −97,51 | ||||
| 2025-07-31 | 13F | Hanlon Investment Management, Inc. | 0 | −100,00 | 0 | |||||
| 2025-08-13 | 13F | Haverford Trust Co | 4 170 | 201 | ||||||
| 2025-08-12 | 13F | J.w. Cole Advisors, Inc. | 34 346 | 0,59 | 1 654 | 5,82 | ||||
| 2025-04-21 | 13F | Ronald Blue Trust, Inc. | 0 | −100,00 | 0 | −100,00 | ||||
| 2025-08-01 | 13F | Envestnet Asset Management Inc | 9 793 | −84,27 | 472 | −83,47 | ||||
| 2025-08-13 | 13F | Congress Wealth Management LLC / DE / | 8 601 | 0,15 | 414 | 5,34 | ||||
| 2025-08-13 | 13F | Townsquare Capital Llc | 0 | −100,00 | 0 | |||||
| 2025-07-10 | 13F | Capital Advisory Group Advisory Services, LLC | 54 293 | −1,67 | 2 615 | 3,48 | ||||
| 2025-05-02 | 13F | Private Wealth Management Group, LLC | 0 | −100,00 | 0 | |||||
| 2025-07-22 | 13F | Merit Financial Group, LLC | 35 778 | 139,49 | 1 723 | 152,27 | ||||
| 2025-07-29 | 13F | Rodgers & Associates, LTD | 5 894 | 0,00 | 284 | 5,20 | ||||
| 2025-07-08 | 13F | Parallel Advisors, LLC | 373 | 0,54 | 18 | 6,25 | ||||
| 2025-07-18 | 13F | Institute for Wealth Management, LLC. | 40 030 | −0,67 | 1 928 | 4,56 | ||||
| 2025-08-11 | 13F | Tidemark, LLC | 808 | −31,58 | 39 | −29,63 | ||||
| 2025-07-10 | 13F | Sovran Advisors, LLC | 4 749 | 231 | ||||||
| 2025-09-04 | 13F/A | Advisor Group Holdings, Inc. | 54 541 | 4,69 | 2 628 | 10,15 | ||||
| 2025-07-31 | 13F | Cambridge Investment Research Advisors, Inc. | 54 635 | 5,29 | 3 | 0,00 | ||||
| 2025-08-14 | 13F | Federation des caisses Desjardins du Quebec | 1 175 | 0,00 | 57 | 5,66 | ||||
| 2025-08-04 | 13F | Northwest Financial Advisors | 5 471 | 0,00 | 264 | 5,20 | ||||
| 2025-08-14 | 13F | Comerica Bank | 547 | −83,41 | 26 | −82,67 | ||||
| 2025-05-08 | 13F | Heritage Wealth Advisors | 0 | −100,00 | 0 | |||||
| 2025-08-04 | 13F | Carret Asset Management, Llc | 6 000 | 0,00 | 289 | 5,47 | ||||
| 2025-08-14 | 13F | Wells Fargo & Company/mn | 203 096 | −52,63 | 9 783 | −50,16 | ||||
| 2025-08-06 | 13F | Commonwealth Equity Services, Llc | 85 698 | −4,64 | 4 | 0,00 | ||||
| 2025-08-12 | 13F | Founders Financial Alliance, LLC | 1 520 | 0,00 | 73 | 5,80 | ||||
| 2025-08-14 | 13F | Bank Of America Corp /de/ | 273 553 | −0,31 | 13 177 | 4,90 | ||||
| 2025-08-05 | 13F | Bank of New York Mellon Corp | 30 306 | 29,45 | 1 460 | 36,23 | ||||
| 2025-08-08 | 13F | Flaharty Asset Management, LLC | 0 | −100,00 | 0 | |||||
| 2025-08-15 | 13F | Morgan Stanley | 721 560 | 7,71 | 34 758 | 13,33 | ||||
| 2025-07-16 | 13F | PFS Partners, LLC | 0 | −100,00 | 0 | |||||
| 2025-08-06 | 13F | AE Wealth Management LLC | 30 | 0,00 | 1 | 0,00 | ||||
| 2025-08-05 | 13F | Bank Of Montreal /can/ | 21 300 | 1,65 | 1 026 | 6,99 | ||||
| 2025-07-29 | 13F | Private Trust Co Na | 6 019 | −6,57 | 290 | −1,70 | ||||
| 2025-08-14 | 13F | Guardian Wealth Advisors, Llc / Nc | 2 520 | 0,00 | 121 | 5,22 | ||||
| 2025-07-16 | 13F | Essex Financial Services, Inc. | 4 900 | 0,00 | 236 | 5,36 | ||||
| 2025-08-14 | 13F | Citadel Advisors Llc | 0 | −100,00 | 0 | |||||
| 2025-08-14 | 13F | Mml Investors Services, Llc | 66 062 | 3,03 | 3 | 50,00 | ||||
| 2025-06-26 | NP | DWAT - Arrow DWA Tactical ETF | 4 658 | 9,09 | 210 | 3,47 | ||||
| 2025-08-12 | 13F | Global Retirement Partners, LLC | 516 | 8 500,00 | 25 | |||||
| 2025-08-14 | 13F | UBS Group AG | 95 577 | −6,49 | 4 604 | −1,60 | ||||
| 2025-04-10 | 13F | Retireful, LLC | 0 | −100,00 | 0 | |||||
| 2025-07-11 | 13F | Arrow Investment Advisors, LLC | 0 | −100,00 | 0 | |||||
| 2025-08-13 | 13F | Everstar Asset Management, LLC | 52 969 | 3,63 | 2 552 | 9,06 | ||||
| 2025-08-04 | 13F | Spire Wealth Management | 679 | 0,44 | 33 | 6,67 | ||||
| 2025-08-11 | 13F | TD Waterhouse Canada Inc. | 95 087 | 36,68 | 4 611 | 44,97 | ||||
| 2025-07-08 | 13F | Nbc Securities, Inc. | 1 650 | 0,00 | 0 | |||||
| 2025-08-12 | 13F | NFP Retirement, Inc. | 114 808 | −0,43 | 5 530 | 4,77 | ||||
| 2025-07-30 | 13F | LGT Financial Advisors LLC | 500 | 0,00 | 24 | 9,09 | ||||
| 2025-08-13 | 13F | Brown Advisory Inc | 12 083 | −0,89 | 582 | 4,30 | ||||
| 2025-08-05 | 13F | American Capital Advisory, LLC | 1 358 | 0,00 | 65 | 4,84 | ||||
| 2025-08-12 | 13F | Jpmorgan Chase & Co | 39 665 | −2,71 | 1 911 | 2,36 | ||||
| 2025-08-08 | 13F | Pnc Financial Services Group, Inc. | 7 327 | 0,25 | 353 | 5,39 | ||||
| 2025-08-14 | 13F | GWM Advisors LLC | 6 379 | −17,26 | 307 | −12,78 | ||||
| 2025-08-15 | 13F | Captrust Financial Advisors | 10 417 | −25,54 | 502 | −21,72 | ||||
| 2025-08-19 | 13F | Advisory Services Network, LLC | 12 373 | 5,07 | 599 | 11,13 | ||||
| 2025-08-14 | 13F | Connecticut Wealth Management, LLC | 5 000 | −37,69 | 241 | −34,60 | ||||
| 2025-07-22 | 13F | Miracle Mile Advisors, LLC | 23 066 | −0,28 | 1 111 | 5,01 | ||||
| 2025-08-07 | 13F | Allworth Financial LP | 2 605 | 0,08 | 125 | 8,70 | ||||
| 2025-08-11 | 13F | CFS Investment Advisory Services, LLC | 20 403 | 10,38 | 1 | |||||
| 2025-08-05 | 13F | Tsfg, Llc | 1 213 | 0,41 | 0 | |||||
| 2025-08-14 | 13F | Royal Bank Of Canada | 121 712 | −1,18 | 5 863 | 3,97 | ||||
| 2025-07-25 | 13F | Cwm, Llc | 689 | 58,03 | 0 | |||||
| 2025-08-05 | 13F | Atlas Private Wealth Advisors | 97 911 | −10,93 | 4 716 | −6,28 | ||||
| 2025-07-28 | 13F | Harbour Investments, Inc. | 1 041 | 0,39 | 50 | 6,38 | ||||
| 2025-07-28 | 13F | Axxcess Wealth Management, Llc | 0 | −100,00 | 0 | |||||
| 2025-04-22 | 13F | Consolidated Planning Corp | 0 | −100,00 | 0 | |||||
| 2025-08-01 | 13F | Biltmore Family Office, LLC | 352 | 0,00 | 17 | 0,00 | ||||
| 2025-08-08 | 13F | Citizens Financial Group Inc/ri | 119 377 | −0,07 | 5 750 | 5,16 | ||||
| 2025-08-13 | 13F | Truvestments Capital Llc | 16 765 | 0,17 | 808 | 5,35 | ||||
| 2025-08-14 | 13F | Goldman Sachs Group Inc | 26 580 | 1 280 | ||||||
| 2025-08-14 | 13F | Fort Point Capital Partners LLC | 22 946 | 0,25 | 1 105 | 5,54 | ||||
| 2025-08-14 | 13F | Warren Averett Asset Management, LLC | 48 146 | −4,24 | 2 319 | 0,78 | ||||
| 2025-08-12 | 13F | LPL Financial LLC | 1 967 217 | 18,19 | 94 761 | 24,36 | ||||
| 2025-08-12 | 13F | Charles Schwab Investment Management Inc | 8 101 | −2,95 | 390 | 2,09 | ||||
| 2025-08-06 | 13F | Modera Wealth Management, LLC | 4 495 | 0,00 | 217 | 5,37 | ||||
| 2025-08-12 | 13F | MAI Capital Management | 38 309 | −0,79 | 1 845 | 4,41 | ||||
| 2025-08-13 | 13F | Jones Financial Companies Lllp | 139 855 | 27,00 | 6 678 | 33,88 | ||||
| 2025-08-14 | 13F | Integrated Wealth Concepts LLC | 4 646 | −9,86 | 224 | −5,11 | ||||
| 2025-04-22 | 13F/A | NorthRock Partners, LLC | 0 | −100,00 | 0 | −100,00 | ||||
| 2025-08-08 | 13F | Avantax Advisory Services, Inc. | 32 700 | −15,35 | 1 575 | −10,92 | ||||
| 2025-08-14 | 13F | Raymond James Financial Inc | 846 279 | 0,43 | 40 765 | 5,67 | ||||
| 2025-08-08 | 13F | Strategies Wealth Advisors, LLC | 23 454 | 0,06 | 1 130 | 5,22 | ||||
| 2025-07-17 | 13F | Janney Montgomery Scott LLC | 8 148 | 0,23 | 0 | |||||
| 2025-08-13 | 13F | Baird Financial Group, Inc. | 84 938 | −2,59 | 4 091 | 2,51 | ||||
| 2025-07-29 | 13F | Koshinski Asset Management, Inc. | 14 170 | 0,00 | 683 | 5,25 | ||||
| 2025-07-29 | 13F | Stratos Wealth Partners, LTD. | 11 888 | −45,74 | 573 | −42,97 | ||||
| 2025-08-06 | 13F | Golden State Wealth Management, LLC | 1 054 | −43,36 | 51 | −41,18 | ||||
| 2025-07-15 | 13F | Revisor Wealth Management LLC | 4 664 | 0,00 | 228 | 6,57 | ||||
| 2025-08-12 | 13F | Deutsche Bank Ag\ | 12 915 | 0,00 | 622 | 5,25 | ||||
| 2025-07-10 | 13F | Focus Financial Network, Inc. | 113 378 | 0,41 | 5 461 | 5,65 | ||||
| 2025-07-15 | 13F | Genesis Wealth Advisors, LLC | 0 | −100,00 | 0 | −100,00 | ||||
| 2025-08-14 | 13F | Ameriprise Financial Inc | 19 191 | −2,49 | 924 | 2,55 | ||||
| 2025-05-12 | 13F | Independent Advisor Alliance | 0 | −100,00 | 0 | |||||
| 2025-08-13 | 13F | Russell Investments Group, Ltd. | 179 | 952,94 | 9 | |||||
| 2025-07-29 | 13F | Financial Guidance Group, Inc. | 5 120 | 0,00 | 247 | 5,13 | ||||
| 2025-08-14 | 13F | Stifel Financial Corp | 9 441 | −51,61 | 455 | −49,16 |