Grundläggande statistik
| Institutionella ägare | 158 total, 157 long only, 0 short only, 1 long/short - change of 0,63% MRQ |
| Genomsnittlig portföljallokering | 0.2214 % - change of 17,39% MRQ |
| Institutionella aktier (lång) | 15 489 990 (ex 13D/G) - change of 2,55MM shares 19,69% MRQ |
| Institutionellt värde (lång) | $ 243 094 USD ($1000) |
Institutionellt ägande och aktieägare
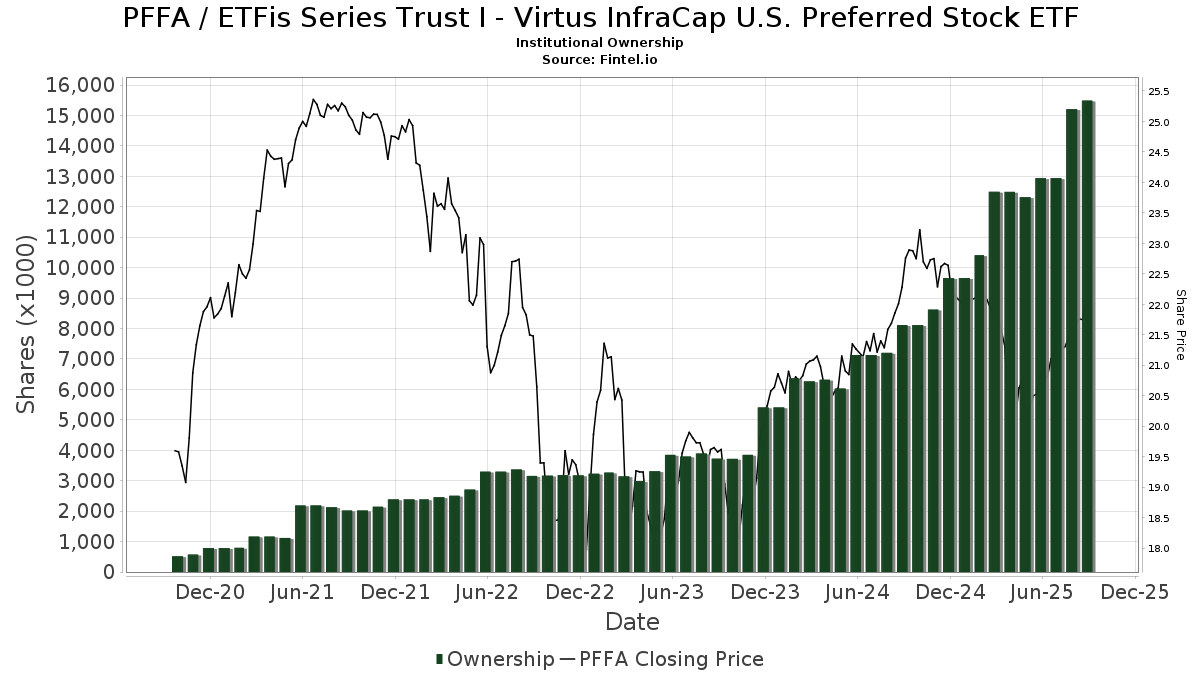
ETFis Series Trust I - Virtus InfraCap U.S. Preferred Stock ETF (US:PFFA) har 158 Institutionella ägare och aktieägare som har lämnat in 13D/G- eller 13F-formulär till Securities Exchange Commission (SEC). Dessa institut innehar totalt 15,489,990 aktier. Största aktieägare inkluderar LPL Financial LLC, Kingstone Capital Partners Texas, LLC, Royal Bank Of Canada, Cambridge Investment Research Advisors, Inc., Advisor Group Holdings, Inc., Mml Investors Services, Llc, Melia Wealth LLC, Steward Partners Investment Advisory, Llc, Anderson Financial Strategies, LLC, and Equitable Holdings, Inc. .
ETFis Series Trust I - Virtus InfraCap U.S. Preferred Stock ETF (ARCA:PFFA) Institutionell ägarstruktur visar institutioners och fonders nuvarande positioner i företaget, samt de senaste förändringarna i positionernas storlek. Större aktieägare kan vara enskilda investerare, fonder, hedgefonder eller institutioner. Bilaga 13D visar att investeraren äger (eller ägde) mer än 5% av företaget och avser (eller avsåg) att aktivt eftersträva en förändring av affärsstrategin. Schedule 13G indikerar en passiv investering på över 5%.
The share price as of September 10, 2025 is 22,17 / share. Previously, on September 11, 2024, the share price was 22,28 / share. This represents a decline of 0,49% over that period.
Fondsentimentets poäng
Fondsentimentet poängen(fka Ägarackumulation-poäng) visar vilka aktier som är mest köpta av fonder. Det är resultatet av en sofistikerad kvantitativ flerfaktormodell som identifierar företag med de högsta nivåerna av institutionell ackumulering. Poängsättningsmodellen använder en kombination av den totala ökningen av redovisade ägare, förändringarna i portföljallokeringarna för dessa ägare och andra mått. Siffran sträcker sig från 0 till 100, där högre siffror indikerar en högre nivå av ackumulering i förhållande till sina konkurrenter, och 50 är genomsnittet.
Uppdateringsfrekvens: Dagligen
Se Ownership Explorer, som innehåller en lista över de högst rankade företagen.
Institutionell sälj/köp-kvot
Förutom att rapportera vanliga eget kapital- och skuldemissioner måste institutioner med mer än 100MM tillgångar under förvaltning också avslöja sina innehav av sälj- och köpoptioner. Eftersom säljoptioner i allmänhet indikerar ett negativt sentiment och köpoptioner indikerar ett positivt sentiment, kan vi få en uppfattning om det övergripande institutionella sentimentet genom att plotta förhållandet mellan säljoptioner och köpoptioner. Diagrammet till höger visar det historiska förhållandet mellan sälj- och köpoptioner för detta instrument.
Genom att använda sälj/köp-kvoten som en indikator på aktieägarnas sentiment undviker man en av de största bristerna med att använda det totala institutionella ägandet, nämligen att en betydande del av de förvaltade tillgångarna investeras passivt för att följa index. Passivt förvaltade fonder köper vanligtvis inte optioner, så indikatorn för sälj/köp-kvoten ger en bättre bild av stämningen i aktivt förvaltade fonder.

13F- och NPORT-arkiveringar
Detaljer om 13F-arkiveringar är gratis. Detaljer om NP-arkiveringar kräver ett premiummedlemskap. Gröna rader indikerar nya positioner. Röda rader indikerar stängda positioner. Klicka på länk symbolen för att se hela transaktionshistoriken.
Uppgradera
för att låsa upp premiumdata och exportera till Excel ![]() .
.
| Fil Datum | Källa | Investerare | Typ | Genomsnittligt pris (beräknat) |
Aktier | Δ Aktier (%) |
Rapporterat värde (1000 USD) |
Δ Värde (%) |
Portföljallokering (%) |
|
|---|---|---|---|---|---|---|---|---|---|---|
| 2025-08-06 | 13F | Wsfs Capital Management, Llc | 17 074 | 12,81 | 356 | 10,59 | ||||
| 2025-08-07 | 13F | Samalin Investment Counsel, LLC | 94 062 | 5,61 | 1 959 | 3,71 | ||||
| 2025-08-19 | 13F | Cape Investment Advisory, Inc. | 800 | 0,00 | 17 | 0,00 | ||||
| 2025-08-14 | 13F | Hilltop Holdings Inc. | 15 730 | 14,36 | 328 | 12,37 | ||||
| 2025-08-14 | 13F | SWAN Capital LLC | 352 | 0,00 | 7 | 0,00 | ||||
| 2025-08-11 | 13F | TD Waterhouse Canada Inc. | 5 000 | 0,00 | 104 | −0,95 | ||||
| 2025-07-24 | 13F | Us Bancorp \de\ | 0 | −100,00 | 0 | |||||
| 2025-08-13 | 13F | Fiduciary Group LLC | 17 659 | 84,18 | 368 | 80,79 | ||||
| 2025-08-08 | 13F | Foundations Investment Advisors, LLC | 244 678 | −9,05 | 5 097 | −10,69 | ||||
| 2025-08-12 | 13F | Mcdonald Partners Llc | 20 000 | 0,00 | 417 | −1,89 | ||||
| 2025-05-15 | 13F | Bank Of America Corp /de/ | 0 | −100,00 | 0 | |||||
| 2025-07-31 | 13F | Cambridge Investment Research Advisors, Inc. | 768 888 | 53,11 | 16 | 60,00 | ||||
| 2025-07-21 | 13F | Hudson Valley Investment Advisors Inc /adv | 12 000 | 0,00 | 250 | −1,97 | ||||
| 2025-08-08 | 13F | Larson Financial Group LLC | 0 | −100,00 | 0 | |||||
| 2025-05-30 | NP | ERNZ - TrueShares Active Yield ETF | 62 152 | 1 318 | ||||||
| 2025-04-09 | 13F | American National Bank | 0 | −100,00 | 0 | |||||
| 2025-08-07 | 13F | Allworth Financial LP | 8 664 | 61 785,71 | 180 | |||||
| 2025-08-08 | 13F | Wiser Advisor Group LLC | 0 | −100,00 | 0 | |||||
| 2025-08-14 | 13F | Citadel Advisors Llc | 0 | −100,00 | 0 | |||||
| 2025-08-07 | 13F | Resources Investment Advisors, LLC. | 0 | −100,00 | 0 | |||||
| 2025-07-09 | 13F | Triumph Capital Management | 21 418 | 0,07 | 446 | −1,55 | ||||
| 2025-08-01 | 13F | Pasadena Private Wealth, LLC | 41 610 | −13,83 | 867 | −15,43 | ||||
| 2025-07-14 | 13F | AdvisorNet Financial, Inc | 160 155 | 38,70 | 3 336 | 36,22 | ||||
| 2025-04-24 | 13F | Wingate Wealth Advisors, Inc. | 0 | −100,00 | 0 | |||||
| 2025-07-22 | 13F | Wealthcare Advisory Partners LLC | 43 745 | 2,02 | 911 | 0,22 | ||||
| 2025-08-13 | 13F | WCG Wealth Advisors LLC | 10 608 | 1,25 | 221 | −0,90 | ||||
| 2025-07-24 | 13F | IFP Advisors, Inc | 1 777 | −23,70 | 37 | −24,49 | ||||
| 2025-07-18 | 13F | Founders Capital Management | 1 600 | 0,00 | 33 | 0,00 | ||||
| 2025-04-21 | 13F | Nelson, Van Denburg & Campbell Wealth Management Group, LLC | 0 | −100,00 | 0 | |||||
| 2025-05-07 | 13F | Inspire Advisors, LLC | 0 | −100,00 | 0 | |||||
| 2025-07-22 | 13F | Red Door Wealth Management, LLC | 11 508 | 2,48 | 240 | 0,42 | ||||
| 2025-08-14 | 13F | Stifel Financial Corp | 262 105 | 20,46 | 5 460 | 18,31 | ||||
| 2025-07-28 | 13F | Melia Wealth LLC | 447 265 | 9 317 | ||||||
| 2025-07-31 | 13F | Oppenheimer & Co Inc | 15 788 | 10,71 | 329 | 8,61 | ||||
| 2025-07-25 | 13F | Allspring Global Investments Holdings, LLC | 36 600 | 29,79 | 762 | 27,42 | ||||
| 2025-05-14 | 13F | Jane Street Group, Llc | 0 | −100,00 | 0 | |||||
| 2025-07-30 | 13F | Whittier Trust Co | 42 491 | 0,00 | 885 | −1,78 | ||||
| 2025-09-09 | 13F | NWF Advisory Services Inc. | 30 738 | 14,81 | 640 | 12,87 | ||||
| 2025-08-14 | 13F/A | Rockefeller Capital Management L.P. | 11 000 | −31,25 | 229 | −32,45 | ||||
| 2025-07-31 | 13F | Darden Wealth Group Inc | 22 907 | 4,11 | 477 | 2,36 | ||||
| 2025-08-12 | 13F | Jefferies Financial Group Inc. | 131 240 | −43,33 | 2 734 | −44,35 | ||||
| 2025-04-22 | 13F | Synergy Financial Management, LLC | 0 | −100,00 | 0 | |||||
| 2025-08-14 | 13F | Wells Fargo & Company/mn | 225 | 49,01 | 5 | 33,33 | ||||
| 2025-08-08 | 13F | Cetera Investment Advisers | 111 723 | 21,31 | 2 327 | 19,15 | ||||
| 2025-08-05 | 13F | Atlas Wealth Partners, LLC | 23 550 | 3,92 | 0 | |||||
| 2025-08-11 | 13F | AXS Investments LLC | 111 610 | −22,25 | 2 325 | −23,65 | ||||
| 2025-05-02 | 13F | James Investment Research Inc | 0 | −100,00 | 0 | |||||
| 2025-08-13 | 13F | EverSource Wealth Advisors, LLC | 3 000 | 50,00 | 62 | 47,62 | ||||
| 2025-07-31 | 13F | City State Bank | 225 | 0,00 | 5 | 0,00 | ||||
| 2025-05-15 | 13F | Hrt Financial Lp | 0 | −100,00 | 0 | |||||
| 2025-05-14 | 13F | Fisher Asset Management, LLC | 0 | −100,00 | 0 | −100,00 | ||||
| 2025-08-14 | 13F | Raymond James Financial Inc | 217 302 | 18,37 | 4 526 | 16,26 | ||||
| 2025-08-14 | 13F | Infrastructure Capital Advisors, Llc | 288 471 | −16,37 | 6 009 | −17,88 | ||||
| 2025-08-13 | 13F | Smith, Moore & Co. | 109 003 | 4,49 | 2 271 | 2,62 | ||||
| 2025-05-15 | 13F | Centaurus Financial, Inc. | 0 | −100,00 | 0 | |||||
| 2025-05-06 | 13F | Bank Julius Baer & Co. Ltd, Zurich | 0 | −100,00 | 0 | |||||
| 2025-08-06 | 13F | First Horizon Advisors, Inc. | 1 250 | 0,00 | 26 | 0,00 | ||||
| 2025-07-25 | 13F | Apollon Wealth Management, LLC | 33 611 | −7,76 | 700 | −9,33 | ||||
| 2025-08-14 | 13F | Royal Bank Of Canada | 919 558 | 0,63 | 19 155 | −1,17 | ||||
| 2025-07-30 | 13F | D.a. Davidson & Co. | 21 613 | 77,07 | 450 | 74,42 | ||||
| 2025-08-25 | NP | OIOIX - AXS Income Opportunities Fund Class I | 111 610 | −22,25 | 2 325 | −23,65 | ||||
| 2025-07-22 | 13F | Belpointe Asset Management LLC | 55 759 | −11,41 | 1 161 | −13,03 | ||||
| 2025-08-13 | 13F | Capital Analysts, Inc. | 93 658 | 9,35 | 2 | 0,00 | ||||
| 2025-08-13 | 13F | Empire Financial Management Company, LLC | 51 933 | 2,38 | 1 082 | 0,56 | ||||
| 2025-07-28 | 13F | Harbour Investments, Inc. | 5 321 | −11,80 | 111 | −13,39 | ||||
| 2025-08-04 | 13F | Bay Colony Advisory Group, Inc d/b/a Bay Colony Advisors | 13 313 | 0,20 | 277 | −2,12 | ||||
| 2025-04-30 | 13F | Sofos Investments, Inc. | 72 555 | 1 539 | ||||||
| 2025-07-18 | 13F | Truist Financial Corp | 15 493 | 4,59 | 323 | 2,55 | ||||
| 2025-07-22 | 13F | Fortitude Advisory Group L.L.C. | 10 302 | 0,00 | 215 | 4,39 | ||||
| 2025-07-22 | 13F | Chung Wu Investment Group, LLC | 44 240 | −34,69 | 922 | −35,86 | ||||
| 2025-04-28 | 13F | Clear Creek Financial Management, LLC | 0 | −100,00 | 0 | |||||
| 2025-07-10 | 13F | Secure Asset Management, LLC | 85 729 | −53,20 | 1 786 | −54,05 | ||||
| 2025-07-08 | 13F | Parallel Advisors, LLC | 128 | 0,00 | 3 | 0,00 | ||||
| 2025-05-16 | 13F | Empowered Funds, LLC | 0 | −100,00 | 0 | |||||
| 2025-05-15 | 13F/A | Orion Portfolio Solutions, LLC | 22 377 | −3,37 | 475 | −6,51 | ||||
| 2025-07-29 | 13F | Stratos Wealth Partners, LTD. | 9 819 | 2,21 | 205 | 0,49 | ||||
| 2025-07-21 | 13F | West Financial Advisors, LLC | 26 | 4,00 | 1 | |||||
| 2025-07-25 | 13F | Almanack Investment Partners, LLC. | 10 641 | 12,71 | 222 | 10,50 | ||||
| 2025-07-14 | 13F | U.S. Capital Wealth Advisors, LLC | 0 | −100,00 | 0 | |||||
| 2025-08-05 | 13F | Simplex Trading, Llc | 0 | −100,00 | 0 | |||||
| 2025-08-12 | 13F | Proequities, Inc. | 0 | 0 | ||||||
| 2025-05-08 | 13F | Main Street Financial Solutions, LLC | 0 | −100,00 | 0 | |||||
| 2025-08-15 | 13F | Morgan Stanley | 8 717 | −26,65 | 182 | −28,17 | ||||
| 2025-08-11 | 13F | Anderson Financial Strategies, LLC | 319 880 | 3,33 | 6 663 | 1,49 | ||||
| 2025-08-08 | 13F | Kingsview Wealth Management, LLC | 31 200 | −16,42 | 650 | −17,95 | ||||
| 2025-07-24 | 13F | Wealthstar Advisors, Llc | 58 023 | 4,65 | 1 209 | 2,81 | ||||
| 2025-08-15 | 13F | Prevail Innovative Wealth Advisors, Llc | 225 178 | 1,83 | 4 690 | 0,00 | ||||
| 2025-07-21 | 13F | Ameriflex Group, Inc. | 300 | −2,28 | 6 | 0,00 | ||||
| 2025-08-14 | 13F | Integrated Wealth Concepts LLC | 26 029 | 542 | ||||||
| 2025-07-21 | 13F | Seros Financial, LLC | 30 067 | 0,00 | 626 | −1,73 | ||||
| 2025-07-24 | 13F | Robertson Stephens Wealth Management, LLC | 0 | −100,00 | 0 | |||||
| 2025-08-06 | 13F | Black Swift Group, LLC | 174 240 | −3,94 | 3 629 | −5,67 | ||||
| 2025-07-29 | 13F | Private Trust Co Na | 15 157 | 0,00 | 316 | −1,87 | ||||
| 2025-08-07 | 13F | Montag A & Associates Inc | 4 054 | 0,00 | 84 | −1,18 | ||||
| 2025-07-22 | 13F | DAVENPORT & Co LLC | 72 610 | 18,98 | 1 512 | 16,85 | ||||
| 2025-08-05 | 13F | Huntington National Bank | 0 | |||||||
| 2025-08-14 | 13F | GWM Advisors LLC | 8 297 | 0,10 | 173 | −1,71 | ||||
| 2025-08-19 | 13F | Newbridge Financial Services Group, Inc. | 89 624 | −2,67 | 1 867 | −4,41 | ||||
| 2025-05-15 | 13F | Talon Private Wealth, LLC | 0 | −100,00 | 0 | −100,00 | ||||
| 2025-07-15 | 13F | Sheets Smith Wealth Management | 95 081 | 0,13 | 1 981 | −1,64 | ||||
| 2025-07-23 | 13F | Abel Hall, LLC | 37 553 | 275,53 | 782 | 268,87 | ||||
| 2025-07-07 | 13F | Roxbury Financial LLC | 1 046 | 0,00 | 22 | −8,70 | ||||
| 2025-07-11 | 13F | Farther Finance Advisors, LLC | 2 | −99,81 | 0 | −100,00 | ||||
| 2025-08-11 | 13F | Principal Securities, Inc. | 706 | −79,80 | 15 | −81,58 | ||||
| 2025-08-11 | 13F | HighTower Advisors, LLC | 65 732 | 10,54 | 1 369 | 8,56 | ||||
| 2025-07-18 | 13F | Consolidated Portfolio Review Corp | 0 | −100,00 | 0 | |||||
| 2025-08-14 | 13F | Aqr Capital Management Llc | 25 947 | −45,89 | 540 | −46,85 | ||||
| 2025-08-18 | 13F | Geneos Wealth Management Inc. | 1 803 | 38,37 | 38 | 37,04 | ||||
| 2025-08-13 | 13F | Level Four Advisory Services, Llc | 33 625 | −16,94 | 700 | −18,41 | ||||
| 2025-08-15 | 13F | Equitable Holdings, Inc. | 305 004 | 6,85 | 6 353 | 4,94 | ||||
| 2025-08-12 | 13F | MAI Capital Management | 213 | −90,35 | 4 | −91,30 | ||||
| 2025-08-06 | 13F | Prospera Financial Services Inc | 32 153 | 155,45 | 670 | 151,50 | ||||
| 2025-08-12 | 13F | Archer Investment Corp | 56 | 1,82 | 1 | 0,00 | ||||
| 2025-08-04 | 13F | IFG Advisory, LLC | 17 054 | −20,65 | 355 | −21,98 | ||||
| 2025-05-16 | 13F | Jones Financial Companies Lllp | 0 | −100,00 | 0 | |||||
| 2025-08-04 | 13F | Assetmark, Inc | 524 | 25,06 | 11 | 25,00 | ||||
| 2025-08-04 | 13F | Creekmur Asset Management LLC | 109 | 1,87 | 2 | 0,00 | ||||
| 2025-08-11 | 13F | Strategic Wealth Partners, Ltd. | 277 | 6 | ||||||
| 2025-08-12 | 13F | Global Retirement Partners, LLC | 118 912 | −33,53 | 2 477 | −36,79 | ||||
| 2025-07-11 | 13F | Caldwell Securities, Inc | 1 100 | 0,00 | 23 | −4,35 | ||||
| 2025-07-25 | 13F | Atria Wealth Solutions, Inc. | 35 086 | 732 | ||||||
| 2025-08-13 | 13F | Virtus ETF Advisers LLC | 170 | 4 | ||||||
| 2025-08-11 | 13F | Aptus Capital Advisors, LLC | 200 | 0,00 | 4 | 0,00 | ||||
| 2025-08-27 | 13F/A | Brinker Capital Investments, LLC | 32 865 | 46,87 | 685 | 44,30 | ||||
| 2025-07-10 | 13F | Wealth Enhancement Advisory Services, Llc | 25 764 | 1,22 | 542 | 0,56 | ||||
| 2025-05-14 | 13F | Flow Traders U.s. Llc | 0 | −100,00 | 0 | |||||
| 2025-07-11 | 13F | Kingstone Capital Partners Texas, LLC | 2 068 539 | 45 | ||||||
| 2025-08-28 | NP | Northern Lights Fund Trust - Sierra Tactical Risk Spectrum 30 Fund Instl Class | 155 200 | 802,33 | 3 233 | 724,49 | ||||
| 2025-08-01 | 13F | Brookwood Investment Group LLC | 22 961 | 33,94 | 478 | 31,68 | ||||
| 2025-08-06 | 13F | Rps Advisory Solutions Llc | 10 178 | 5,17 | 212 | 3,41 | ||||
| 2025-08-19 | 13F | National Asset Management, Inc. | 42 306 | 2,33 | 881 | −2,65 | ||||
| 2025-08-12 | 13F | Cumberland Partners Ltd | 12 700 | 265 | ||||||
| 2025-08-12 | 13F | CIBC Private Wealth Group, LLC | 0 | −100,00 | 0 | |||||
| 2025-08-12 | 13F | LPL Financial LLC | 2 452 132 | −3,80 | 51 078 | −5,53 | ||||
| 2025-08-05 | 13F | Bank of New York Mellon Corp | 14 467 | 301 | ||||||
| 2025-08-06 | 13F | Commonwealth Equity Services, Llc | 198 108 | 71,61 | 4 | 100,00 | ||||
| 2025-07-24 | 13F | Cascade Investment Group, Inc. | 17 100 | 356 | ||||||
| 2025-07-29 | 13F | TrueMark Investments, LLC | 0 | −100,00 | 0 | |||||
| 2025-05-15 | 13F | Activest Wealth Management | 0 | −100,00 | 0 | −100,00 | ||||
| 2025-08-14 | 13F | Mml Investors Services, Llc | 658 797 | 3,36 | 14 | 0,00 | ||||
| 2025-08-04 | 13F | HBK Sorce Advisory LLC | 0 | −100,00 | 0 | |||||
| 2025-07-16 | 13F | Signaturefd, Llc | 6 100 | 0,03 | 127 | −1,55 | ||||
| 2025-08-14 | 13F | Matrix Private Capital Group Llc | 11 800 | 0,00 | 246 | −2,00 | ||||
| 2025-07-07 | 13F | Thurston, Springer, Miller, Herd & Titak, Inc. | 1 100 | 0,00 | 23 | −4,35 | ||||
| 2025-08-12 | 13F | J.w. Cole Advisors, Inc. | 72 593 | 5,92 | 1 512 | 4,06 | ||||
| 2025-08-08 | 13F | Financial Gravity Companies, Inc. | 83 333 | 9,01 | 1 736 | 3,64 | ||||
| 2025-08-28 | NP | Northern Lights Fund Trust - Sierra Tactical Risk Spectrum 70 Fund Investor Class | 31 500 | 9,04 | 656 | −0,46 | ||||
| 2025-08-11 | 13F | Private Advisor Group, LLC | 55 178 | 71,11 | 1 149 | 68,23 | ||||
| 2025-07-21 | 13F | DHJJ Financial Advisors, Ltd. | 32 | 0,00 | 1 | |||||
| 2025-08-11 | 13F | Anfield Capital Management, LLC | 5 352 | 2,76 | 111 | 0,91 | ||||
| 2025-07-30 | 13F | Jackson Thornton Asset Management, Llc | 25 947 | −45,89 | 550 | −43,11 | ||||
| 2025-08-15 | 13F | Tower Research Capital LLC (TRC) | 481 | 10 | ||||||
| 2025-08-14 | 13F | UBS Group AG | 1 | −99,70 | 0 | −100,00 | ||||
| 2025-04-29 | 13F | Raleigh Capital Management Inc. | 0 | −100,00 | 0 | |||||
| 2025-08-14 | 13F | Bnp Paribas Arbitrage, Sa | 177 | 2 850,00 | 4 | |||||
| 2025-08-13 | 13F | Lido Advisors, LLC | 133 975 | 1,54 | 2 791 | −0,29 | ||||
| 2025-07-23 | 13F | Venturi Wealth Management, LLC | 11 217 | 234 | ||||||
| 2025-07-21 | 13F | Future Financial Wealth Managment LLC | 152 691 | 22,72 | 3 181 | 20,50 | ||||
| 2025-08-15 | 13F | Kestra Advisory Services, LLC | 130 781 | 6,52 | 2 724 | 4,61 | ||||
| 2025-08-14 | 13F | Arete Wealth Advisors, LLC | 11 094 | −81,62 | 0 | −100,00 | ||||
| 2025-07-15 | 13F | World Equity Group, Inc. | 51 808 | 7,70 | 1 079 | 5,78 | ||||
| 2025-08-14 | 13F | Ausdal Financial Partners, Inc. | 17 208 | 5,25 | 358 | 3,47 | ||||
| 2025-08-01 | 13F | Gwn Securities Inc. | 17 410 | −87,01 | 363 | −86,94 | ||||
| 2025-05-14 | 13F | Truvestments Capital Llc | 0 | −100,00 | 0 | |||||
| 2025-04-25 | 13F | New Wave Wealth Advisors Llc | 0 | −100,00 | 0 | |||||
| 2025-08-12 | 13F | Steward Partners Investment Advisory, Llc | 386 094 | 5,83 | 8 042 | 3,93 | ||||
| 2025-08-14 | 13F | TT Capital Management LLC | 32 700 | 672 | ||||||
| 2025-08-08 | 13F | Pnc Financial Services Group, Inc. | 900 | 0,00 | 19 | −5,26 | ||||
| 2025-08-14 | 13F | Fmr Llc | 71 | 1 | ||||||
| 2025-08-18 | 13F/A | National Bank Of Canada /fi/ | 2 801 | 0,00 | 58 | −1,69 | ||||
| 2025-09-04 | 13F/A | Advisor Group Holdings, Inc. | 734 144 | 7,16 | 15 294 | 5,24 | ||||
| 2025-07-22 | 13F | Beacon Financial Advisory LLC | 25 295 | 7,46 | 527 | 5,41 | ||||
| 2025-08-12 | 13F | AlphaCore Capital LLC | 0 | −100,00 | 0 | |||||
| 2025-07-17 | 13F | Sound Income Strategies, LLC | 244 932 | 0,20 | 5 102 | −1,60 | ||||
| 2025-04-30 | 13F | TradeWell Securities, LLC. | 41 661 | 14,97 | 884 | 11,35 | ||||
| 2025-04-28 | 13F | Strategic Financial Concepts, LLC | 0 | −100,00 | 0 | −100,00 | ||||
| 2025-05-06 | 13F | Avantax Advisory Services, Inc. | 0 | −100,00 | 0 | −100,00 | ||||
| 2025-08-04 | 13F | Spire Wealth Management | 2 993 | 0,00 | 62 | −1,59 | ||||
| 2025-04-17 | 13F | Janney Montgomery Scott LLC | 0 | −100,00 | 0 | |||||
| 2025-07-31 | 13F/A | Avion Wealth | 100 | 0,00 | 0 | |||||
| 2025-08-19 | 13F | Advisory Services Network, LLC | 52 804 | −61,66 | 1 133 | −61,23 | ||||
| 2025-08-12 | 13F | BlackRock, Inc. | 893 | 0,00 | 19 | 0,00 | ||||
| 2025-07-18 | 13F | PFG Investments, LLC | 30 891 | 10,62 | 643 | 8,61 | ||||
| 2025-08-04 | 13F | Roble, Belko & Company, Inc | 142 | 2,90 | 0 | |||||
| 2025-07-11 | 13F | Great Waters Wealth Management | 10 000 | 0,00 | 208 | −1,89 | ||||
| 2025-08-04 | 13F | Integrity Alliance, Llc. | 0 | −100,00 | 0 | |||||
| 2025-08-06 | 13F | Aspect Partners, LLC | 1 050 | 2,44 | 22 | 0,00 | ||||
| 2025-08-14 | 13F | Comerica Bank | 15 029 | 15,09 | 313 | 13,41 | ||||
| 2025-08-13 | 13F | Northwestern Mutual Wealth Management Co | 0 | −100,00 | 0 | |||||
| 2025-04-25 | 13F | Albion Financial Group /ut | 0 | −100,00 | 0 | |||||
| 2025-07-16 | 13F | Magnus Financial Group LLC | 20 813 | 6,19 | 434 | 4,34 | ||||
| 2025-08-14 | 13F | Susquehanna International Group, Llp | 38 572 | 803 | ||||||
| 2025-07-08 | 13F | Webster Bank, N. A. | 3 472 | 0,00 | 72 | −1,37 | ||||
| 2025-08-14 | 13F | Mariner, LLC | 47 727 | 25,05 | 994 | 22,87 | ||||
| 2025-07-28 | 13F | RFG Advisory, LLC | 44 323 | −63,21 | 923 | −63,87 | ||||
| 2025-07-25 | 13F | Cwm, Llc | 2 723 | −3,10 | 0 | |||||
| 2025-08-01 | 13F | Envestnet Asset Management Inc | 226 794 | 39,03 | 4 724 | 36,57 | ||||
| 2025-08-12 | 13F | Jpmorgan Chase & Co | 152 | −19,58 | 3 | −25,00 | ||||
| 2025-08-14 | 13F | Citadel Advisors Llc | Put | 16 300 | −34,01 | 340 | −35,18 | |||
| 2025-08-28 | NP | Northern Lights Fund Trust - Sierra Tactical Risk Spectrum 50 Fund Investor Class | 139 200 | −18,45 | 2 900 | −25,61 | ||||
| 2025-08-14 | 13F | Citadel Advisors Llc | Call | 53 300 | −13,75 | 1 110 | −15,27 | |||
| 2025-08-18 | 13F | Tactive Advisors, LLC | 13 431 | 280 |