Grundläggande statistik
| Institutionella ägare | 210 total, 210 long only, 0 short only, 0 long/short - change of 0,48% MRQ |
| Genomsnittlig portföljallokering | 0.2352 % - change of −3,63% MRQ |
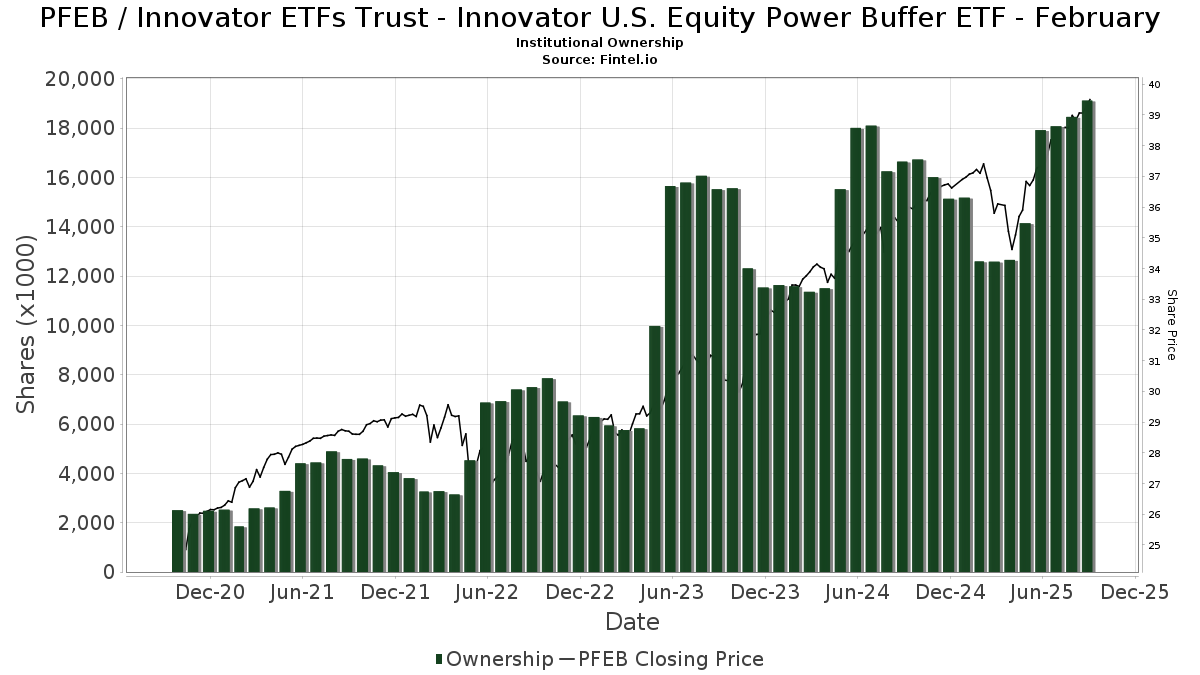
| Institutionella aktier (lång) | 19 117 201 (ex 13D/G) - change of 1,20MM shares 6,68% MRQ |
| Institutionellt värde (lång) | $ 602 667 USD ($1000) |
Institutionellt ägande och aktieägare
Innovator ETFs Trust - Innovator U.S. Equity Power Buffer ETF - February (US:PFEB) har 210 Institutionella ägare och aktieägare som har lämnat in 13D/G- eller 13F-formulär till Securities Exchange Commission (SEC). Dessa institut innehar totalt 19,117,201 aktier. Största aktieägare inkluderar Alliancebernstein L.p., Penserra Capital Management LLC, Innovator ETFs Trust - Innovator Laddered Fund of U.S. Equity Power Buffer ETFs, Commonwealth Equity Services, Llc, Advisor Group Holdings, Inc., Brookstone Capital Management, Old Mission Capital Llc, Wealth Enhancement Advisory Services, Llc, Raymond James Financial Inc, and Kovitz Investment Group Partners, LLC .
Innovator ETFs Trust - Innovator U.S. Equity Power Buffer ETF - February (BATS:PFEB) Institutionell ägarstruktur visar institutioners och fonders nuvarande positioner i företaget, samt de senaste förändringarna i positionernas storlek. Större aktieägare kan vara enskilda investerare, fonder, hedgefonder eller institutioner. Bilaga 13D visar att investeraren äger (eller ägde) mer än 5% av företaget och avser (eller avsåg) att aktivt eftersträva en förändring av affärsstrategin. Schedule 13G indikerar en passiv investering på över 5%.
The share price as of September 9, 2025 is 39,24 / share. Previously, on September 10, 2024, the share price was 35,50 / share. This represents an increase of 10,52% over that period.
Fondsentimentets poäng
Fondsentimentet poängen(fka Ägarackumulation-poäng) visar vilka aktier som är mest köpta av fonder. Det är resultatet av en sofistikerad kvantitativ flerfaktormodell som identifierar företag med de högsta nivåerna av institutionell ackumulering. Poängsättningsmodellen använder en kombination av den totala ökningen av redovisade ägare, förändringarna i portföljallokeringarna för dessa ägare och andra mått. Siffran sträcker sig från 0 till 100, där högre siffror indikerar en högre nivå av ackumulering i förhållande till sina konkurrenter, och 50 är genomsnittet.
Uppdateringsfrekvens: Dagligen
Se Ownership Explorer, som innehåller en lista över de högst rankade företagen.
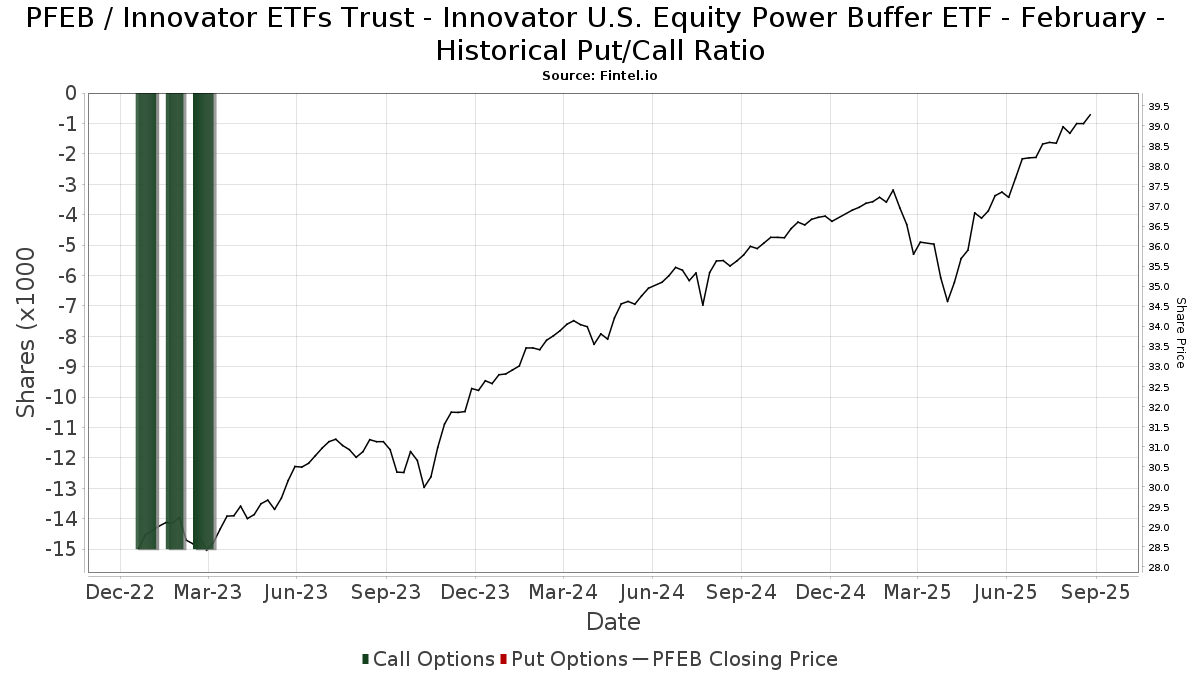
Institutionell sälj/köp-kvot
Förutom att rapportera vanliga eget kapital- och skuldemissioner måste institutioner med mer än 100MM tillgångar under förvaltning också avslöja sina innehav av sälj- och köpoptioner. Eftersom säljoptioner i allmänhet indikerar ett negativt sentiment och köpoptioner indikerar ett positivt sentiment, kan vi få en uppfattning om det övergripande institutionella sentimentet genom att plotta förhållandet mellan säljoptioner och köpoptioner. Diagrammet till höger visar det historiska förhållandet mellan sälj- och köpoptioner för detta instrument.
Genom att använda sälj/köp-kvoten som en indikator på aktieägarnas sentiment undviker man en av de största bristerna med att använda det totala institutionella ägandet, nämligen att en betydande del av de förvaltade tillgångarna investeras passivt för att följa index. Passivt förvaltade fonder köper vanligtvis inte optioner, så indikatorn för sälj/köp-kvoten ger en bättre bild av stämningen i aktivt förvaltade fonder.
13F- och NPORT-arkiveringar
Detaljer om 13F-arkiveringar är gratis. Detaljer om NP-arkiveringar kräver ett premiummedlemskap. Gröna rader indikerar nya positioner. Röda rader indikerar stängda positioner. Klicka på länk symbolen för att se hela transaktionshistoriken.
Uppgradera
för att låsa upp premiumdata och exportera till Excel ![]() .
.
| Fil Datum | Källa | Investerare | Typ | Genomsnittligt pris (beräknat) |
Aktier | Δ Aktier (%) |
Rapporterat värde (1000 USD) |
Δ Värde (%) |
Portföljallokering (%) |
|
|---|---|---|---|---|---|---|---|---|---|---|
| 2025-08-14 | 13F | Helium Advisors LLC | 15 335 | 0,00 | 583 | 6,01 | ||||
| 2025-07-30 | 13F | Strategic Blueprint, LLC | 10 239 | −5,19 | 389 | 0,78 | ||||
| 2025-08-06 | 13F | AE Wealth Management LLC | 114 685 | −74,88 | 4 359 | −73,34 | ||||
| 2025-08-14 | 13F | Apriem Advisors | 9 150 | 0,00 | 348 | 6,12 | ||||
| 2025-07-22 | 13F | Merit Financial Group, LLC | 6 529 | 248 | ||||||
| 2025-07-25 | 13F | Apollon Wealth Management, LLC | 23 500 | 0,00 | 893 | 6,18 | ||||
| 2025-08-14 | 13F | Visionary Wealth Advisors | 45 088 | −12,37 | 1 714 | −7,05 | ||||
| 2025-05-07 | 13F | HB Wealth Management, LLC | 0 | −100,00 | 0 | −100,00 | ||||
| 2025-08-06 | 13F | Penserra Capital Management LLC | 1 542 531 | 16,39 | 59 | 23,40 | ||||
| 2025-07-23 | 13F | Prasad Wealth Partners, LLC | 6 730 | 0,00 | 256 | 5,81 | ||||
| 2025-08-14 | 13F | Ausdal Financial Partners, Inc. | 10 527 | 0,00 | 400 | 6,10 | ||||
| 2025-08-11 | 13F | Summit Wealth Partners, LLC | 9 496 | −4,86 | 361 | 0,84 | ||||
| 2025-07-23 | 13F | Valmark Advisers, Inc. | 24 777 | −2,08 | 942 | 3,86 | ||||
| 2025-05-15 | 13F | Bank Of America Corp /de/ | 0 | −100,00 | 0 | |||||
| 2025-08-14 | 13F | Ambassador Advisors, LLC | 8 665 | −0,63 | 329 | 5,45 | ||||
| 2025-08-14 | 13F | Wells Fargo & Company/mn | 599 | 0,00 | 23 | 4,76 | ||||
| 2025-07-11 | 13F | SILVER OAK SECURITIES, Inc | 11 214 | −2,91 | 426 | 3,15 | ||||
| 2025-08-14 | 13F | Jane Street Group, Llc | 0 | −100,00 | 0 | |||||
| 2025-07-16 | 13F | NovaPoint Capital, LLC | 0 | −100,00 | 0 | |||||
| 2025-08-13 | 13F | BCJ Capital Management, LLC | 28 112 | −41,93 | 1 069 | −38,41 | ||||
| 2025-07-31 | 13F | Gill Capital Partners, Llc | 87 762 | 1,43 | 3 336 | 7,62 | ||||
| 2025-08-05 | 13F | Smith Shellnut Wilson Llc /adv | 8 712 | 0,00 | 331 | 6,09 | ||||
| 2025-08-11 | 13F | Blue Bell Private Wealth Management, Llc | 56 036 | −0,38 | 2 130 | 5,71 | ||||
| 2025-05-15 | 13F | CAPROCK Group, Inc. | 325 964 | 11 676 | ||||||
| 2025-08-01 | 13F | Gwn Securities Inc. | 0 | −100,00 | 0 | |||||
| 2025-08-11 | 13F | Annis Gardner Whiting Capital Advisors, LLC | 1 300 | 49 | ||||||
| 2025-07-25 | 13F | Cwm, Llc | 15 250 | −7,12 | 1 | |||||
| 2025-08-14 | 13F | Vista Investment Management | 6 092 | 0,00 | 232 | 5,96 | ||||
| 2025-07-25 | 13F | Atria Wealth Solutions, Inc. | 32 871 | 5,24 | 1 250 | 11,81 | ||||
| 2025-08-14 | 13F | CoreCap Advisors, LLC | 144 089 | 63,94 | 5 477 | 73,95 | ||||
| 2025-08-08 | 13F | Thoroughbred Financial Services, Llc | 10 000 | 0,00 | 0 | |||||
| 2025-08-12 | 13F | Steward Partners Investment Advisory, Llc | 120 | 0,00 | 5 | 0,00 | ||||
| 2025-08-06 | 13F | Valtinson Bruner Financial Planning LLC | 14 221 | −5,93 | 541 | −0,18 | ||||
| 2025-07-31 | 13F | Optimum Investment Advisors | 115 | 0,00 | 4 | 0,00 | ||||
| 2025-08-07 | 13F | PFG Advisors | 6 617 | −1,72 | 252 | 4,15 | ||||
| 2025-07-29 | 13F | Stephens Inc /ar/ | 90 970 | −3,27 | 3 458 | 2,64 | ||||
| 2025-07-08 | 13F | Nbc Securities, Inc. | 450 | 0,00 | 0 | |||||
| 2025-07-28 | 13F | Cypress Wealth Services, LLC | 0 | −100,00 | 0 | |||||
| 2025-08-08 | 13F | Avantax Advisory Services, Inc. | 33 290 | −3,39 | 1 265 | 2,51 | ||||
| 2025-07-29 | 13F | AssuredPartners Investment Advisors, LLC | 6 894 | −66,68 | 262 | −64,64 | ||||
| 2025-08-12 | 13F | Ascent Wealth Partners, LLC | 86 670 | 24,96 | 3 294 | 32,61 | ||||
| 2025-08-14 | 13F | Royal Bank Of Canada | 0 | −100,00 | 0 | |||||
| 2025-08-12 | 13F | Jacobi Capital Management LLC | 12 529 | 0,00 | 476 | 6,25 | ||||
| 2025-08-11 | 13F | Nations Financial Group Inc, /ia/ /adv | 34 531 | 0,54 | 1 313 | 6,67 | ||||
| 2025-07-31 | 13F | Brinker Capital Investments, LLC | 0 | −100,00 | 0 | −100,00 | ||||
| 2025-07-23 | 13F | Kingswood Wealth Advisors, Llc | 8 311 | 0,00 | 316 | 6,06 | ||||
| 2025-08-12 | 13F | Proequities, Inc. | 0 | 0 | ||||||
| 2025-07-31 | 13F | FSR Wealth Management Ltd. | 0 | −100,00 | 0 | |||||
| 2025-08-14 | 13F | Financial Network Wealth Advisors LLC | 3 077 | 0,00 | 117 | 5,45 | ||||
| 2025-07-22 | 13F | Global Strategic Investment Solutions, LLC | 38 476 | 0,00 | 1 462 | 6,10 | ||||
| 2025-08-01 | 13F | Advisory Alpha, LLC | 104 928 | 63,34 | 3 988 | 73,32 | ||||
| 2025-08-05 | 13F | C2P Capital Advisory Group, LLC d.b.a. Prosperity Capital Advisors | 7 999 | 0,00 | 304 | 5,92 | ||||
| 2025-05-15 | 13F | Citadel Advisors Llc | 0 | −100,00 | 0 | |||||
| 2025-07-24 | 13F | Weaver Capital Management LLC | 42 475 | 0,00 | 1 614 | 6,11 | ||||
| 2025-07-10 | 13F | Signal Advisors Wealth, LLC | 8 261 | 314 | ||||||
| 2025-08-12 | 13F | Park Square Financial Group, LLC | 0 | −100,00 | 0 | |||||
| 2025-04-10 | 13F | Sugar Maple Asset Management, LLC | 0 | −100,00 | 0 | |||||
| 2025-07-02 | 13F | McAlister, Sweet & Associates, Inc. | 81 632 | 0,42 | 3 103 | 6,56 | ||||
| 2025-05-15 | 13F | Two Sigma Securities, Llc | 0 | −100,00 | 0 | −100,00 | ||||
| 2025-08-07 | 13F | Investment Management Corp /va/ /adv | 1 600 | 0,00 | 61 | 5,26 | ||||
| 2025-07-18 | 13F | Foundry Financial Group, Inc. | 13 658 | 0,00 | 519 | 6,13 | ||||
| 2025-08-12 | 13F | Waterloo Capital, L.P. | 7 637 | 0,00 | 290 | 6,23 | ||||
| 2025-07-09 | 13F | Keystone Wealth Services, LLC | 24 483 | 12,33 | 931 | 19,23 | ||||
| 2025-05-02 | 13F | Capital A Wealth Management, LLC | 25 | 1 | ||||||
| 2025-08-12 | 13F | Leigh Baldwin & Co., Llc | 10 200 | −10,53 | 388 | −5,15 | ||||
| 2025-08-06 | 13F | Commonwealth Equity Services, Llc | 1 157 385 | 1,83 | 44 | 7,50 | ||||
| 2025-07-11 | 13F | Cypress Financial Planning Llc | 11 253 | 2,56 | 428 | 8,65 | ||||
| 2025-06-24 | NP | Innovator ETFs Trust - Innovator Laddered Fund of U.S. Equity Power Buffer ETFs | 1 347 819 | 13,00 | 48 104 | 8,65 | ||||
| 2025-07-18 | 13F | Truist Financial Corp | 92 903 | −1,58 | 3 531 | 4,44 | ||||
| 2025-07-21 | 13F | DHJJ Financial Advisors, Ltd. | 17 329 | −0,77 | 659 | 5,28 | ||||
| 2025-07-31 | 13F | Orion Capital Management LLC | 22 097 | −4,33 | 840 | 1,45 | ||||
| 2025-08-11 | 13F | Atlantic Private Wealth, LLC | 4 006 | 152 | ||||||
| 2025-07-10 | 13F | Family Legacy Financial Solutions, LLC | 700 | 27 | ||||||
| 2025-08-14 | 13F | Susquehanna International Group, Llp | 7 268 | −78,72 | 276 | −77,43 | ||||
| 2025-08-14 | 13F | Raymond James Financial Inc | 378 339 | −4,31 | 14 381 | 1,54 | ||||
| 2025-08-05 | 13F | Milestone Asset Management, Llc | 5 816 | 0,00 | 221 | 6,25 | ||||
| 2025-08-14 | 13F | Talon Private Wealth, LLC | 50 874 | −7,04 | 1 934 | −1,38 | ||||
| 2025-07-17 | 13F | City Holding Co | 700 | 0,00 | 27 | 4,00 | ||||
| 2025-08-06 | 13F | Atlantic Union Bankshares Corp | 5 384 | 205 | ||||||
| 2025-08-04 | 13F | JDM Financial Group LLC | 48 466 | −1,27 | 1 842 | 4,78 | ||||
| 2025-07-25 | 13F | Yarger Wealth Strategies, Llc | 75 017 | −11,44 | 2 851 | −6,03 | ||||
| 2025-07-29 | 13F | Madison Wealth Partners, Inc | 6 319 | 0,00 | 240 | 6,19 | ||||
| 2025-07-10 | 13F | Wealth Enhancement Advisory Services, Llc | 394 589 | −6,95 | 15 081 | −0,71 | ||||
| 2025-05-01 | 13F | Quest 10 Wealth Builders, Inc. | 5 774 | −34,96 | 207 | −36,81 | ||||
| 2025-08-05 | 13F | Lord & Richards Wealth Management, LLC | 0 | −100,00 | 0 | |||||
| 2025-07-28 | 13F | WealthPlan Investment Management, LLC | 10 880 | −18,82 | 414 | −13,96 | ||||
| 2025-08-12 | 13F | Bedel Financial Consulting, Inc. | 17 736 | 0,00 | 674 | 6,14 | ||||
| 2025-08-19 | 13F | Cape Investment Advisory, Inc. | 25 400 | −1,93 | 965 | 4,10 | ||||
| 2025-08-14 | 13F | Mml Investors Services, Llc | 72 669 | 4,98 | 3 | 0,00 | ||||
| 2025-07-10 | 13F | Focus Financial Network, Inc. | 16 137 | −17,63 | 613 | −12,55 | ||||
| 2025-08-08 | 13F | Gts Securities Llc | 6 958 | 264 | ||||||
| 2025-07-17 | 13F | Clay Northam Wealth Management, LLC | 5 500 | 209 | ||||||
| 2025-07-31 | 13F | Pinnacle Wealth Management Group, Inc. | 37 271 | −1,32 | 1 417 | 4,73 | ||||
| 2025-04-14 | 13F | ARS Wealth Advisors Group, LLC | 0 | −100,00 | 0 | |||||
| 2025-08-13 | 13F | Grantvest Financial Group LLC | 9 249 | 49,20 | 352 | 58,11 | ||||
| 2025-08-04 | 13F | Assetmark, Inc | 37 | −52,56 | 1 | −50,00 | ||||
| 2025-07-28 | 13F | Cornerstone Wealth Group, LLC | 31 993 | 0,00 | 1 216 | 6,20 | ||||
| 2025-08-14 | 13F | GWM Advisors LLC | 31 991 | −10,60 | 1 216 | −5,15 | ||||
| 2025-08-04 | 13F | Spire Wealth Management | 13 702 | −8,39 | 521 | −2,80 | ||||
| 2025-08-15 | 13F | Captrust Financial Advisors | 0 | −100,00 | 0 | |||||
| 2025-07-08 | 13F | Ptm Wealth Management, Llc | 17 075 | −5,10 | 653 | 8,31 | ||||
| 2025-08-04 | 13F | Pensionmark Financial Group, Llc | 158 530 | 26,12 | 6 026 | 33,83 | ||||
| 2025-08-12 | 13F | Calton & Associates, Inc. | 6 595 | 0,00 | 251 | 5,93 | ||||
| 2025-08-08 | 13F | Foundations Investment Advisors, LLC | 36 419 | 44,47 | 1 384 | 53,44 | ||||
| 2025-07-22 | 13F | Diligent Investors, LLC | 54 470 | 0,00 | 2 070 | 6,10 | ||||
| 2025-08-01 | 13F | PCA Investment Advisory Services Inc. | 31 406 | 0,00 | 1 194 | 6,14 | ||||
| 2025-07-21 | 13F | Keystone Financial Group, Inc. | 13 922 | −4,86 | 534 | 1,72 | ||||
| 2025-08-14 | 13F | Old Mission Capital Llc | 512 215 | 3 816,62 | 19 469 | 4 060,04 | ||||
| 2025-07-21 | 13F | Seros Financial, LLC | 14 450 | 0,00 | 549 | 6,19 | ||||
| 2025-07-16 | 13F | PFS Partners, LLC | 1 200 | 46 | ||||||
| 2025-08-12 | 13F | New Republic Capital, LLC | 13 548 | 0,00 | 515 | 5,98 | ||||
| 2025-07-28 | 13F | Sagespring Wealth Partners, Llc | 8 535 | 5,71 | 324 | 12,11 | ||||
| 2025-08-14 | 13F | First Commonwealth Financial Corp /pa/ | 16 258 | 11,39 | 618 | 18,20 | ||||
| 2025-07-29 | 13F | Stratos Wealth Advisors, LLC | 49 224 | 0,00 | 1 871 | 6,13 | ||||
| 2025-08-07 | 13F | Lakeridge Wealth Management LLC | 18 930 | 10,51 | 720 | 17,29 | ||||
| 2025-08-08 | 13F | Capital Investment Advisory Services, LLC | 4 056 | 1,25 | 154 | 7,69 | ||||
| 2025-07-31 | 13F | Cambridge Investment Research Advisors, Inc. | 106 785 | −11,38 | 4 | 0,00 | ||||
| 2025-07-09 | 13F | Lineweaver Wealth Advisors, LLC | 37 785 | 0,00 | 1 436 | 6,13 | ||||
| 2025-08-11 | 13F | Outlook Wealth Advisors, LLC | 7 383 | −86,00 | 281 | −85,17 | ||||
| 2025-07-25 | 13F | Hazlett, Burt & Watson, Inc. | 3 435 | 0,00 | 0 | |||||
| 2025-07-30 | 13F | Brookstone Capital Management | 989 111 | −2,11 | 37 596 | 3,88 | ||||
| 2025-08-13 | 13F | Cresset Asset Management, LLC | 39 340 | −0,00 | 1 495 | 6,10 | ||||
| 2025-07-21 | 13F | Patriot Financial Group Insurance Agency, LLC | 35 937 | 2,57 | 1 366 | 8,76 | ||||
| 2025-08-01 | 13F | Envestnet Asset Management Inc | 218 876 | 1,86 | 8 319 | 8,08 | ||||
| 2025-07-25 | 13F | Mitchell Capital Management Co | 0 | −100,00 | 0 | |||||
| 2025-08-08 | 13F | Wealth Alliance | 49 945 | 0,00 | 1 898 | 6,09 | ||||
| 2025-08-12 | 13F | LPL Financial LLC | 222 140 | 4,23 | 8 444 | 10,60 | ||||
| 2025-08-15 | 13F | Kestra Advisory Services, LLC | 331 289 | −0,88 | 12 592 | 5,18 | ||||
| 2025-07-28 | 13F | Harbour Investments, Inc. | 8 736 | 12,74 | 332 | 19,86 | ||||
| 2025-07-22 | 13F | Belpointe Asset Management LLC | 33 135 | −4,85 | 1 259 | 0,96 | ||||
| 2025-07-28 | 13F | Mutual Advisors, LLC | 6 921 | −3,58 | 268 | 4,71 | ||||
| 2025-07-30 | 13F | Evermay Wealth Management Llc | 3 657 | 0,00 | 139 | 6,92 | ||||
| 2025-08-07 | 13F | Allworth Financial LP | 3 711 | 0,00 | 141 | 7,63 | ||||
| 2025-04-10 | 13F | Whipplewood Advisors, LLC | 0 | −100,00 | 0 | |||||
| 2025-07-25 | 13F | We Are One Seven, LLC | 18 881 | 718 | ||||||
| 2025-08-07 | 13F | Resources Investment Advisors, LLC. | 72 853 | 166,27 | 2 769 | 182,55 | ||||
| 2025-08-01 | 13F | FSA Advisors, Inc. | 38 991 | −15,60 | 1 482 | −10,40 | ||||
| 2025-08-12 | 13F | SRS Capital Advisors, Inc. | 8 097 | 12,77 | 308 | 19,46 | ||||
| 2025-08-14 | 13F | Colony Group, LLC | 53 235 | 42,16 | 2 023 | 50,86 | ||||
| 2025-07-14 | 13F | AdvisorNet Financial, Inc | 1 498 | −16,69 | 57 | −12,50 | ||||
| 2025-08-01 | 13F | Corrado Advisors, Llc | 28 822 | −0,29 | 1 096 | 5,80 | ||||
| 2025-08-14 | 13F | Sunbelt Securities, Inc. | 8 047 | 60,94 | 296 | 65,36 | ||||
| 2025-08-12 | 13F | MAI Capital Management | 78 344 | −4,77 | 2 978 | 1,05 | ||||
| 2025-07-28 | 13F | RFG Advisory, LLC | 0 | −100,00 | 0 | |||||
| 2025-08-11 | 13F | Bellwether Advisors, LLC | 53 542 | 106,94 | 2 035 | 119,76 | ||||
| 2025-08-05 | 13F | Mma Asset Management Llc | 10 153 | 386 | ||||||
| 2025-07-23 | 13F | Trifecta Capital Advisors, LLC | 541 | 0,00 | 21 | 5,26 | ||||
| 2025-07-03 | 13F | Fiduciary Financial Group, Llc | 9 106 | 29,51 | 346 | 42,56 | ||||
| 2025-07-28 | 13F | Elmwood Wealth Management, Inc. | 18 910 | 719 | ||||||
| 2025-07-09 | 13F | Tounjian Advisory Partners, Llc | 11 352 | −0,86 | 407 | −0,98 | ||||
| 2025-08-05 | 13F | WorthPointe, LLC | 47 019 | −7,57 | 1 787 | −1,92 | ||||
| 2025-04-15 | 13F | Noble Wealth Management PBC | 26 327 | 943 | ||||||
| 2025-08-05 | 13F | Sigma Planning Corp | 5 477 | −94,69 | 208 | −94,37 | ||||
| 2025-08-04 | 13F | Arkadios Wealth Advisors | 19 987 | 9,72 | 760 | 16,41 | ||||
| 2025-07-17 | 13F | Wagner Wealth Management, Llc | 2 000 | 0,00 | 76 | 7,04 | ||||
| 2025-08-14 | 13F | Sequent Planning LLC | 8 564 | 0,00 | 326 | 6,21 | ||||
| 2025-08-15 | 13F | Morgan Stanley | 4 272 | 2 427,81 | 162 | 2 600,00 | ||||
| 2025-07-14 | 13F | Kfg Wealth Management, Llc | 69 594 | −1,16 | 2 645 | 4,88 | ||||
| 2025-08-11 | 13F | WPWealth LLP | 10 194 | −35,13 | 387 | −31,14 | ||||
| 2025-08-14 | 13F | Kovitz Investment Group Partners, LLC | 340 090 | 3,31 | 12 927 | 9,63 | ||||
| 2025-07-10 | 13F | Three Seasons Wealth, LLC | 12 055 | 0,00 | 458 | 6,26 | ||||
| 2025-07-23 | 13F | Castle Rock Wealth Management, LLC | 99 861 | −5,37 | 3 842 | 1,53 | ||||
| 2025-08-14 | 13F | Mercer Global Advisors Inc /adv | 52 435 | −3,22 | 1 993 | 2,73 | ||||
| 2025-04-22 | 13F | Castleview Partners, Llc | 0 | −100,00 | 0 | |||||
| 2025-07-10 | 13F | Atticus Wealth Management, Llc | 34 596 | 0,00 | 1 315 | 6,05 | ||||
| 2025-08-14 | 13F | Aqr Capital Management Llc | 6 622 | −69,59 | 252 | −67,82 | ||||
| 2025-05-15 | 13F | Hrt Financial Lp | 0 | −100,00 | 0 | |||||
| 2025-08-05 | 13F | Bank Of Montreal /can/ | 676 | 0,00 | 26 | 4,17 | ||||
| 2025-08-04 | 13F | Creative Financial Designs Inc /adv | 9 800 | −1,21 | 372 | 4,79 | ||||
| 2025-08-13 | 13F | Continuum Advisory, LLC | 30 835 | 64,46 | 1 172 | 74,66 | ||||
| 2025-08-13 | 13F | EverSource Wealth Advisors, LLC | 316 | 0,00 | 12 | 9,09 | ||||
| 2025-07-14 | 13F | Chris Bulman Inc | 73 300 | 0,89 | 2 786 | 7,07 | ||||
| 2025-07-17 | 13F | Global Trust Asset Management, LLC | 7 000 | 0,00 | 266 | 6,40 | ||||
| 2025-08-14 | 13F | Alliancebernstein L.p. | 3 674 042 | −1,12 | 139 650 | 4,93 | ||||
| 2025-07-31 | 13F | Cardinal Point Capital Management, ULC | 7 190 | 0,00 | 273 | 6,23 | ||||
| 2025-08-12 | 13F | Jpmorgan Chase & Co | 4 340 | 38,35 | 165 | 46,43 | ||||
| 2025-07-22 | 13F | Miracle Mile Advisors, LLC | 36 766 | 0,00 | 1 397 | 6,16 | ||||
| 2025-07-24 | 13F | IFP Advisors, Inc | 54 956 | 2,70 | 2 089 | 8,98 | ||||
| 2025-08-12 | 13F | Coldstream Capital Management Inc | 0 | −100,00 | 0 | |||||
| 2025-08-12 | 13F | Tradition Wealth Management, LLC | 70 727 | −4,90 | 2 688 | 0,90 | ||||
| 2025-05-22 | 13F | Mattson Financial Services, LLC | 0 | −100,00 | 0 | |||||
| 2025-08-29 | 13F | Evolution Wealth Management Inc. | 1 250 | 48 | ||||||
| 2025-07-17 | 13F | Janney Montgomery Scott LLC | 66 805 | 1,17 | 3 | 0,00 | ||||
| 2025-08-15 | 13F | Chapman Financial Group, Llc | 28 712 | 40,88 | 1 091 | 45,66 | ||||
| 2025-08-07 | 13F | Runnymede Capital Advisors, Inc. | 0 | −100,00 | 0 | |||||
| 2025-08-13 | 13F | Capital Analysts, Inc. | 13 438 | 0,00 | 1 | |||||
| 2025-08-19 | 13F | Advisory Services Network, LLC | 60 971 | 0,00 | 2 351 | 7,70 | ||||
| 2025-08-08 | 13F | Kingsview Wealth Management, LLC | 39 018 | −0,13 | 1 483 | 6,00 | ||||
| 2025-08-14 | 13F | UBS Group AG | 7 141 | 271 | ||||||
| 2025-08-12 | 13F | Wood Tarver Financial Group, LLC | 12 785 | −49,34 | 0 | −100,00 | ||||
| 2025-07-29 | 13F | Chicago Partners Investment Group LLC | 12 219 | −3,12 | 471 | 4,20 | ||||
| 2025-08-13 | 13F | Cerity Partners LLC | 26 640 | 23,11 | 1 013 | 30,58 | ||||
| 2025-07-15 | 13F | BCS Wealth Management | 148 327 | −3,57 | 6 | 0,00 | ||||
| 2025-08-05 | 13F | Huntington National Bank | 10 | |||||||
| 2025-08-14 | 13F | Diversify Advisory Services, LLC | 45 219 | −4,84 | 1 759 | 3,78 | ||||
| 2025-08-11 | 13F | HighTower Advisors, LLC | 176 465 | 13,06 | 6 707 | 19,98 | ||||
| 2025-07-21 | 13F | Triad Wealth Partners, LLC | 14 171 | −3,44 | 539 | 2,48 | ||||
| 2025-07-02 | 13F | HBW Advisory Services LLC | 18 992 | −1,67 | 722 | 4,34 | ||||
| 2025-07-14 | 13F | Southland Equity Partners LLC | 176 060 | 7,10 | 6 692 | 13,65 | ||||
| 2025-07-29 | 13F | Straight Path Wealth Management | 16 644 | 0,00 | 633 | 6,04 | ||||
| 2025-08-13 | 13F | Transce3nd, LLC | 0 | −100,00 | 0 | |||||
| 2025-07-24 | 13F | Bernard Wealth Management Corp. | 1 074 | −12,54 | 41 | −6,98 | ||||
| 2025-07-21 | 13F | Catalina Capital Group, LLC | 8 004 | 0,00 | 304 | 6,29 | ||||
| 2025-08-08 | 13F | Cetera Investment Advisers | 252 398 | 0,81 | 9 594 | 6,98 | ||||
| 2025-07-22 | 13F | DAVENPORT & Co LLC | 5 338 | 203 | ||||||
| 2025-08-13 | 13F | Townsquare Capital Llc | 0 | −100,00 | 0 | |||||
| 2025-08-14 | 13F | Mariner, LLC | 12 924 | 0,00 | 491 | 6,28 | ||||
| 2025-07-25 | 13F | Sequoia Financial Advisors, LLC | 38 973 | −29,41 | 1 481 | −25,09 | ||||
| 2025-08-08 | 13F | Creative Planning | 0 | −100,00 | 0 | |||||
| 2025-07-08 | 13F | Gradient Investments LLC | 0 | −100,00 | 0 | |||||
| 2025-07-22 | 13F | Beacon Financial Advisory LLC | 10 842 | 25,46 | 412 | 33,33 | ||||
| 2025-07-30 | 13F | IMG Wealth Management, Inc. | 1 574 | 60 | ||||||
| 2025-07-29 | 13F | BKD Wealth Advisors, LLC | 79 532 | −3,39 | 3 023 | 2,54 | ||||
| 2025-08-05 | 13F | BCGM Wealth Management, LLC | 19 693 | 0,00 | 749 | 6,10 | ||||
| 2025-08-06 | 13F | Bullseye Investment Management, LLC | 23 006 | 0,00 | 824 | 0,00 | ||||
| 2025-07-21 | 13F | Ameritas Advisory Services, LLC | 470 | −92,81 | 18 | −92,74 | ||||
| 2025-07-11 | 13F | Farther Finance Advisors, LLC | 124 769 | 352,78 | 4 742 | 378,51 | ||||
| 2025-07-22 | 13F | Berkshire Money Management, Inc. | 1 621 | 62 | ||||||
| 2025-08-12 | 13F | Change Path, LLC | 41 849 | −1,20 | 1 591 | 4,81 | ||||
| 2025-08-08 | 13F | Emerald Investment Partners, Llc | 7 481 | −1,12 | 284 | 4,80 | ||||
| 2025-07-24 | 13F | Riverchase Wealth Management, Llc | 55 663 | 0,00 | 2 116 | 6,12 | ||||
| 2025-08-01 | 13F | Stuart Chaussee & Associates, Inc. | 11 365 | 432 | ||||||
| 2025-08-19 | 13F | National Asset Management, Inc. | 0 | −100,00 | 0 | |||||
| 2025-08-15 | 13F | Tower Research Capital LLC (TRC) | 162 | 6 | ||||||
| 2025-05-14 | 13F | Delta Investment Management, LLC | 0 | −100,00 | 0 | |||||
| 2025-08-14 | 13F | Certified Advisory Corp | 24 037 | −1,42 | 914 | 4,58 | ||||
| 2025-08-12 | 13F | Archer Investment Corp | 37 400 | −27,24 | 1 422 | −22,81 | ||||
| 2025-08-13 | 13F | Luminist Capital LLC | 0 | −100,00 | 0 | |||||
| 2025-07-30 | 13F | Phoenix Holdings Ltd. | 14 375 | 0,00 | 546 | 6,23 | ||||
| 2025-08-13 | 13F | RK Capital Management, LLC/FL | 324 093 | 0,00 | 12 319 | 6,11 | ||||
| 2025-08-14 | 13F | Benjamin Edwards Inc | 12 513 | 1,07 | 476 | 7,22 | ||||
| 2025-08-11 | 13F | Principal Securities, Inc. | 5 136 | 77,35 | 195 | 83,96 | ||||
| 2025-08-12 | 13F | Weaver Consulting Group | 103 870 | 0,10 | 3 948 | 6,21 | ||||
| 2025-07-22 | 13F | BridgePort Financial Solutions, LLC | 0 | −100,00 | 0 | |||||
| 2025-08-14 | 13F/A | Barclays Plc | 1 994 | 0 | ||||||
| 2025-08-08 | 13F | Firestone Capital Management | 8 917 | 0,00 | 339 | 5,96 | ||||
| 2025-08-12 | 13F | Winnow Wealth Llc | 0 | 0 | ||||||
| 2025-07-28 | 13F | Axxcess Wealth Management, Llc | 14 585 | 0,00 | 554 | 6,13 | ||||
| 2025-07-24 | 13F | Blair William & Co/il | 229 649 | 0,52 | 8 729 | 6,66 | ||||
| 2025-09-04 | 13F/A | Advisor Group Holdings, Inc. | 1 155 859 | 59,92 | 43 934 | 69,70 | ||||
| 2025-08-11 | 13F | Anfield Capital Management, LLC | 345 | 13 | ||||||
| 2025-08-14 | 13F | Betterment LLC | 11 130 | −6,86 | 0 | |||||
| 2025-07-23 | 13F | Guild Investment Management, Inc. | 124 345 | 203,28 | 4 726 | 221,93 | ||||
| 2025-07-14 | 13F | CRA Financial Services, LLC | 28 800 | 0,00 | 1 095 | 6,11 | ||||
| 2025-08-13 | 13F | Beacon Pointe Advisors, LLC | 176 143 | −8,19 | 6 695 | −2,58 | ||||
| 2025-05-09 | 13F | Rps Advisory Solutions Llc | 0 | −100,00 | 0 | −100,00 |